
Abstract
A novel smartphone-based detection device was created to detect infectious pathogens directly from diluted (10%) human whole blood. The model pathogen was histidine-rich protein 2 (HRP-2), an antigen specific to Plasmodium falciparum (malaria). Anti–HRP-2–conjugated submicrobeads were mixed with HRP-2–infused 10% blood in a lab-on-a-chip device. The white LED flash and the digital camera of the smartphone were used as light source and detector, which delivered light to and from the bead and blood mixture via optofluidic channels in the lab-on-a-chip. The optofluidic channels were angled at 45 degrees to capture the Mie scatter from the sample. Considering the absorption and scattering characteristics of blood (red/infrared preferred) and the Mie scatter simulations for microbead immunoagglutination (UV preferred), blue detection showed the best results. The detection limit was 1 pg/mL in 10% blood. The linear range was from 1 pg/mL to 10 ng/mL. A handheld device, easily attachable to a single smartphone, was finally designed and fabricated using optical mirrors and lenses and successfully detected the HRP-2 from 10% blood. The total assay time was approximately 10 min. The proposed device can potentially be used for detecting a wide range of blood infection with high sensitivity.
Keywords
Introduction
Pathogens in blood can cause many diseases with a high mortality rate (up to 50%) 1 in both humans and animals. They must be detected as rapidly and as accurately as possible, preferably at the point of care. Clinical diagnosis of such pathogens has been performed by cell-counting or growth-based techniques, which are time-consuming and require trained personnel in a laboratory setting. Detection of malaria, specifically Plasmodium falciparum, the model pathogen in this study, has typically been conducted via the peripheral blood smear, which is the current gold standard for malaria detection. Despite its superior detection limit (as low as 1 parasite per microliter of whole blood) and its ability to identify the species of parasites, 2 it requires a dedicated laboratory and specialized equipment, such as a high-power microscope. In addition, extra time is required to order the diagnosis of a blood sample and to transport the sample to a lab, on top of the actual assay time of 1 to 3 h. 3 Alternatively, such pathogens can be cultured from blood samples, which typically takes a couple of days to culture and process, in addition to the time required to deliver the samples to a lab. 4
Other assay methods to detect pathogens from blood include enzyme-linked immunosorbent assay (ELISA) and polymerase chain reaction (PCR). These can be faster and simpler than blood smears and cultures but with typically inferior detection limits. However, both ELISA and PCR still require a dedicated laboratory and specialized equipment, also leading to additional processing and delivery time requirements.
The lengthy assay time and other difficulties can be overcome through the use of a lab-on-a-chip device. In addition, more reproducible assays are possible on lab-on-a-chip devices due to their strict laminar flow characteristics as well as precision flow control, leading to smaller error bars and subsequently much higher sensitivity (this will be further discussed at the end of introduction). Unfortunately, only a limited number of publications have reported demonstrating lab-on-a-chip detection of pathogens from blood samples. In addition, many of such publications have reported the use of specialized equipment. For the cases of malaria detection, use of a spectrometer, 5 a semiconductor characterization system, 6 and a high-power microscope 7 has been reported.
To keep the equipment simple, inexpensive, and easy to operate, the optical detection can be designed to be entirely smartphone based. The system only requires the use of camera-enabled smartphones to serve as both an incident light source as well as a detector. The novel use of smartphones for detecting pathogens in human blood is significant due to the rising popularity of smartphones globally and the simplification of the overall assay, in terms of both user interface and reduced cost over currently existing malaria detection methods. Global smartphone shipments exceeded 488 million units in 2011, surpassing total personal computer shipments and accounting for a 63% rise in shipments compared with 2010. 8 Since a smartphone serves as the primary user interface for detection, the overall time for someone to familiarize himself or herself with the experimental setup is minimized, and the total cost of the system is greatly reduced over that of current detection methods by eliminating the need for a laboratory environment and specialized equipment. Last, using a smartphone as the primary sensing element makes for a completely portable detection method, allowing it to serve as a true point-of-care diagnostic for early and rapid detection of pathogens from blood.
The use of smartphones in biosensing and medical diagnostics has recently gained popularity, particularly as an accessible, low-cost alternative to high-powered microscopes and other expensive equipment. For example, Zhu et al., 9 Tseng et al., 10 and Coskun et al. 11 have all demonstrated the use of smartphones in both general and fluorescent microscopic imaging; Bishara et al. 12 used a similar technique for imaging malaria. Zhu et al.13,14 used the same technology for analyzing blood with flow cytometry. In addition, immunoassays have also been quantified using smartphones, as demonstrated in Zhu et al. 15 and Mudanyali et al. 16
Malaria antigens are used as the model pathogen in this study—specifically, P. falciparum. Plasmodium species are protozoa that reside in Anopheles mosquitoes and are responsible for malaria for humans, with transmission occurring via blood contact with an infected mosquito. Histidine-rich protein 2 (HRP-2) is used as a model malaria antigen, which is expressed exclusively by P. falciparum.
Highly sensitive detection can be demonstrated through the utilization of a microbead immunoagglutination assay in a lab-on-a-chip, in which antibody-conjugated microbeads agglutinate upon adding target antigens. Combined with Mie scatter detection using microfabricated optical waveguides or “optofluidic channels,” our laboratory has previously demonstrated an extremely low detection limit of 10 pg/mL influenza A antigens in a 1% fecal sample matrix and a very broad linear range of seven orders of magnitude using a monochromatic UV light source and a miniature spectrometer. 17 These results were made possible through in-channel mixing of microbeads and target molecules under strict laminar flow, generating highly reproducible assays and, as a result, smaller error bars. When incorporated into a lab-on-a-chip, optofluidic channels greatly enhance the reproducibility of the assay, leading to lower detection limits.
In this study, a pg/mL level detection of HRP-2 from human blood is attempted using an immunoagglutination assay in an optofluidic lab-on-a-chip device; preliminary work on HRP-2 detection using a spectrometer recently has been reported in Stemple et al. 18 Unlike the sample matrices in our previous work, 17 blood is a challenging sample matrix with regard to optical detection, and the use of a smartphone may further complicate the analyses, since smartphones are not designed for monochromatic or spectrophotometric optical detection. However, they do have a certain degree of spectrometric sensing, achieved through breaking the light signal into three basic color components: red, green, and blue. In addition, the use of a “white” light source (white LED flash of a smartphone) and “white” microbeads (which scatters light in all wavelengths, including UV) would make the smartphone-based image sensing more applicable and potentially more sensitive.
The scatter angle, bead size, and light wavelength are carefully selected such that microbead scatter is maximized and background blood scatter is minimized. To keep the equipment simple, inexpensive, and easy to operate, the Mie scatter detection was designed to be entirely smartphone based; the system requires only that camera-enabled smartphones serve as both an incident light source as well as a detector.
Materials and Methods
Target Antigens, Antibodies, and Microbeads
HRP-2 recombinant antigens were chosen as the target of this experiment due to their specific expression by P. falciparum. 19 Monoclonal antibodies specific to HRP-2 were covalently bonded to 920-nm carboxylated polystyrene beads and introduced to a human blood sample containing HRP-2 within a lab-on-a-chip test environment. A base concentration of 1 mg/mL HRP-2 was serially diluted with phosphate-buffered saline (PBS) to produce a standard curve ranging from 1 pg/mL to 10 ng/mL. Each concentration of HRP-2 was introduced to a sample of whole human blood, and the resulting solutions were again serially diluted with PBS to achieve a 10% solution of human blood complexed with HRP-2. The human blood always remained at a 10% dilution regardless of the HRP-2 concentration.
Optofluidic Lab-on-a-Chip
The blood solution and microbeads were introduced separately to each of the inlets of a y-channel lab-on-a-chip and mixed together in a central channel via an external syringe attached to the outlet of a y-channel; the dimensions of the channel were 1 mm wide and 100 µm deep. The chips were created from polydimethylsiloxane (PDMS) poured into a silicon master mold formed using photolithography and deep reactive ion etching. The chip featured two waveguides, or optofluidic channels, which measured 750 µm wide and 100 µm deep and were filled with microscope immersion oil (n = 1.515). Together with the surrounding PDMS material and a refractive index of 1.41, the critical angle of total internal reflection becomes arcsin(1.41/1.515) = 68.5°. The layout of an optofluidic lab-on-a-chip is shown in Figure 1A .
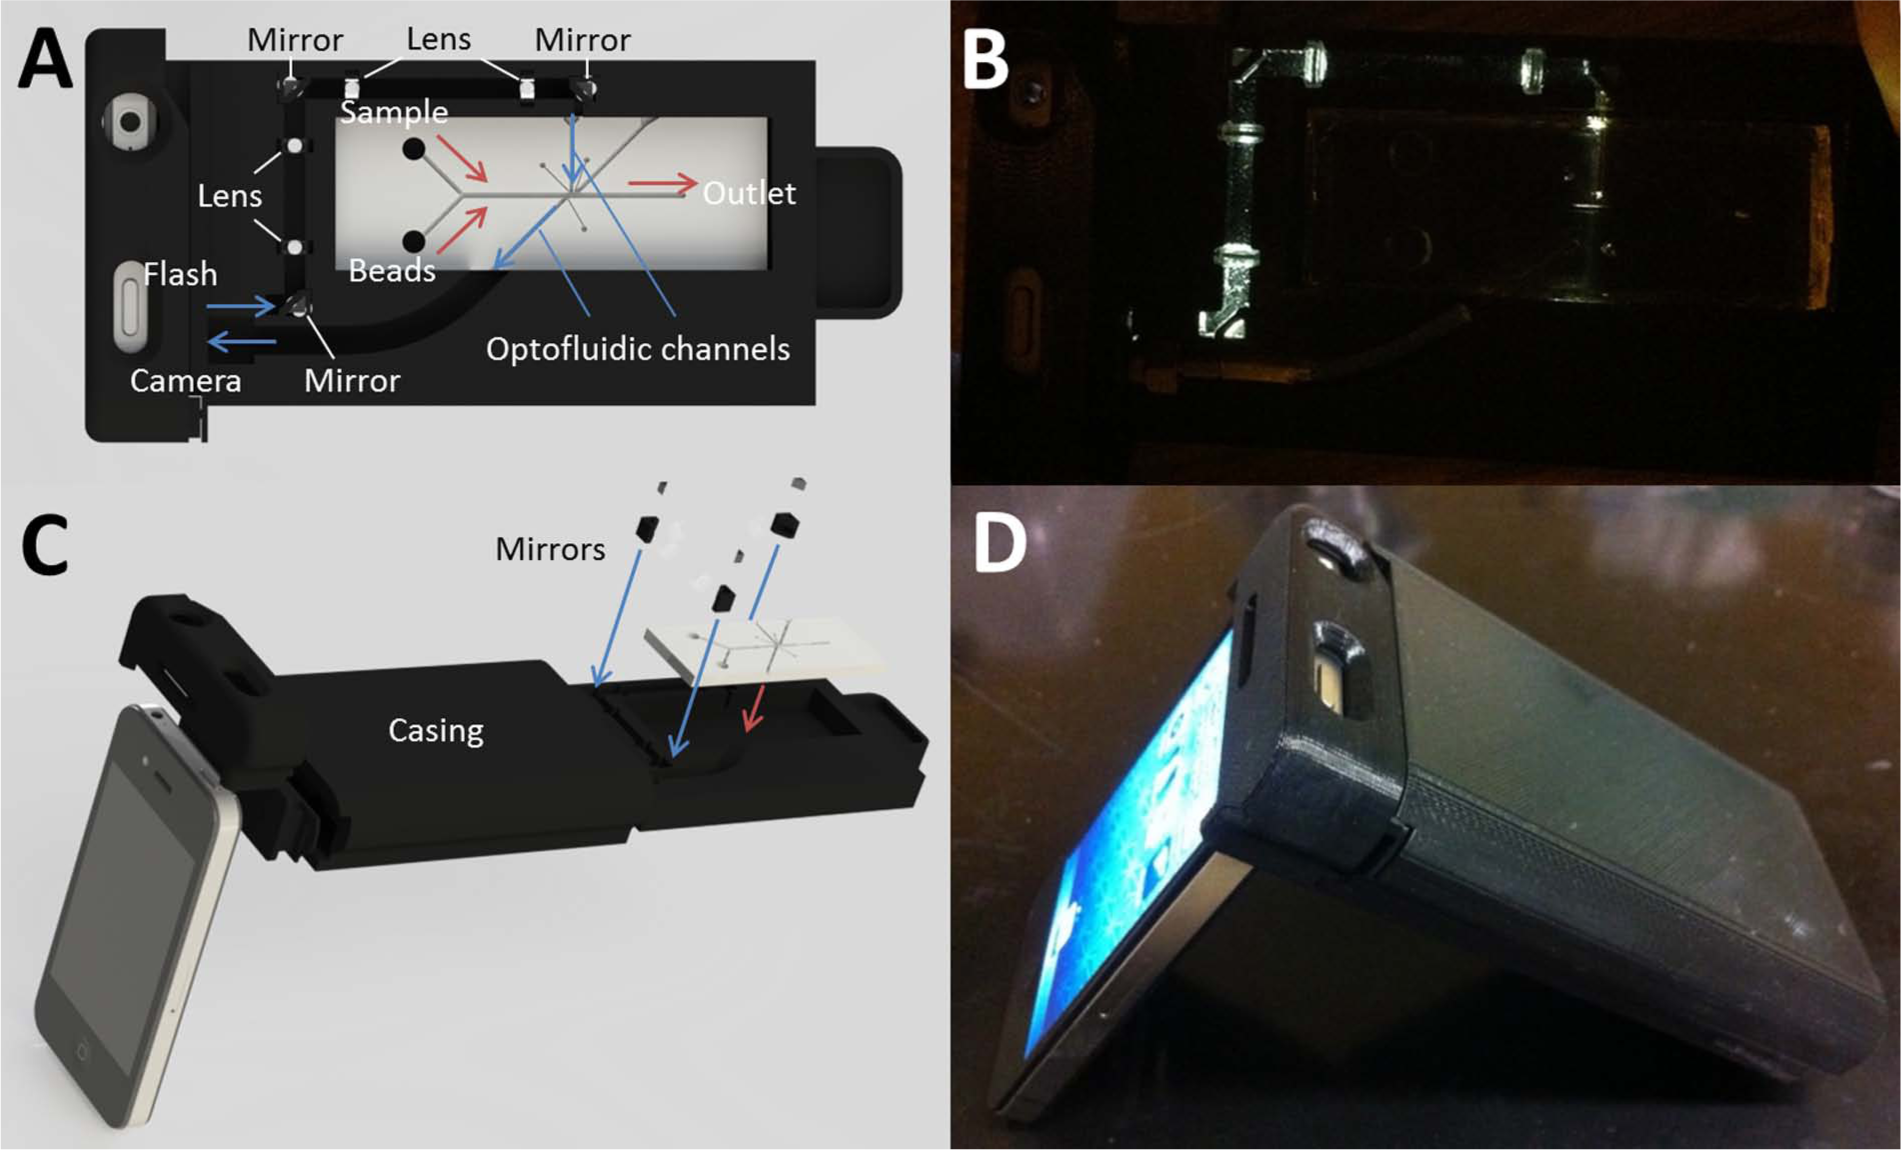
Handheld device, using a single iPhone (Apple, Inc., Cupertino, CA) attached to a tray that contains an optofluidic lab-on-a-chip, with lenses and right angle mirrors. A white LED flash of the iPhone 4 was turned on while capturing the images. All other experimental conditions were identical to those of the benchtop device. (
Benchtop Device with Two Smartphones
A benchtop device with two smartphones was initially developed and assembled to optimize the sensing parameters, since it was believed that such a system would be more easily modifiable and modular. Once optimization was completed with this benchtop device, fabrication of a finalized portable device could be made that requires no further modification.
Optical fibers (Ocean Optics, Dunedin, FL) were partially inserted into the optofluidic channels; one optical fiber was used to deliver incident light from the “white” LED light source of an Apple iPhone 4 (model A1332; Apple, Inc., Cupertino, CA), while the other served to detect light scatter as a result of immunoagglutination of HRP-2 to the antibody-conjugated microbeads. The 5-megapixel camera of a second iPhone 4, featuring a native resolution of 2592 × 1936 pixels, captured an image of an optical fiber, which delivered scattered light from the central microfluidic channel. The area of interest was the central portion of the image, and a 1300-pixel circular crop of the central portion of the image was made to remove the effect of background noise. Two separate iPhones were initially required for the purpose of simplifying the software setup and subsequent focusing and capturing of the image. The final “benchtop” experimental setup is shown in Figure 2 . The “tray,” which accommodates the optofluidic lab-on-a-chip and a pair of optical fibers, and the two smartphone “holders” for positioning the smartphones to the “tray” were all designed and fabricated in SolidWorks (Dassault Systèmes SolidWorks Corporation, Waltham, MA) and manufactured using a Dimension uPrint rapid prototyping device (Stratasys, Inc., Eden Prairie, MN), with acrylonitrile butadiene styrene (ABS) material (Stratasys, Inc.).
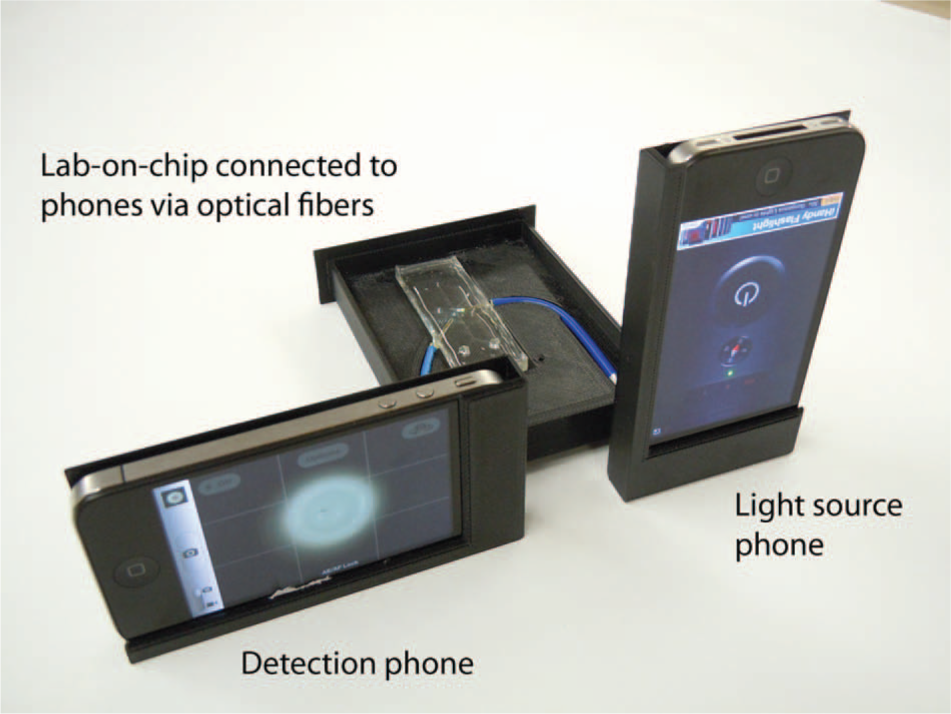
Benchtop device, using two iPhones (Apple, Inc., Cupertino, CA) attached to a tray that contains an optofluidic lab-on-a-chip. Target solution consisting of histidine-rich protein 2 (HRP-2) combined in 10% human blood is mixed with antibody-conjugated microbeads in the central channel of the lab-on-a-chip; one iPhone 4 (right) is used to provide a constant light source via the rear-mounted flash LED, while a second iPhone 4 (left) is used to capture an image of the optical fiber, which delivered scattered light from the lab-on-a-chip.
A total of six images were captured for each trial: one of a negative control (no HRP-2 in 10% blood) and five more with varying HRP-2 concentrations in 10% blood, all of which were mixed with antibody-conjugated microbeads within the lab-on-a-chip. A total of three trials were made. The purpose of capturing a negative control image for every trial is to eliminate the effects of variations in the blood and microbead samples as well as account for differences between different lab-on-chips. The images were imported into Photoshop CS5 (Adobe, San Jose, CA), and the average intensity of blue, green, and red light over the entirety of a cropped image was observed. Photoshop’s built-in histogram was used to observe the tonal range of the blue, green, and red components. Using the same 8-bit color reference, the histogram calculated and displayed the mean intensity value of each individual color channel on the 0 to 255 scale. These values were normalized to the value for the negative control data point, and trends in the relative changes in blue, green, and red light intensities were observed.
Handheld Device with Single Smartphone
The tray and two smartphone holders were combined into a single device to facilitate simple attachment to a single smartphone (i.e., using its white LED flash and its digital camera at the same time). To this end, the lenses (cat. CAX100; Thor Labs, Inc., Newton, NJ) and the right-angle mirrors (cat. 49-405; Edmund Optics, Barrington, NJ) were mounted into the device, as shown in Figure 1 . Four lenses total were used to focus light after hitting the mirrors. The lens device was again designed in SolidWorks (Dassault Systèmes SolidWorks Corporation) and manufactured using a Dimension uPrint rapid prototyping device with ABS material (Stratasys, Inc.). The optofluidic lab-on-a-chip was identical to the one used for a benchtop device, and samples were added to the handheld device as described with the benchtop device. Images were captured using a single iPhone 4, again using its 5-megapixel camera and white LED flash for data acquisition. Images were analyzed as described previously.
Results and Discussion
Assay Results with a Benchtop Device
Figure 3 shows representative images of an optical fiber from the optofluidic lab-on-a-chip taken with an iPhone 4 using the benchtop device. Note that the white LED from the iPhone 4 delivered composite red, green, and blue light, to which the human cone cells are sensitive. Figure 3A shows PBS mixed with antibody-conjugated microbeads (hereafter referred to as microbeads), which is largely white. Figure 3B shows 10% blood with no target (i.e., negative control) with microbeads, which shows noticeable red coloration. Figure 3C , D shows 10% blood with 1 pg/mL and 10 ng/mL HRP-2, respectively. Red coloration seems to get reduced upon increasing the HRP-2 concentration, despite the fact that the blood itself was not diluted.
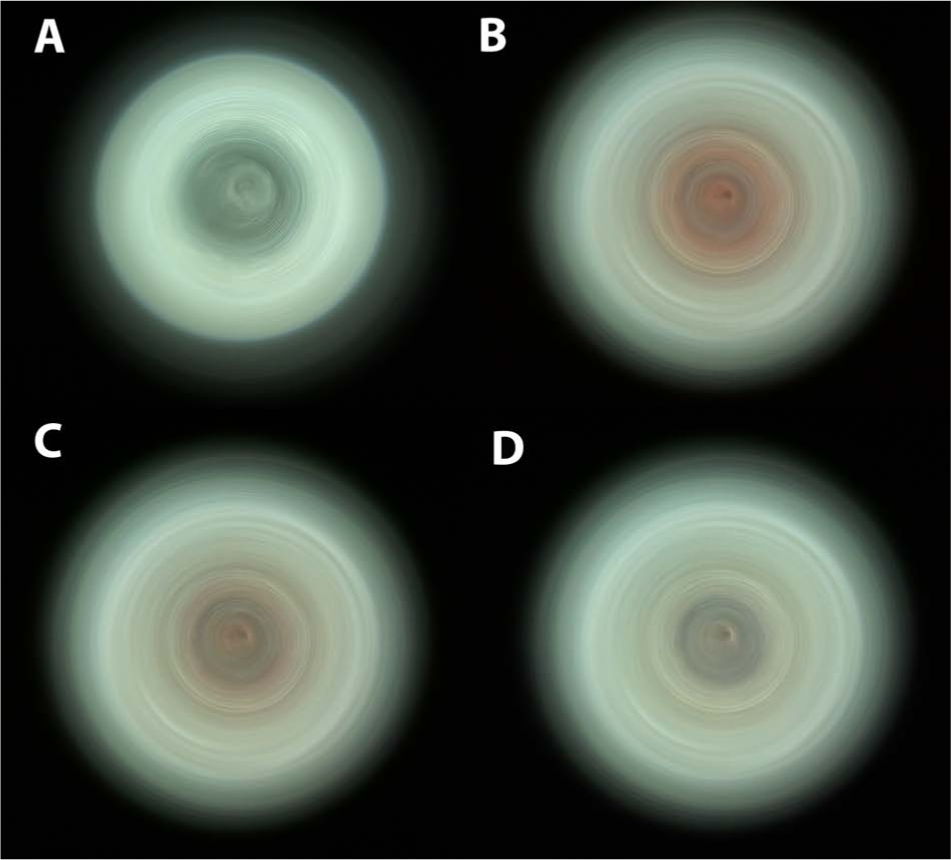
Raw images of the end of an optical fiber from the optofluidic lab-on-a-chip, captured with an iPhone 4 (Apple, Inc., Cupertino, CA) and using the benchtop device. (
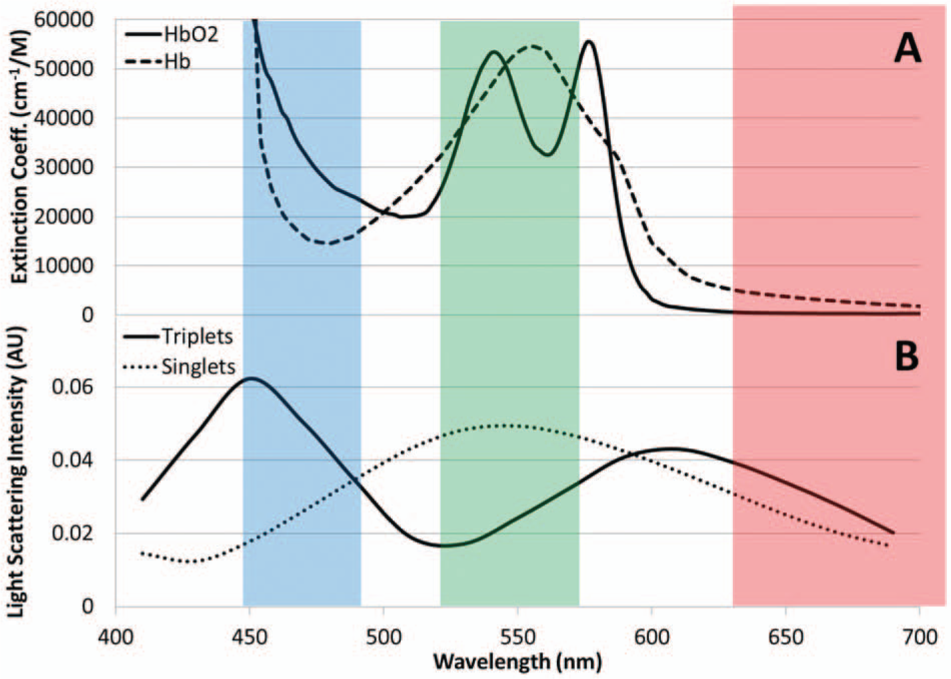
The absorption and scatter characteristics of blood are primarily determined by red blood cells or, more precisely, hemoglobin. Figure 4A shows the absorption spectra of oxygenated and deoxygenated hemoglobin and indicates that blood absorbs most in green and, to some extent, in blue. As a result, blood looks red upon white light irradiation, such as by sunlight or a light bulb. Therefore, it is logical to use red for quantifying the extent of Mie light scatter coming from microbead immunoagglutination, since blood does not absorb red.
(
However, the Mie scatter simulation, performed using the online software provided by Prahl, 20 showed some intriguing results ( Fig. 4B ). The light scatter intensity was simulated for singlet (i.e., not agglutinated) and triplet 920-nm beads (i.e., immunoagglutinated). According to You et al., 21 the greatest amount of Mie light scatter was observed when three beads were immunoagglutinated together. With the fixed scatter angle of 45° and refractive indices of 1.33 (water) and 1.59 (polystyrene beads), the Mie scatter intensities were plotted against the wavelengths of visible light. The largest scatter increase between singlets and triplets was observed with blue (~450 nm), while a relatively small but consistent increase was observed with red (~650 nm). This result correlates strongly with the theory that the shorter the wavelength, the more energy present (E = hc/λ, where h is the Planck’s constant, c is the speed of light, and λ is the wavelength of light).
Since blood absorbs blue much less than green ( Fig. 4A ), it is possible to use blue detection to take advantage of this big change in Mie scatter due to microbeads, with one condition: the Mie scatter by microbeads should be powerful enough to overshadow the blue absorption by blood. The white LED flash of typical smartphones, including the iPhone 4, is sufficiently powerful, being much stronger than many LEDs and laser diodes used in our previous studies.17,21
We decided not to use green since the Mie scatter decreases upon immunoagglutination; singlets are higher than triplets. Decrease in scatter intensity can also occur when the microbeads precipitate out of the solution, due to the microbeads’ instability (occurs when the microbeads are stored too long, over 2–3 months) and/or the formation of giant immunoagglutinated clumps (typically with very high target concentrations). With green detection, the signal decrease can be interpreted as either true immunoagglutination or precipitation of microbeads. Furthermore, the absorbance of blood is maximum with green ( Fig. 4A ).
Detection Limit and Linear Range of Assay
Figure 5 shows the normalized blue and red intensities of the images through an optical fiber using the benchtop device, plotted against the target HRP-2 concentration. As expected from observing the Mie scatter simulatoins in Figure 4B , blue detection showed much bigger changes and largely a linear trend from 1 pg/mL to 10 ng/mL. All data points of blue detection were substantially different from the negative control, and the observed detection limit was 1 pg/mL (in 10% blood). This is a one order of magnitude improvement from 10 pg/mL (in the 1% fecal sample) in Heinze et al. 17 Considering that blood was diluted to 10%, the effective detection limit for the real sample should be 10 pg/mL. Furthermore, this sensitivity is about three orders of magnitude better than other studies (20 ng/mL in Golden et al. 5 ; 12.5 ng/mL in Stevens et al. 22 ). This improvement was made possible through careful optimization of optical parameters specifically for smartphone and blood, such as the use of a stronger light source (white LED flash) and the optimized use (concentration and exposure time) of the surfactant Tween-80.
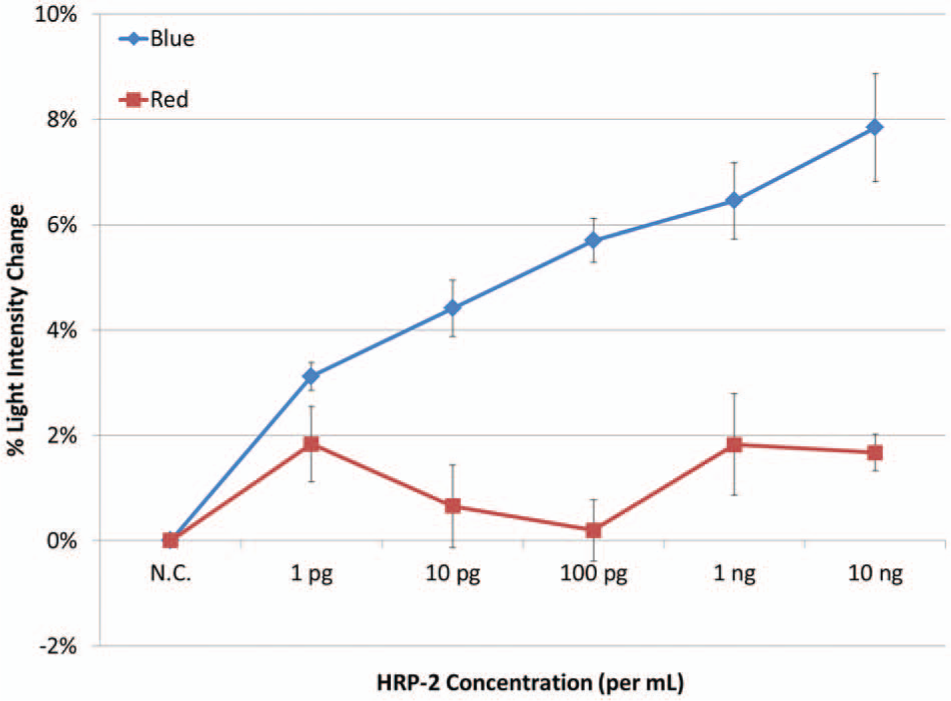
Normalized blue and red light scatter vs. histidine-rich protein 2 (HRP-2) concentration in 10% whole blood, using the benchtop device. Raw images were processed using Photoshop CS5 (Adobe, San Jose, CA), and the intensity of the blue or red values across a single image was averaged and compared with other images. Three trials were averaged to construct graph; error bars represent standard error.
In Heinze et al. 17 and Heinze and Yoon, 23 there were noticeable dips in the standard curves, while Figure 5 does not show any dip. This dip indicates the growth of microbeads beyond the triplets. 23 The nonexistence of a dip indicates that the microbeads did not immunoagglutinate beyond doublet or triplet form; only a fraction of immunoagglutinated particles increased against the target antigen concentration. This can be explained by the use of the Tween-80 surfactant, which effectively prevented the formation of large immunoagglutinated clumps. In addition, the human serum albumin (HSA) from blood is also believed to further stabilize the microbeads, since bovine serum albumin (BSA) is being frequently used to passivate the surfaces (microbeads and microwells) commonly used for immunoassays. The use of a microfluidic channel, which is a strictly laminar flow condition, also prevented the formation of large immunoagglutinated clumps.
A separate negative control was used in this study to normalize all the signals, which eliminated sample-to-sample and chip-to-chip variations. If patient-to-patient variation were to become a substantial factor, such as for patients with a low number of red blood cells (low hematocrit), internal normalization might become necessary. In that case, microbeads conjugated with passivating proteins (BSA) also can be used 21 ; these beads will not immunoagglutinate with HRP-2, effectively providing a negative control signal without the need for a separate negative control solution.
Assay Results with a Handheld Device
Figure 1C , D shows photographs of the handheld device’s SolidWorks design as well as the final result, respectively. Since the white LED flash and the digital camera were positioned very close to each other on the iPhone 4, it became necessary to use optical mirrors to deliver the white LED light to the other side of an optofluidic lab-on-a-chip, since optical fibers could not be bent to any larger extent. Figure 1B clearly shows that the white LED light was properly delivered to the incident light optofluidic channel. The delivered light was much brighter than what is shown in Figure 1B , since the light was collimated within the light conduit by the lenses, and a very small amount of light could be captured as seen perpendicular to the device.
To avoid interference from ambient light, the casing was designed such that it could slide on top of the “tray,” as shown in Figure 1C , D . In the benchtop setup, the ambient light was turned off to simulate a darkroom setup.
Figure 6 shows the assay results for two HRP-2 concentrations, 10 pg/mL and 10 ng/mL, both spiked with 10% blood. Again, the same negative control (no HRP-2 in 10% blood) was used to normalize the signals from positive samples. Only blue detection was used in accordance with the previous results. The results are largely identical to those of Figure 5 ; in fact, the % light intensity changes are nearly identical to the corresponding data points with a benchtop system, with smaller error bars.
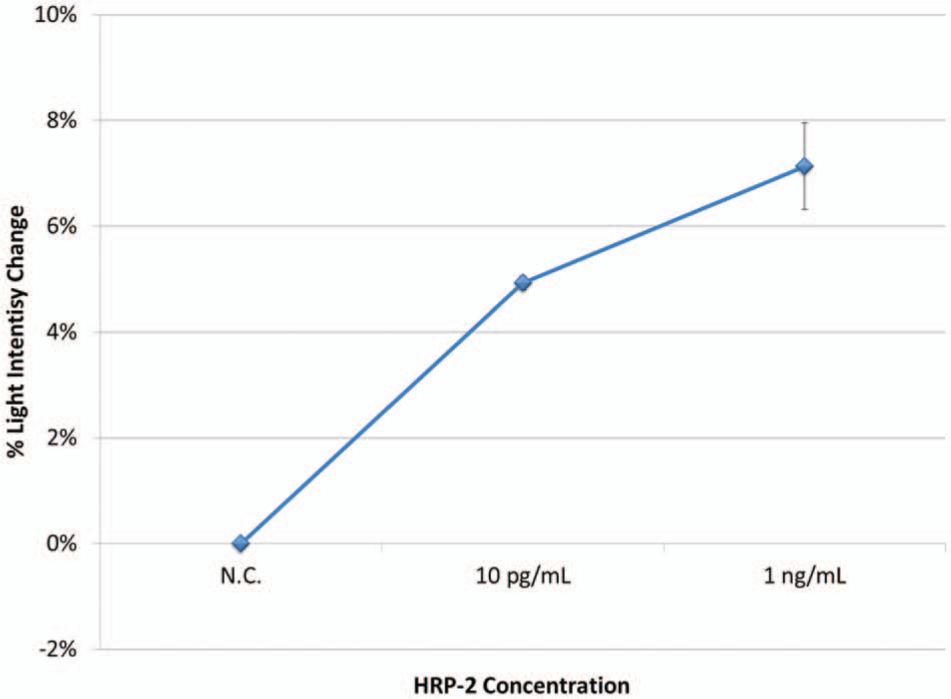
Normalized blue light scatter vs. histidine-rich protein 2 (HRP-2) concentration in 10% whole blood, using the handheld device. All other experimental conditions and image processing were identical to those of a benchtop device. Three trials were averaged to construct the graph; error bars represent standard error.
The smartphone-based detection (any smartphone comparable to the iPhone 4 can be used) required no external power, is portable, and has an assay time of approximately 10 min.
Footnotes
Acknowledgements
We thank Dr. David J. You at the University of Arizona (currently at Albany College of Medicine) for his help in conducting image analyses.
Declaration of Conflicting Interests
The authors declared no potential conflicts of interest with respect to the research, authorship, and/or publication of this article.
Funding
The authors received no financial support for the research, authorship, and/or publication of this article.