
Abstract
Automation in hemostasis testing is entering an exciting and unprecedented phase. This study was planned to assess the performance of the new preanalytical module on the hemostasis testing system Instrumentation Laboratory ACL TOP. The evaluation included interference studies to define reliable thresholds for rejecting samples with significant concentrations of interfering substances; within-run imprecision studies of plasma indices on four different interference degrees for each index; comparison studies with reference measures of hemolysis index, bilirubin, and triglycerides on clinical chemistry analyzers; and calculation of turnaround time with and without automatic performance of preanalytical check. The upper limits for sample rejection according to our interference studies were 3.6 g/L for hemoglobin, 13.6 mg/dL for bilirubin, and 1454 mg/dL for triglycerides. We found optimal precision for all indices (0.6% to 3.1% at clinically relevant thresholds) and highly significant correlations with reference measures on clinical chemistry analyzers (from 0.985 to 0.998). The limited increase of turnaround time (i.e., +3% and +5% with or without cap-piercing), coupled with no adjunctive costs over performance of normal coagulation assays, contribute to make the automatic check of plasma indices on ACL TOP a reliable and practical approach for improving testing quality and safeguarding patient safety.
Introduction
Preanalytical variability is an important aspect of total quality in laboratory testing.1,2 Among latent sources of diagnostic errors, the analysis of unsuitable specimens carries high risks of generating unreliable test results, which would finally exert a negative impact on analytical quality, as well as on patient safety. 3 Unsuitable specimens represent the leading source of nonconformities in clinical chemistry, immunochemistry, hematology, and hemostasis (including routine coagulation) testing.4-6 Several lines of evidence now attest that spurious hemolysis generates absorbance interference at the wavelengths that are typically used by optical instrumentation and is inherently associated with leakage of a variety of intracellular and plasma membrane proteins that trigger activation of both clotting factors and platelets. The interference caused by hyperbilirubinemia is mostly due to spectral overlap, whereas that caused by turbidity (typically due to hypertriglyceridemia) is attributable to light scatter, volume displacement effects, and direct interference of lipoproteins in primary and secondary hemostasis. 7 The outcome of all these events causes changes to hemostasis test results that may not truly reflect patient status, thus leading to inappropriate clinical management. The systematic assessment of sample quality is increasingly recognized as an important part of total quality of coagulation assays. This emerging awareness is catalyzing increasing efforts for development of technical aids aimed to increase quality and safeness of testing, also including automatic performance of serum/plasma indices as part of preanalytical checks of interfering substances. 8 Therefore, the aim of this study was to evaluate the technical performance of the new preanalytical module on ACL TOP, developed by Instrumentation Laboratory (IL).
Materials and Methods
Instrument Characteristics and Test Performance
Routine coagulation tests including prothrombin time (PT), activated partial thromboplastin time (APTT), and fibrinogen were assayed on a prototype ACL TOP 700 (Instrumentation Laboratory Company, Bedford, MA) equipped with the novel preanalytical module. Additional descriptions of this analyzer in standard layout and associated reagents is available elsewhere.9,10 In brief, ACL TOP family is a complete line of fully automated, random-access, multiparameter hemostasis testing systems equipped with a photo-optical clot-detection unit, each designed with the same standards of operation and functionality to meet the different needs of clinical laboratories, regardless of size or scope. The instruments provide testing process automation and continuous operation; access to samples, reagents, and cuvettes at any time; urgent samples introduced at any time and in any position; barcoded reagents for safe and fully automated materials management; fully automated rerun, reflex, and factor parallelism testing; and sophisticated results management including clot curves display and an autovalidation program. The recently developed plasma indices feature (i.e., “HIL check”) enables the analyzer to perform an assessment of levels of hemolysis (i.e., hemoglobin), icterus (i.e., total bilirubin), and lipemia (as reflected by a turbidity at 671 nm wavelength) in samples. The interfering substances have different optical spectra, as shown in Figure 1 . Basically, the HIL check is performed by means of an optical absorbance measurement of the diluted sample at three different wavelengths, as follows: 671 nm for turbidity; 535 nm for turbidity and cell-free hemoglobin; turbidity, 405 nm for cell-free hemoglobin and total bilirubin. Measurement at the three wavelengths creates three equations, which can then be solved mathematically to determine the levels of the three different interfering substances. The final results of plasma indices are generated in g/L for hemoglobin, mg/dL for bilirubin, and mAbs (i.e., milliabsorbances) for turbidity, as shown in Figure 2 . The routine clotting assays, including PT, APTT, and fibrinogen, were performed using RecombiPlasTin, SynthASil, and FibrinogenC-XL, respectively. The interassay imprecision on ACL TOP 700 has been reported to be comprised between 0.9% and 1.0% for RecombiPlasTin, 1.6% and 2.0% for SynthASil, and 3.5% to 7.7% for FibrinogenC-XL. 10
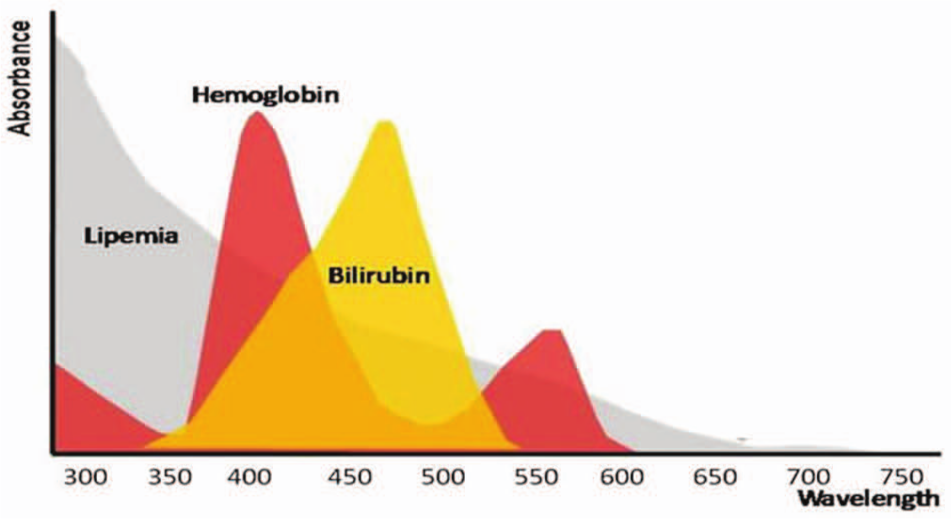
Schematic optical spectra of interfering substances in laboratory testing.
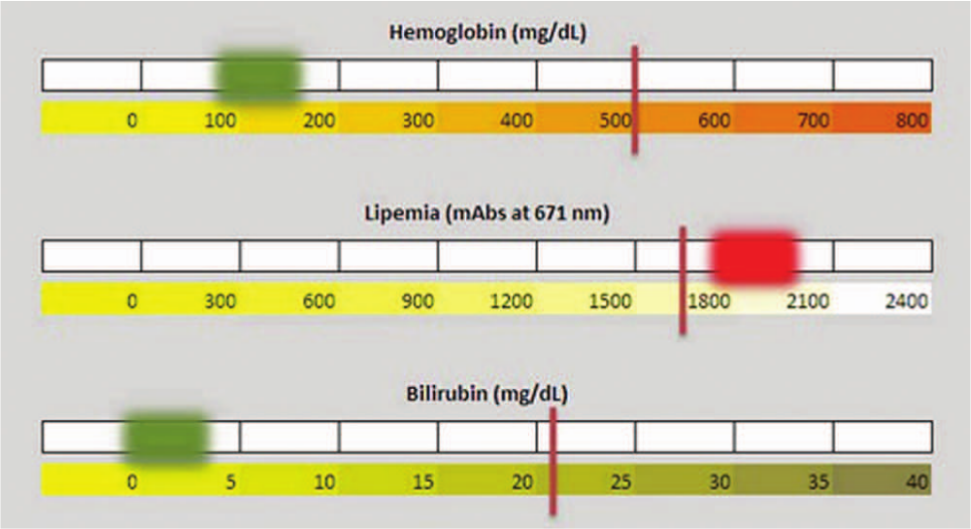
Final reporting of plasma indices on Instrumentation Laboratory ACL TOP equipped with the novel preanalytical module. The vertical lines indicate the thresholds of sample acceptability, whereas the green or red squares indicate the value of each interfering substance in the diagnostic sample.
Interference Studies
Evaluation of Cell-Free Hemoglobin Interference (Spurious Hemolysis)
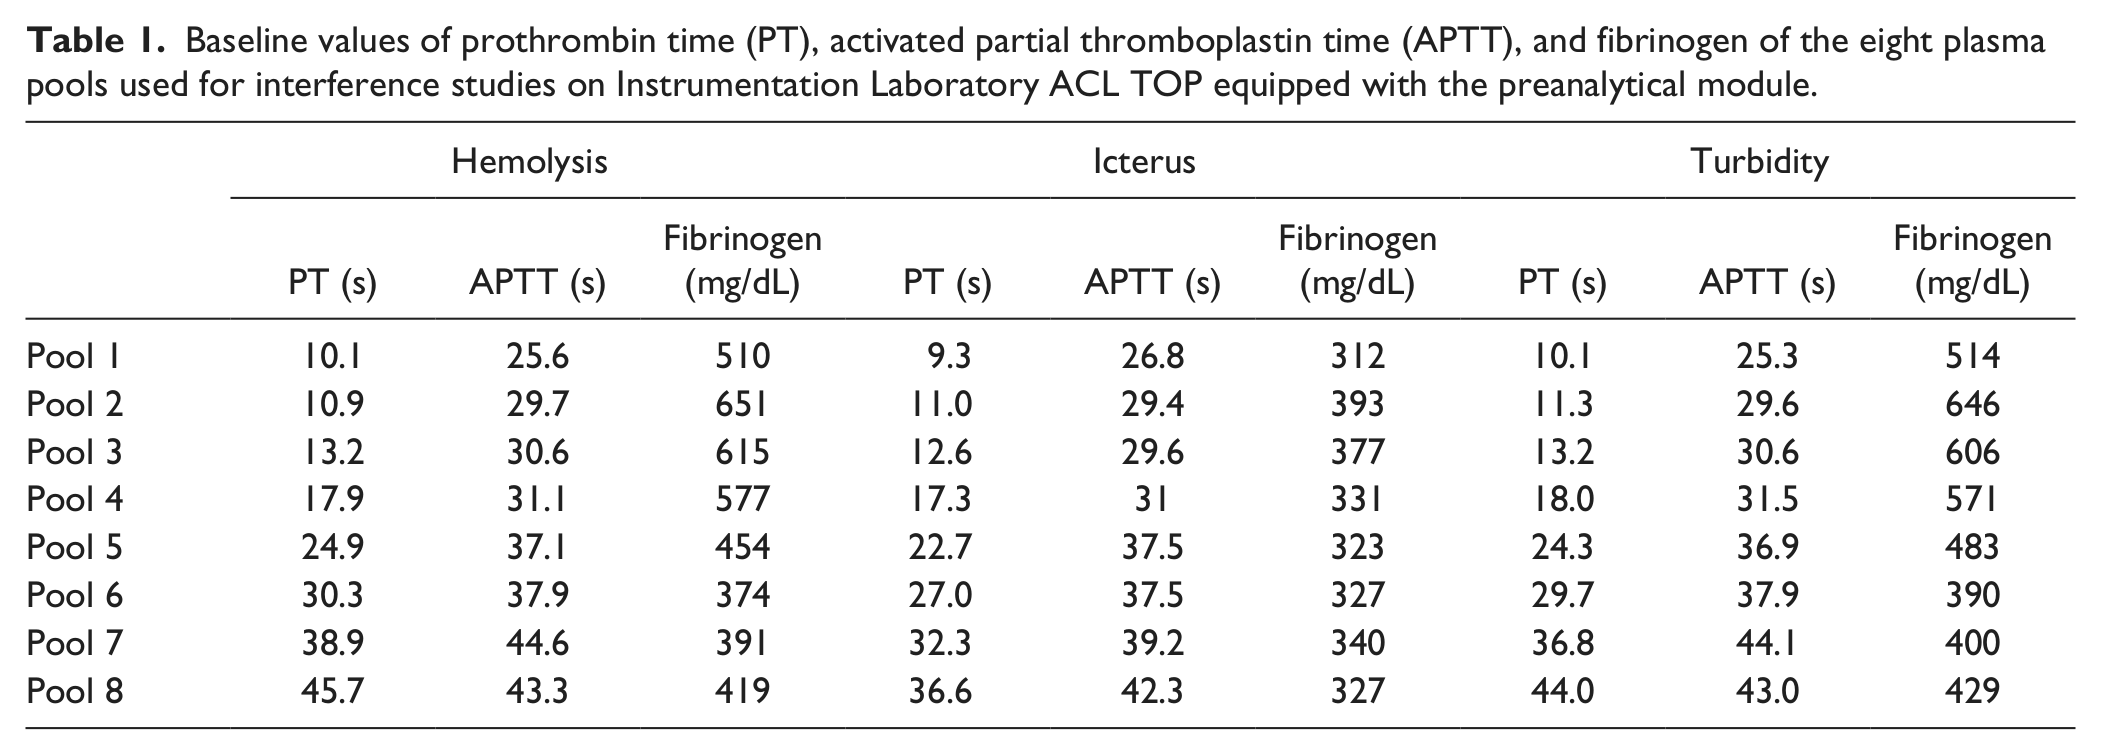
Eight different pools of 10 samples each were prepared from inpatient samples collected in 2.7 mL BD Vacutainer plastic whole-blood tubes containing 0.109 mol/L buffered sodium citrate (Becton Dickinson Italia, Milan, Italy, ref. no. 363048), specifically selected from those referred in the morning to the laboratory for routine testing, to obtain a broad range of PT, APTT, and fibrinogen values ( Table 1 ). According to our experimental protocol, the postanalysis centrifuged samples were gently resuspended by six times inversion of primary blood tubes and pooled into a 50 mL plastic vial. All samples were pooled less than 2 h after routine testing had been completed.
Baseline values of prothrombin time (PT), activated partial thromboplastin time (APTT), and fibrinogen of the eight plasma pools used for interference studies on Instrumentation Laboratory ACL TOP equipped with the preanalytical module.
Four aliquots of 2 mL (H0, H1, H2, and H3) were obtained from each of the eight pooled plasmas. The first aliquot (H0) was immediately centrifuged and tested in duplicate for PT, APTT, and fibrinogen as well as for hemolysis index on ACL TOP. The second (H1), third (H2), and fourth (H3) aliquots were mechanically hemolyzed according to a standard protocol,11,12 which entails aspiration of anticoagulated blood 1, 2, and 3 times through a fine needle (30 gauge, 0.3 × 8 mm) connected with an insulin syringe (Picindolor, Artsana S.p.A., Grandate, Italy) to achieve an increasing degree of spurious hemolysis ( Table 2 ). This method is considered much more appropriate than spiking samples with exogenous hemoglobin, because it more closely reproduces the generalized injury to red blood cells (RBCs), white blood cells (WBCs), and platelets that occurs during problematic blood collection and handling. 12 The samples were then separated by centrifugation and tested in duplicate for PT, APTT, and fibrinogen as well as for hemolysis index on ACL TOP.
Results of the cell-free hemoglobin (H) interference study on Instrumentation Laboratory ACL TOP equipped with the preanalytical module. a
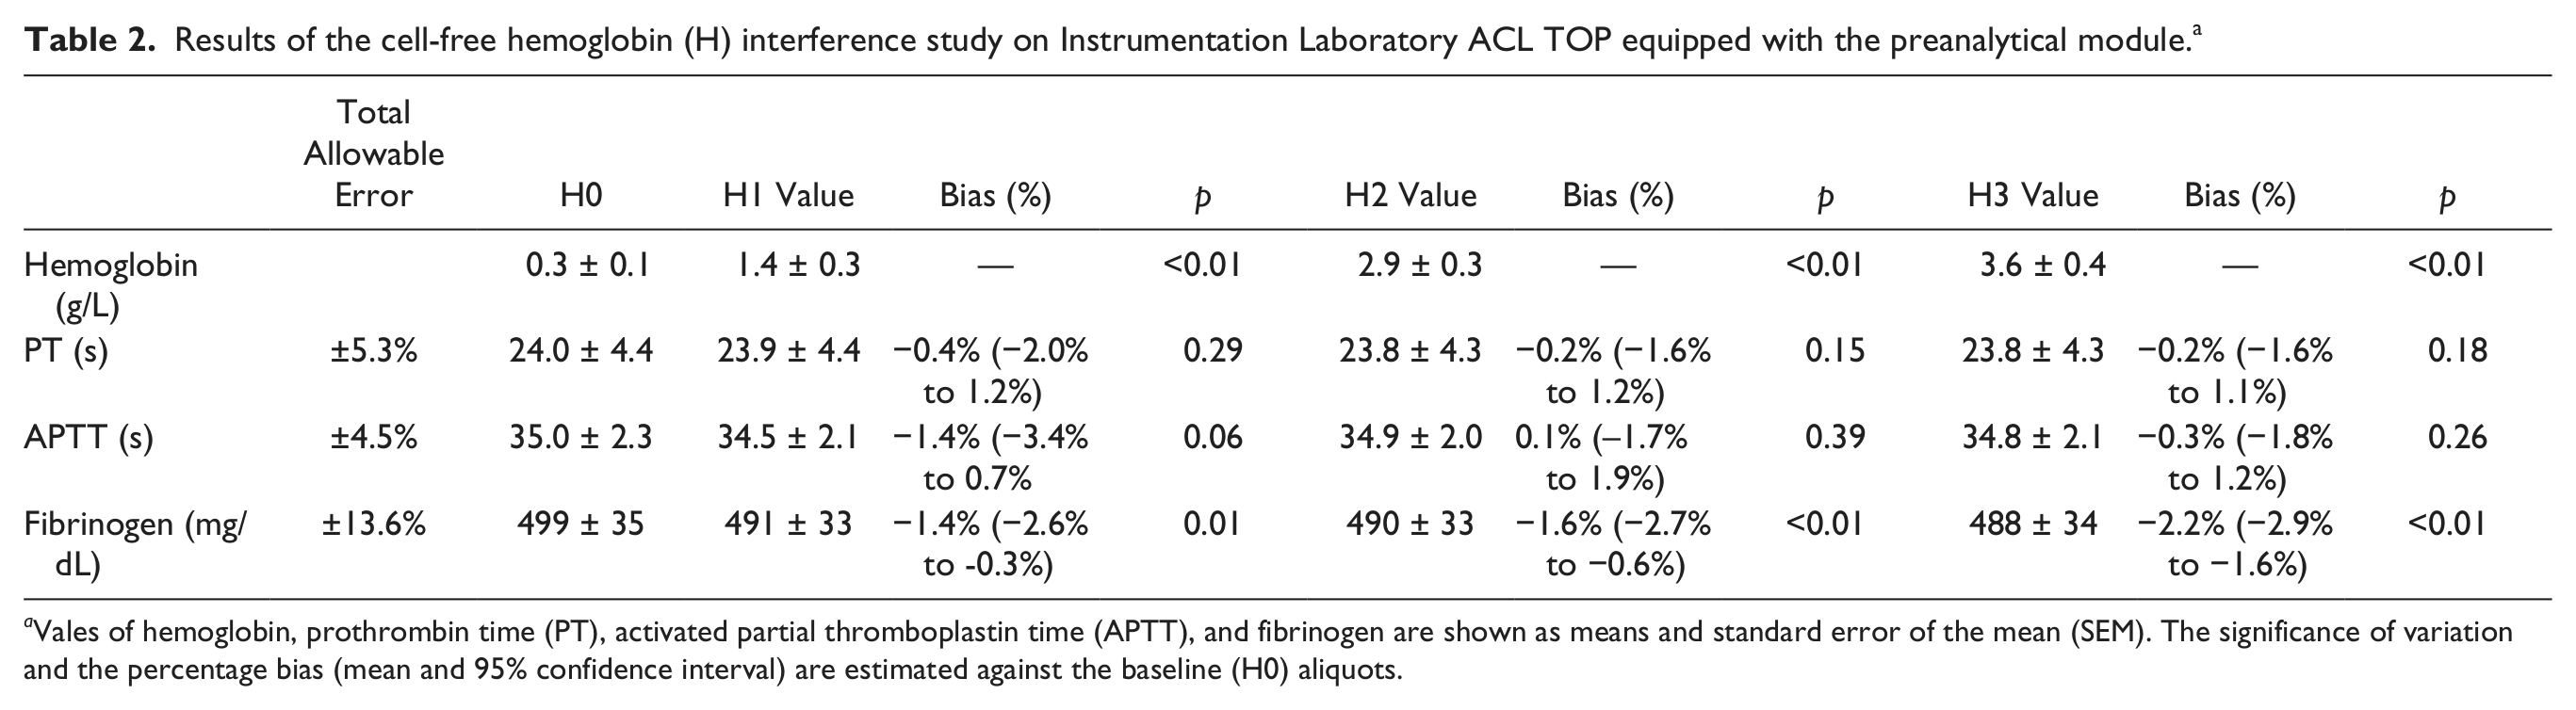
Vales of hemoglobin, prothrombin time (PT), activated partial thromboplastin time (APTT), and fibrinogen are shown as means and standard error of the mean (SEM). The significance of variation and the percentage bias (mean and 95% confidence interval) are estimated against the baseline (H0) aliquots.
Evaluation of Bilirubin Interference (Icterus)
Eight different pools of 10 samples each were prepared as described for the hemolysis interference study. Four aliquots of 2 mL (I0, I1, I2, and I3) were obtained from each of the eight pooled plasmas. The first aliquot (I0) was immediately centrifuged and tested in duplicate for PT, APTT, and fibrinogen as well as for the icteric index on ACL TOP. The second (I1), third (I2), and fourth (I3) aliquots were spiked with an exogenous bilirubin standard solution resuspended to a final concentration of 1500 mg/dL (Bilirubin, product No. B 4126; Sigma-Aldrich, St. Louis, MO). Specifically, aliquots I1, I2, and I3 were spiked with 2, 20, and 60 µL of the stock bilirubin solution, to achieve an increasing concentration of bilirubin ( Table 3 ). The samples were then separated by centrifugation and tested in duplicate for PT, APTT, and fibrinogen as well as for the icteric index on ACL TOP.
Results of the icterus (I) interference study on Instrumentation Laboratory ACL TOP equipped with the preanalytical module. a
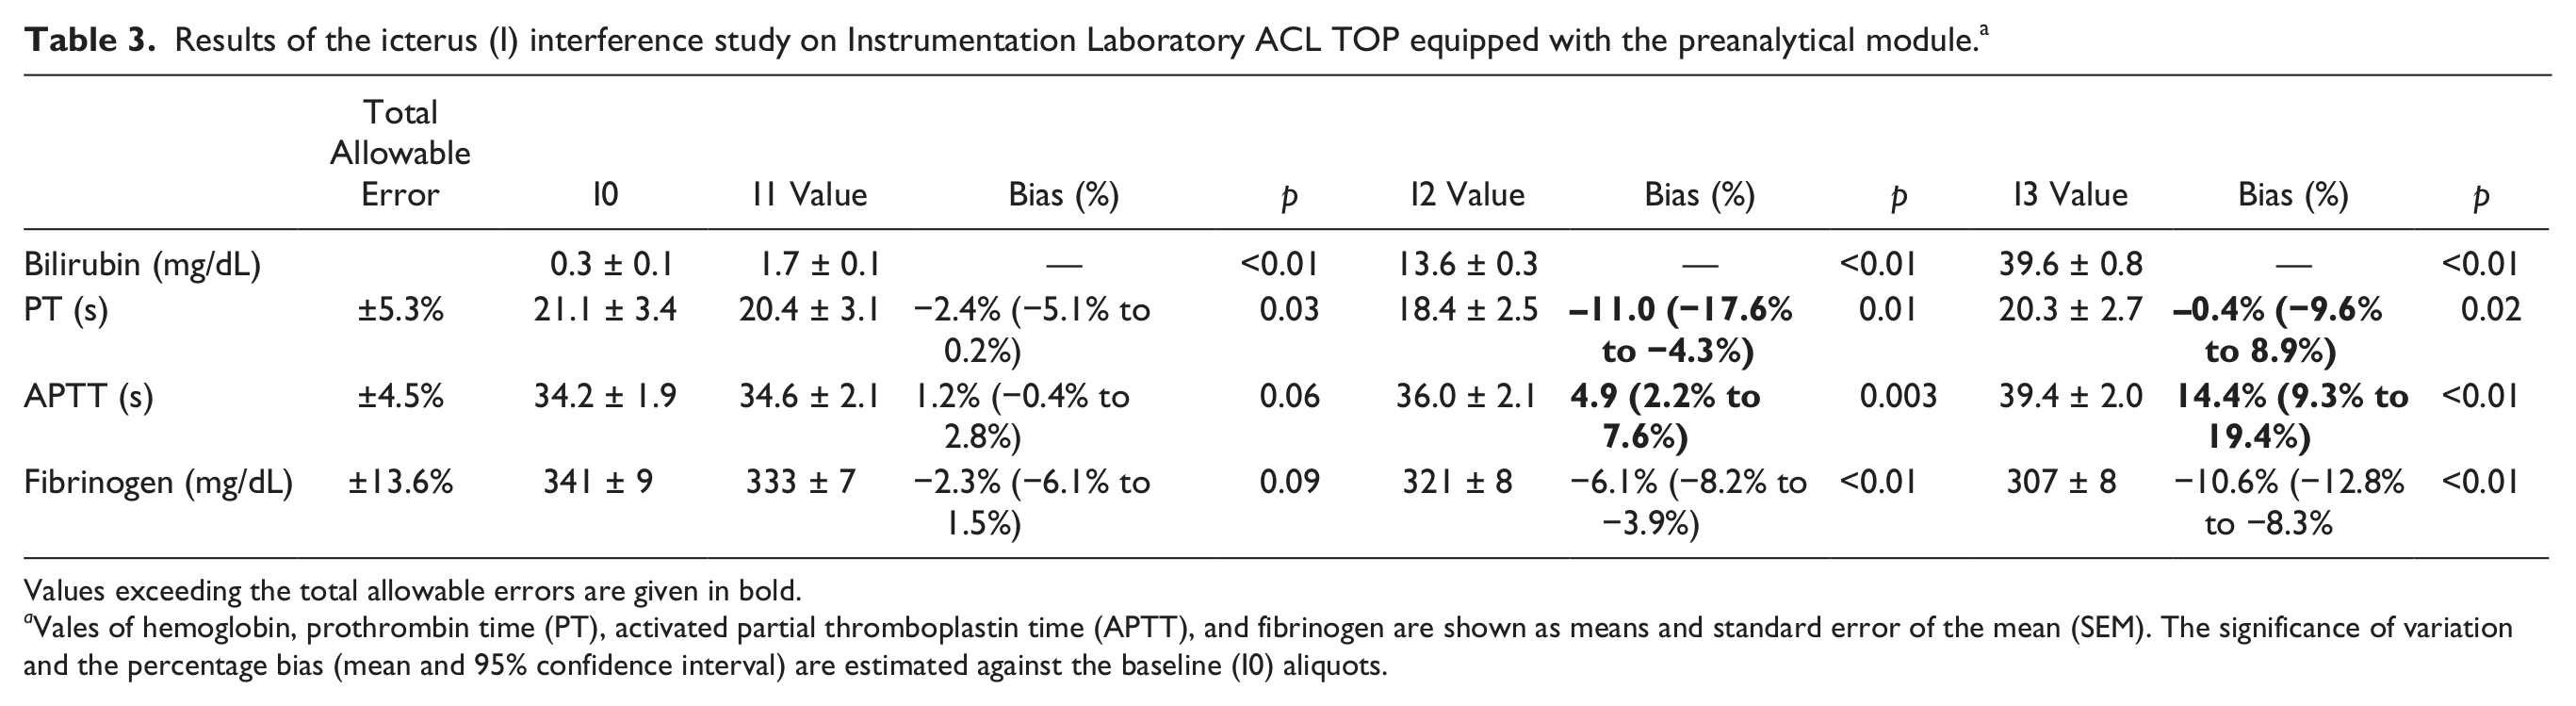
Values exceeding the total allowable errors are given in bold.
Vales of hemoglobin, prothrombin time (PT), activated partial thromboplastin time (APTT), and fibrinogen are shown as means and standard error of the mean (SEM). The significance of variation and the percentage bias (mean and 95% confidence interval) are estimated against the baseline (I0) aliquots.
Evaluation of Turbidity Interference (Lipemia)
Eight different pools of 10 samples each were prepared as described for the hemolysis interference study. Five aliquots of 1.5 mL (L0, L1, L2, L3, and I4) were obtained from each of the eight pooled plasmas. The first aliquot (L0) was immediately centrifuged and tested in duplicate for PT, APTT, and fibrinogen as well as for lipemic index on ACL TOP. The second (L1), third (L2), fourth (L3), and fifth (L4) aliquots were spiked with a solution of exogenous triglycerides (Lipofundin S 20%; B. Braun SpA, Milano, Italy). Specifically, aliquots L1, L2, L3, and L4 were spiked with 2.2, 5, 10, and 30 µL of the stock lipid solution to achieve an increasing concentration of triglycerides ( Table 4 ). The samples were then separated by centrifugation and tested in duplicate for PT, APTT, and fibrinogen as well as for the lipaemic index on ACL TOP.
Results of turbidity (L) interference study on Instrumentation Laboratory ACL TOP equipped with the preanalytical module. a
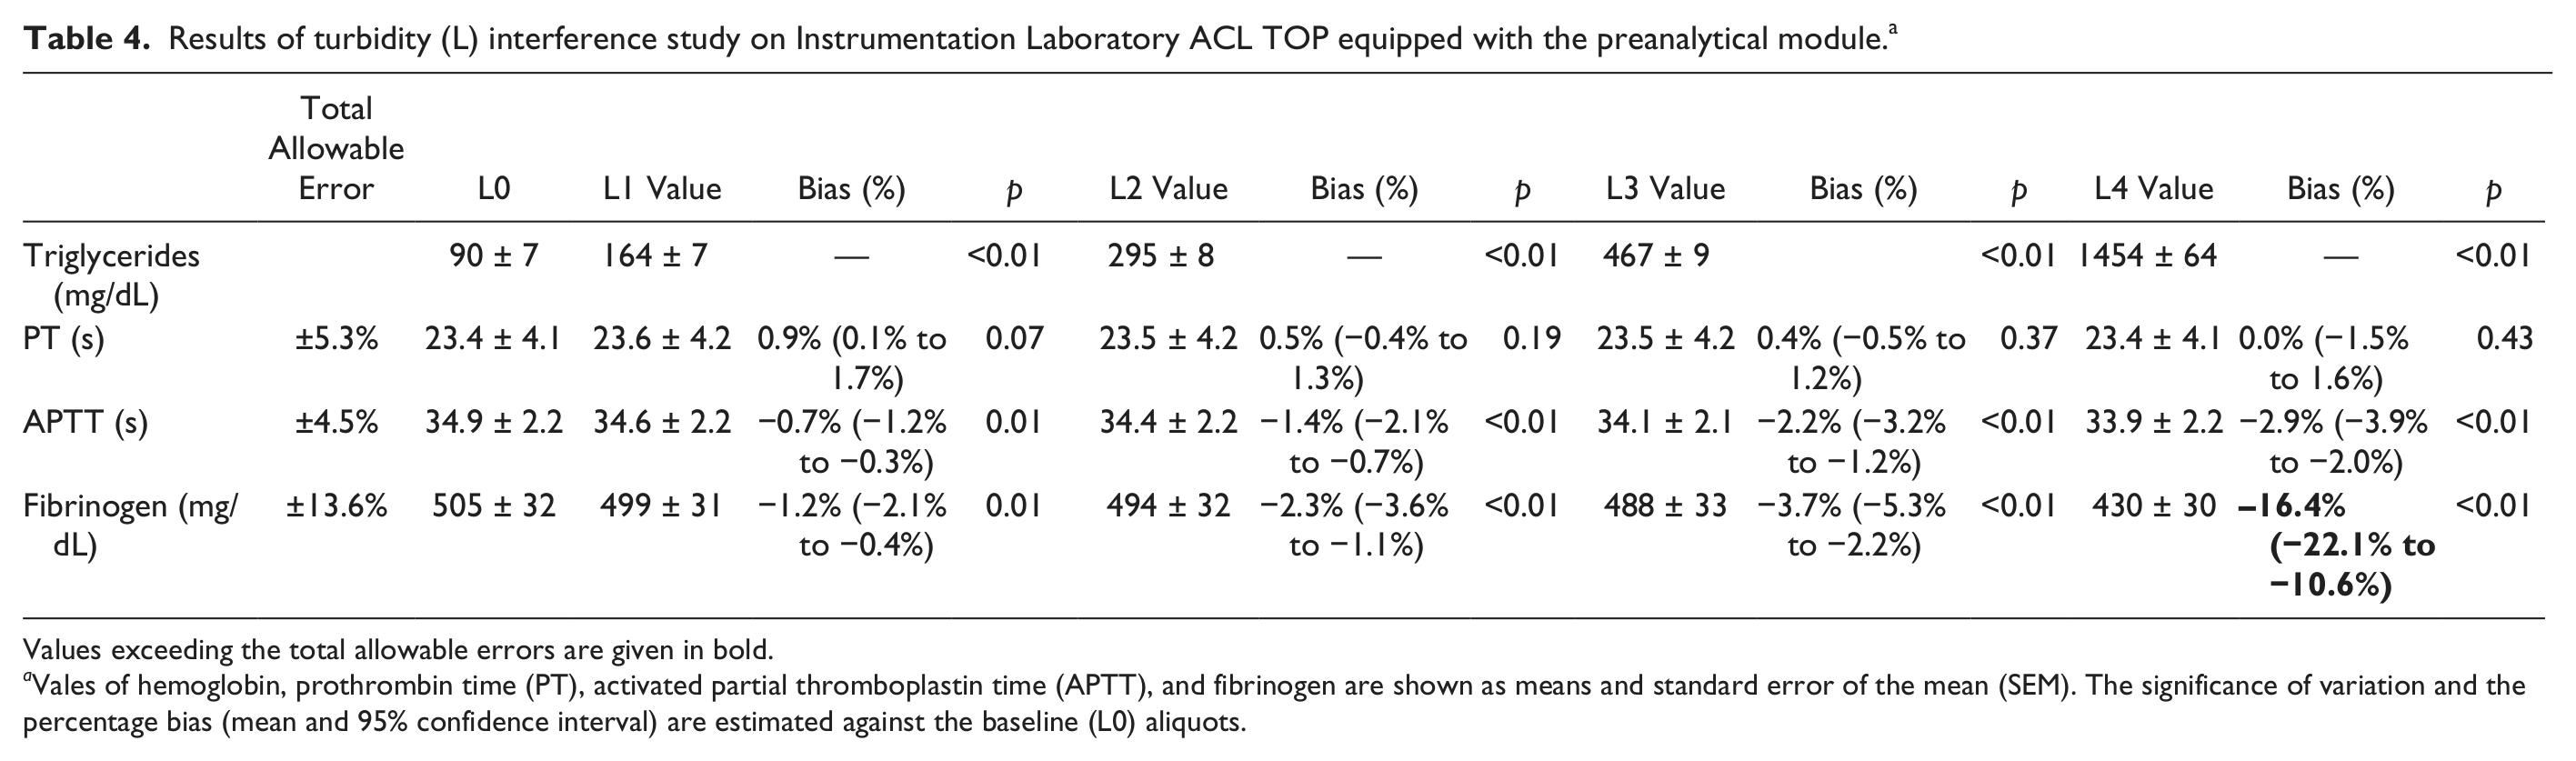
Values exceeding the total allowable errors are given in bold.
Vales of hemoglobin, prothrombin time (PT), activated partial thromboplastin time (APTT), and fibrinogen are shown as means and standard error of the mean (SEM). The significance of variation and the percentage bias (mean and 95% confidence interval) are estimated against the baseline (L0) aliquots.
Evaluation of within-Run Imprecision
Imprecision of Hemolysis Index
A pool of six samples was prepared from inpatient samples essentially as per the previously described “spurious hemolysis” protocol. Four aliquots of 2 mL (H0, H1, H2, and H3) were obtained from the pooled plasma. The first aliquot (H0) was immediately centrifuged and tested. The second (H1), third (H2), and fourth (H3) aliquots were mechanically hemolyzed according to the earlier described protocol. The hemolysis index was then measured in 10 consecutive runs on each aliquot, on ACL TOP.
Imprecision of the Icteric Index
A pool of six samples was prepared as described for the hemolysis interference study. Four aliquots of 2 mL (I0, I1, I2, and I3) were obtained from the pooled plasma. The first aliquot (I0) was immediately centrifuged and tested. The second (I1), third (I2), and fourth (I3) aliquots spiked with exogenous bilirubin according to the protocol earlier described for the evaluation of interference from icterus. The icteric index was then measured in 10 consecutive runs on each aliquot, on ACL TOP.
Imprecision of Lipaemic Index
A pool of six samples was prepared as described for the hemolysis interference study. Four aliquots of 2 mL (L0, L1, L2, and L3) were obtained from the pooled plasma. The first aliquot (L0) was immediately centrifuged and tested. The second (L1), third (L2), and fourth (L3) aliquots were spiked with exogenous triglycerides according to the protocol earlier described for the evaluation of interference from lipemia. The lipaemic index was then measured in 10 consecutive runs on each aliquot, on ACL TOP.
Comparison Studies
The aliquots obtained for evaluation of hemolysis (n = 32), icterus (n = 32), and lipemia (n = 40) interference were also tested for hemolysis index on Beckman Coulter Unicel DxC (Beckman Coulter Inc., Brea, CA), as well as for total bilirubin (azobilirubin photometric color test) and triglycerides (enzymatic colorimetric without glycerol correction assay) on the Beckman Coulter AU5822 (Beckman Coulter Inc.). The analytical performance of these analyzers is reported elsewhere.13-15
Evaluation of Turnaround Time
Twenty samples randomly selected from those referred for routine testing were consecutively process for PT, APTT, and fibrinogen on ACL TOP. The turnaround time was calculated from insertion of the first sample rack within the instrument and generation of the latest test result. Immediately afterward, the same procedure was followed using the same samples, but with the addiction of plasma indices (i.e., HIL), check for each sample. The turnaround time was again calculated from insertion of the first sample rack within the instrument and generation of the latest test result. The experiment was replicated either with or without cap piercing (i.e., on primary blood tubes with or without the cap stopper). The difference of turnaround time with and without the plasma indices check was finally calculated as a percentage.
Statistics
The results of PT, APTT, fibrinogen, and plasma indices obtained on aliquots with increasing concentration of cell-free hemoglobin (H1, H2, and H3), total bilirubin (I1, I2, and I3), and triglycerides (L1, L2, L3, and L4) were compared with those obtained on the baseline aliquots (H0, I0, and L0, respectively) by Student paired t test, Bland and Altman plot analysis, and through direct comparison with the desirable specifications for total allowable error calculated from data on within-subject and between-subject biologic variation. 16 The within-run imprecision was expressed as coefficient of variation (CV, %). For comparison studies, the results of hemolysis, icteric, and lipemic indices were compared with those of hemolysis index, total bilirubin, and triglycerides obtained on Beckman Coulter Unicel DxC and AU5822 by linear regression analysis and Pearson and Spearman correlations. The statistical analysis was performed with Analyse-it for Microsoft Excel (Analyse-it Software Ltd, Leeds, UK). The study was performed in accordance with the Declaration of Helsinki and under the terms of all relevant local legislations.
Results
Interference Studies
Evaluation of Cell-Free Hemoglobin Interference (Spurious Hemolysis)
The concentration of cell-free hemoglobin increased from a baseline value of 0.3 ± 0.1 g/L in aliquots H0 to a maximum of 3.6 ± 0.4 g/L in aliquots H3 ( Table 2 ), thus covering the range of hemolysis that characterizes the vast majority (i.e., ~99%) of samples received in clinical laboratories. 17 A statistically significant difference could be observed only for fibrinogen, after aliquots H1 (i.e., concentration of cell-free hemoglobin greater than 1.4 ± 0.3 g/L). In no case, however, did the bias and its 95% confidence interval (95% CI) exceed the total allowable error in aliquots containing up to 3.6 ± 0.4 g/L of cell-free hemoglobin ( Table 2 ).
Evaluation of Bilirubin Interference (Icterus)
The concentration of bilirubin increased from a baseline value of 0.3 ± 0.1 mg/dL in aliquots I0 to a maximum of 39.6 ± 0.8 mg/dL in aliquots I3 ( Table 3 ), thus covering the range of hyperbilirubinemia that characterizes the vast majority of samples received in clinical laboratories. 18 A statistically significant difference could be observed for PT, APTT, and fibrinogen after aliquots I2 (i.e., concentration of bilirubin greater than 13.6 ± 0.3 mg/dL). An overall bias (i.e., including the 95% CI) exceeding the total allowable error was observed for PT and APTT starting from aliquots I2 ( Table 3 ).
Evaluation of Turbidity Interference (Lipemia)
The concentration of triglycerides increased from a baseline value of 90 ± 7 mg/dL in aliquots L0 to a maximum of 1454 ± 64 mg/dL in aliquots L4 ( Table 4 ), thus covering the range of hypertriglyceridemia that characterizes the vast majority of samples received in clinical laboratories. 18 A statistically significant difference could be observed for APTT and fibrinogen after aliquots L1 (i.e., concentration of triglycerides greater than 164 ± 7 mg/dL). Nevertheless, a bias exceeding the total allowable error was observed for only fibrinogen in aliquots L4 (i.e., concentration of triglycerides greater than 1454 ± 64 mg/dL; Table 4 ).
Evaluation of within-Run Imprecision
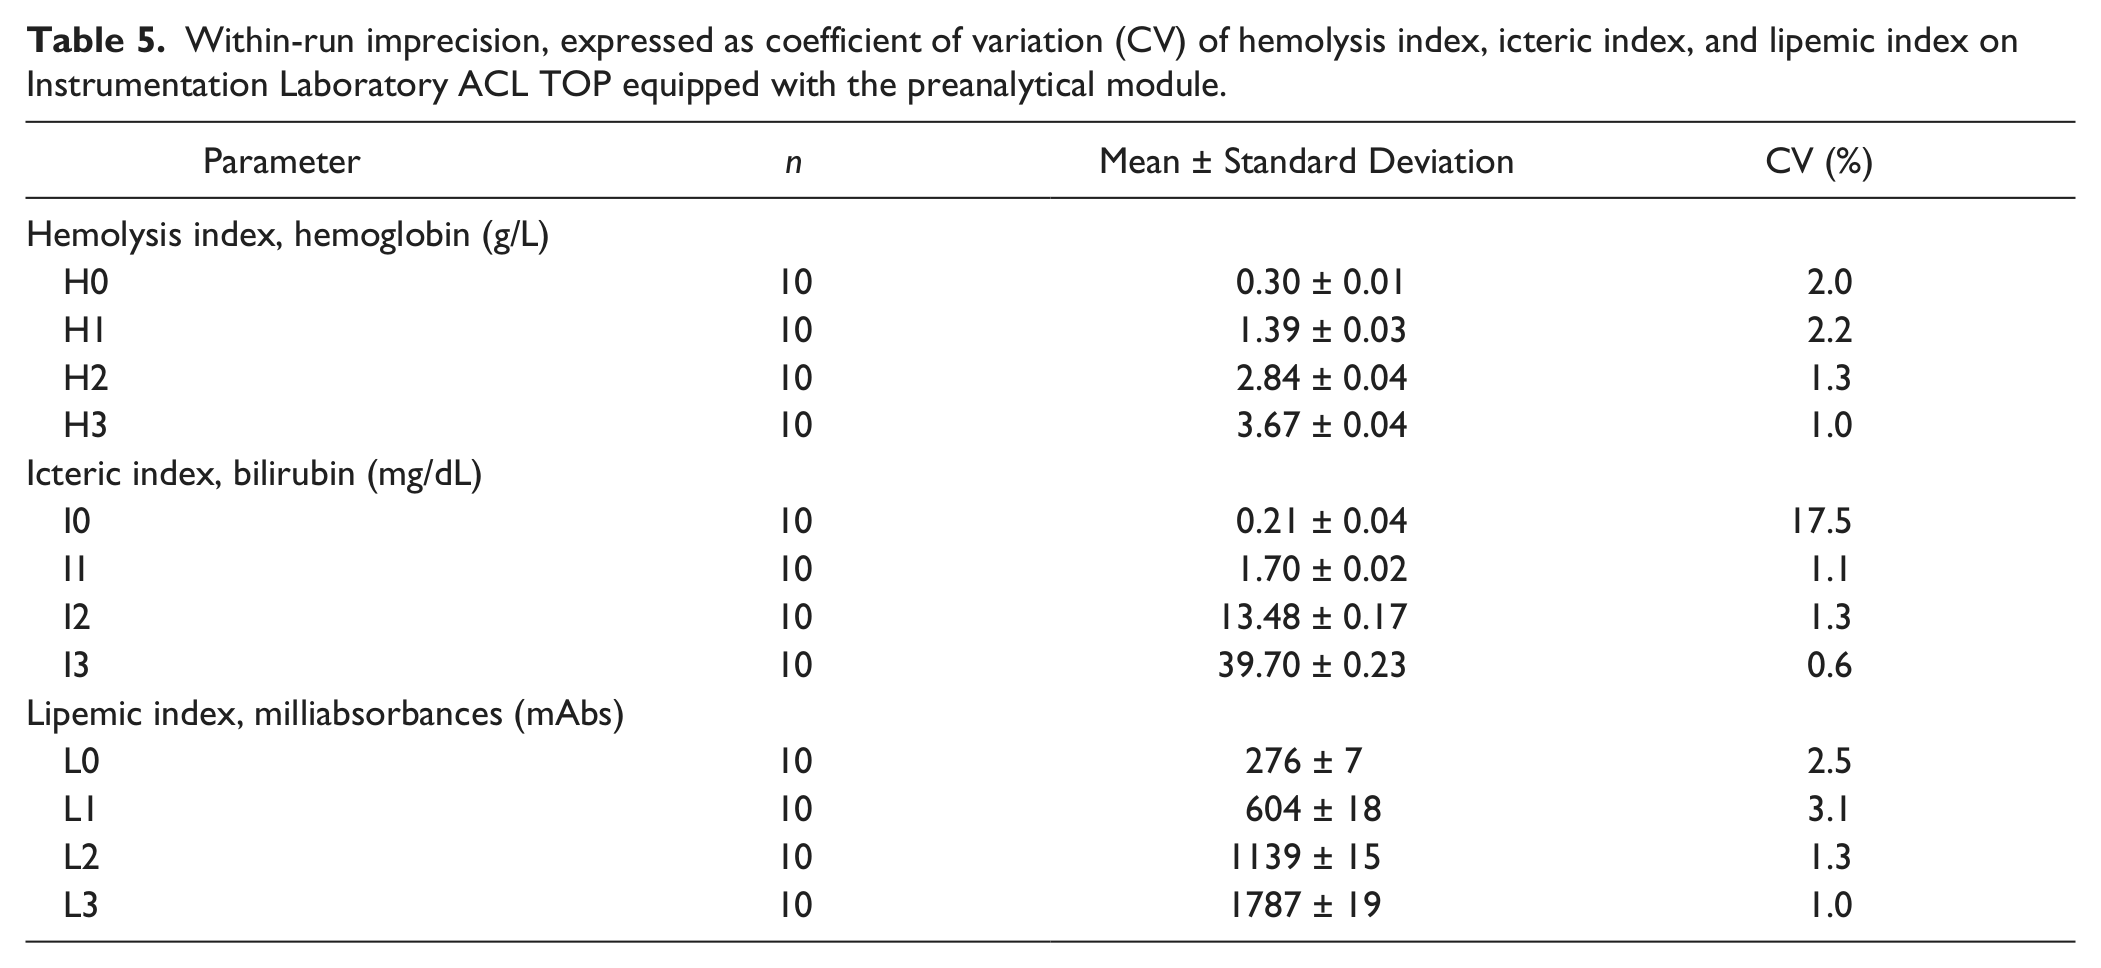
The within-run imprecision calculated on 10 replicates of samples with an increasing amount of cell-free hemoglobin, total bilirubin, and triglycerides is reported in Table 5 . For all the plasma indices, the imprecision at clinically relevant thresholds was excellent, being comprised between 1.0% and 2.2% for hemolysis index, 0.6% and 17.5% for icteric index, and 1.0% and 3.1% for lipemic index, respectively. It is noteworthy that a large imprecision of the icteric index (i.e., 17.5%) was recorded in the sample with a very low concentration of bilirubin (0.2 mg/dL), which does not raise any problems in terms of interference.
Within-run imprecision, expressed as coefficient of variation (CV) of hemolysis index, icteric index, and lipemic index on Instrumentation Laboratory ACL TOP equipped with the preanalytical module.
Comparison Studies
Highly significant correlations were found between the plasma indices on ACL TOP and the corresponding measures on the Beckman Coulter Unicel DxC and AU5822. The linear regression analysis and Pearson and Spearman correlation coefficients were ACL TOP = [0.94 × Unicel DXC − 0.1], r = 0.989 and 0.992 (both p < 0.001) for cell-free hemoglobin; ACL TOP = [4.1 × AU5822 − 42.9], r = 0.986 and 0.985 (both p < 0.001) for total bilirubin; and ACL TOP = [0.83 × AU5822 − 0.4], r = 0.998 and 0.986 (both p < 0.001) for triglycerides.
Evaluation of Turnaround Time
The turnaround time (i.e., the time measured from loading of the first sample rack to generation of the latest test result) on 20 samples tested for PT, APTT, and fibrinogen was 38 min with the preanalytical module turned off and 39 min with automatic performance of plasma indices in cap-piercing mode (i.e., primary blood tubes with cap stopper). The corresponding times without cap piercing (i.e., primary blood tubes without cap stopper) were 43 min with the preanalytical module turned off and 45 min with automatic check of plasma indices. The estimated increase in the turnaround time with systematic HIL interference assessment was thereby +3% and +5% with and without cap piercing, respectively.
Discussion
A variety of technological innovations have substantially revolutionized the layout and functioning of modern coagulation analyzers, increasing test panels, increasing sample and test throughput, improving quality of testing, and contextually enhancing operator safety.19-21 The major quality tools include failure pattern sensors for identifying insufficient volume, clots, or bubbles; cap piercing for enhancing operator safety and sample quality; automatic reanalysis and redilution of samples for reducing analytical errors; laser barcode readers for preventing misidentification. 22 The increasing awareness that checking sample quality represents an unavoidable condition for providing clinically usable test results has paved the way for the development of novel analyzers equipped with tools for automatic check of the so-called plasma indices, which are typically based on multiwavelength scanning for identifying interfering substances such as cell-free hemoglobin, hyperbilirubinemia, and turbidity. These plasma indices are already provided by hemostasis instrumentation of the Sysmex CS series23,24 and will soon become available also on the family of Instrumentation Laboratory ACL TOP, thus introducing an additional breakthrough in laboratory technology and automation. The present study was therefore planned to evaluate the technical performance of the preanalytical module on a prototype ACL TOP, to establish whether the automatic use of plasma indices is reliable, practical in the context of daily routine testing, and clinically useful for identifying potential sources of clinically significant bias in test results.
The systematic assessment of interference is performed on ACL TOP by means of a simple optical absorbance measurement of diluted sample at three different wavelengths (i.e., 405, 535, and 671 nm) and further mathematical transformation of spectrophotometric readings into levels of interfering substances. As such, this process does not require specific technical operations, direct intervention of technicians, or additional cost for specific reagents, and it does not substantially affect instrumental throughout. The findings of our technical evaluation attest that assessment of plasma indices on ACL TOP provides an appropriate means for checking sample quality in routine coagulation testing, as confirmed by the optimal within-run imprecision (i.e., CVs always lower than 3.1%) at the clinically relevant thresholds of interference and the highly significant correlation (i.e., always greater than 0.985) with the reference measures on clinical chemistry analyzers. The interference studies also enable us to set reliable thresholds for sample rejection, corresponding to 3.6 g/L of cell-free hemoglobin, 13.6 mg/dL of total bilirubin, and 1454 mg/dL of triglycerides (which corresponds to 5950 mAbs on ACL TOP). This is consistent with the manufacturer’s package insert claims, stating that no serious interference is observed at up to 3.75 g/L of cell-free hemoglobin. The limited impact on turnaround time (i.e., +3% and +5% with or without cap piercing) coupled with no adjunctive costs over performance of normal coagulation assays contribute to make the automatic check of plasma indices on ACL TOP a reliable and practical approach for increasing testing quality and safeguarding patient safety.
In conclusion, automation in hemostasis testing is entering an exciting phase. With the inherent limitations of a single-center evaluation, the current study provides independent validation of manufacturer claims relevant to important preanalytical components of sample testing, with these being essential to sample integrity. These findings thus provide needed reassurance about the quality of hemostasis test results and subsequently impart additional clinical assurance.
Footnotes
Acknowledgements
The authors are thankful to Dr. Roberta Romano for the technical help for performing the study.
Declaration of Conflicting Interests
The authors declared no potential conflicts of interest with respect to the research, authorship, and/or publication of this article.
Funding
The authors received no financial support for the research, authorship, and/or publication of this article.