
Abstract
Molecular diagnostics using microarrays are increasingly being used in clinical diagnosis because of their high throughput, sensitivity, and accuracy. However, standard microarray processing takes several hours and involves manual steps during hybridization, slide clean up, and imaging. Here we describe the development of an integrated platform that automates these individual steps as well as significantly shortens the processing time and improves reproducibility. The platform integrates such key elements as a microfluidic chip, flow control system, temperature control system, imaging system, and automated analysis of clinical results. Bead labeling of microarray signals required a simple imaging system and allowed continuous monitoring of the microarray processing. To demonstrate utility, the automated platform was used to genotype hereditary hearing-loss gene mutations. Compared with conventional microarray processing procedures, the platform increases the efficiency and reproducibility of hybridization, speeding microarray processing through to result analysis. The platform also continuously monitors the microarray signals, which can be used to facilitate optimization of microarray processing conditions. In addition, the modular design of the platform lends itself to development of simultaneous processing of multiple microfluidic chips. We believe the novel features of the platform will benefit its use in clinical settings in which fast, low-complexity molecular genetic testing is required.
Introduction
Molecular diagnostics and human genetic research are some of the most important emerging fields in modern medicine.1–4 A variety of molecular technologies are commonly used for these studies for different purposes, including microarray technology, 5 real-time PCR technologies,6–8 high-resolution amplicon melting analysis,9,10 and, more recently, high-throughput sequencing.11,12 Compared with the latter technologies, microarray technology is cost-effective for a number of diagnostic uses, such as gene copy number variation analysis,13,14 multigene mutation analysis,15,16 and gene expression analysis.17–19
Generally, microarray processing includes sample preparation, array spotting, labeling, hybridization of labeled sample targets and probes on the microarray, washing to remove nonspecific bound targets, imaging of bound targets, and analysis of results. A variety of commercial instruments are available to undertake each individual process step, microarray hybridizers provide the appropriate environment for molecular binding, clean-up stations provide for slide washing and drying, and microarray scanners and computers are used for imaging/analysis.20,21 However, each of these instruments still involves some operator intervention, requiring staff attendance and the potential for operator error.
Typically, complex and expensive fluorescence scanners are used for microarray analysis, allowing multiple targets to be labeled with different fluorophores (with distinct spectra) or to be analyzed quantitatively and accurately.22–24 Yet for many clinical applications, single-label qualitative molecular analysis is sufficient to provide full clinic analysis for diagnostic purposes. Here we describe the use of contrast materials, such as magnetic beads or polystyrene beads, as labels in place of expensive fluorescent probes. Positive signals can be detected as long as the targets selectively bind with the probes, and because contrast labels enhance the microarray spot signals, these are especially applicable to qualitative analysis. Furthermore, the imaging system required for microbead-assisted microarray labeling can be greatly simplified,25,26 and continuous monitoring can also be conveniently achieved.
This article describes an automated platform for the rapid processing of bead label–based microarray assays, integrating hybridization, washing, imaging, and result analysis processes. After manually injecting the bead-labeled samples onto the microarray, the operator can monitor the spot signals on the microarray in real time and obtain analysis reports after a few minutes, without any need to intervene. The platform was validated by comparison to a conventional microarray-based hearing-loss gene mutation detection assay26,27 and displayed both high accuracy and reduced processing time compared with the conventional assay.
Conditions including each process step period, temperature, flow velocity, and the design of probes and primers must be optimized for each microarray test application. Standard microarray methods require a series of single-factor graded tests and multivariate analysis performed at the end of the process for individual instrument processing steps. 28 These methods require numerous experiments to determine optimal conditions and yet still lack the ability to perform real-time analysis during the process steps. In contrast, the automated platform, with real-time observation and image capture, facilitates the testing and optimizing of experimental conditions.
Materials and Methods
Microarray Processing Platform Fabrication
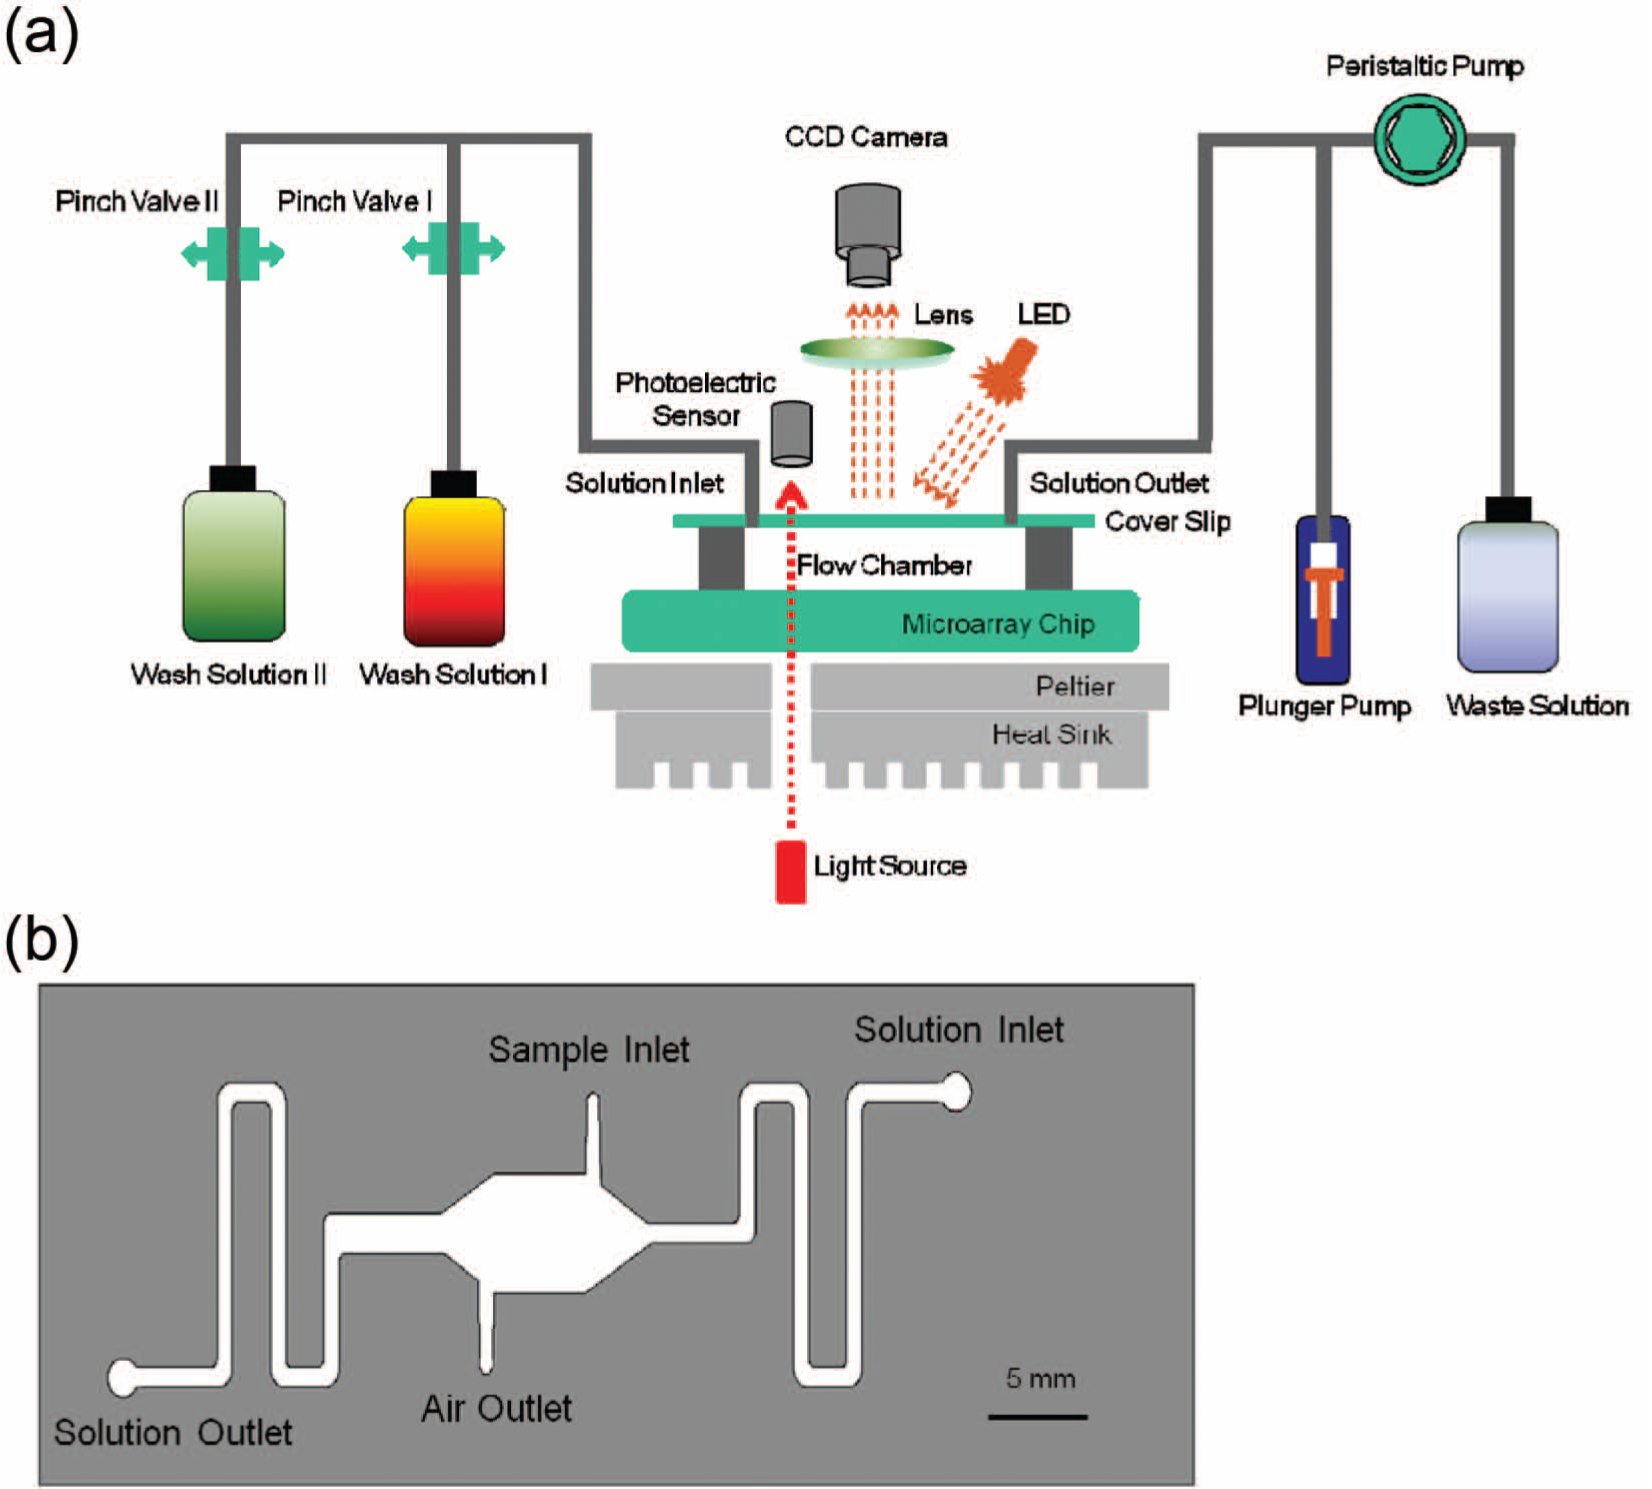
The schematic diagram of the automated platform for automatic microarray processing ( Fig. 1a ) shows four integrated system elements, a microfluidic chip system, a peripheral flow system, a temperature control system, and an imaging system.
(
The microfluidic chip contains three layers: the bottom layer is a glass microarray chip with spotted probes (CapitalBio, Beijing, China), the middle layer is a flow chamber fabricated by the laser beam cutting the double-sided adhesive film of 200 µm in thickness, and the top layer is the transparent coverslip of polyethylene terephthalate with four holes ( Fig. 1b ). Two holes are used for the sample injection and air discharge and two for the connections with the peripheral flow system. The DNA sample is injected through the individual sample inlet to prevent the contamination of the solution inlet of the peripheral flow channel. After the sample injection, the sample inlet and the air outlet are sealed using the adhesive film.
The peripheral flow system is established using two pinch valves (Bio-Chem Fluidics, Boonton, NJ), a plunger pump (IDEX, Lake Forest, IL), a peristaltic pump (Longer Precision Pump, Baoding, China), solution bottles, and connecting lines ( Fig. 1a ). During the dynamic hybridization step, pinch valve I is opened, pinch valve II is closed, and the cylindrical plunger of the plunger pump reciprocates to cause the reciprocating flow of the sample in the chamber. During the first washing step, the pinch valve I is opened, the pinch valve II is closed, and the peristaltic pump drives the wash solution I to flow through the chamber. During the second washing step, the pinch valve II is opened, the pinch valve I is closed, and the peristaltic pump drives the wash solution II to flow through the chamber. A Peltier-based temperature control system provides appropriate temperature during the hybridization and washing steps. The heat sink assists the heat dissipation from the Peltier during cooling steps.
A simple imaging system is used for imaging the beads and includes a light-emitting diode (LED) source (OSRAM, München, Germany), a lens for magnifying the imaging, and a charge-coupled device (CCD; Crevis, Gyeonggido, Korea) for the signal detection. The imaging system continuously monitors the spot signals on the microarray during the microarray processing.
Bead-Based Microarray Analysis
Genomic DNA was extracted from the whole blood using the Tianamp Blood DNA kit (Tiangen, Beijing, China), and the mutations associated with nine genetic loci were assayed using a commercial microarray-based detection kit (CapitalBio),26,27 involving steps of PCR amplification, single-stranded DNA (ssDNA) enrichment, target hybridization, slide washing, imaging, and results analysis.
Briefly, multiplex PCR was carried out by S1000 Thermal Cycler (Bio-Rad, Hercules, CA) in two tubes, each containing 10 ng/µL reference genomic DNA from the genetic hearing-loss mutation detection kit or 2 ng/µL purified genomic DNA from the whole blood of patients, primer mixture, and the PCR reactant solution. The amplified products from the two tubes were mixed, and the amplicons were then captured by magnetic beads. The captured amplicons were denatured by NaOH, and only the ssDNA attached to the magnetic beads was collected and dissolved in hybridization buffer. The magnetic beads were also used as the labels for the subsequent imaging. The process of ssDNA enrichment using magnetic beads can reduce the detection limit of the input genomic DNA concentration needed for the mutation detection. 26
In the conventional microarray assay, 14 µL of the hybridization solution, including the labeled targets, was added to a microarray chip located in a hybridization box, which was incubated at 50 °C for 1 h in a bath. The microarray chip was then removed and washed with two consecutive wash solutions (0.1% SDS, 0.3× SSC at 42 °C for 2 min, and 0.06× SSC at 42 °C for 2 min) using an agitation table. After centrifugation of the chip to dryness, fluorescence signals on the microarray were detected by a LuxScan 10K-A fluorescence scanner (CapitalBio).
For the automated microfluidic platform, 25 µL of the hybridization solution was injected into the sample inlet to cover the central hexagonal array region. The sample inlet and the air outlet were then sealed. The plunger of the pump moves forward for 0.5 s at a speed 10 µL/s, then stops for 1 s, and then moves backward with the same parameters. The hybridization temperature and washing temperature were set at 50 °C and 42 °C, respectively, while each washing step was for 2 min at 1.5 µL/s flow velocity. The platform software automatically analyzed the microarray images and reported the allele genotypes detected.
Microarray Layout and Expected Images
The pattern of probes distributed on the microarray is shown in Figure 2a , where different numerals indicate different genetic loci, whereas lowercases w and m represent wild-type and mutant-type variant probes, respectively. A number of control probes are also represented: QC and NC are the positive and negative controls for the spotting of probes during array manufacture, PC and BC are the positive and negative controls for the hybridization reaction, IC is the internal control for the gene amplification, and MC is the positive control for magnetic beads. Ideally, after a successful microarray processing, QC and PC can be detected only by fluorescence imaging, IC and MC can be detected by both the fluorescence imaging and the bead imaging, and BC and NC are typically not detectable by either fluorescence imaging or bead imaging. For a sample with all wild-type alleles, all of the wild-type spots should be detectable by both the fluorescence imaging and magnetic bead imaging.
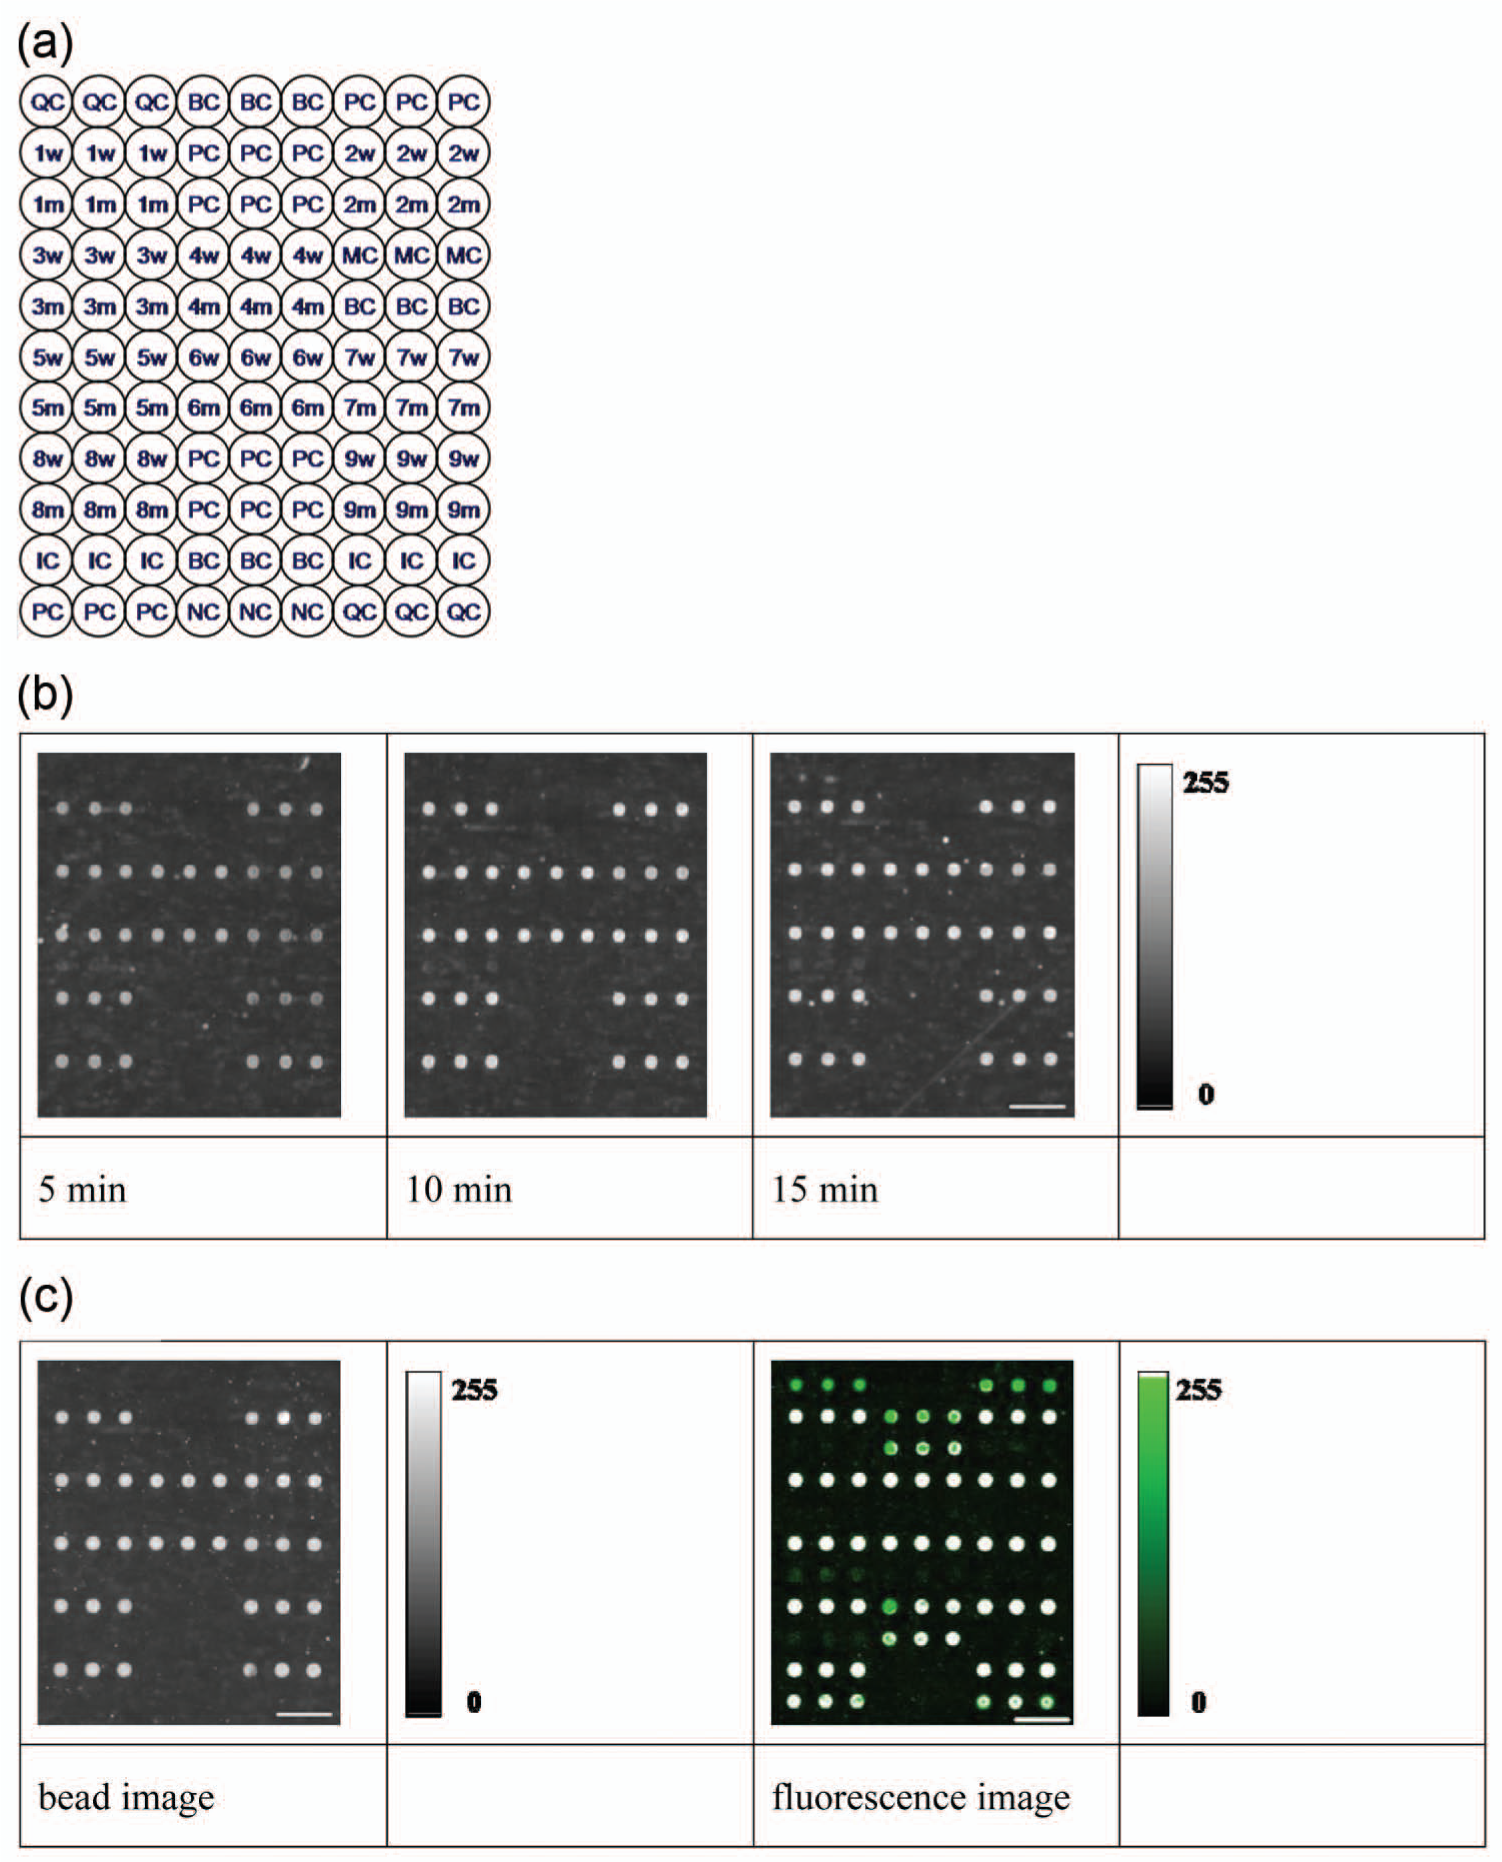
Spot pattern and images of the microarrays used for the hearing-loss gene mutation detection. (
Results and Discussions
To establish operational conditions for the automated platform, we first explored different hybridization times during genotyping of different known hearing-loss gene mutations. The results were then compared with those from the conventional microarray assay. We also discuss the optimization of microarray processing under operational conditions, to achieve detection of a range of mutations in several hearing-loss–associated genes. Subsequently, we demonstrate the validation of performance of the platform by examination of DNA samples from patients carrying each different mutant-type and wild-type genotypes. Finally, we discuss some limitations of the current design of this automated platform and propose improvements to obtain better performance.
Comparison of the Signals from the Automated Platform and Conventional Platform
Fully wild-type allelic samples were tested initially to determine some standard operational conditions on the automated platform. These conditions were then kept constant throughout, except the hybridization time, which was varied to determine an optimal period for accelerated assays. Images of the microarray runs on the automated platform are shown in Figure 2b , using hybridization times of 5, 10, or 15 min. Wild-type–specific, IC, and MC spots were each detectable, whereas all gene mutation–specific and BC and NC spots were not detectable. The automated platform analysis software reported that the alleles of this sample were all wild-type, demonstrating correct automated hybridization and further automated processing and analysis of the microfluidic microarray. The positive spot signals detected, including wild-type alleles and IC and MC signals, were each significantly higher than the undetected negative ones, including each of the mutant-type, BC, and NC signals for each hybridization time tested. This indicates that the false-positive and false-negative reports normally do not occur on the automated platform for hybridization times of 5, 10, and 15 min.
Figure 2c shows the same wild-type samples processed by conventional microarray assay using a hybridization time of 60 min, which was subsequently imaged and analyzed using both the fluorescence scanner and the bead-imaging system of the automated platform. Both the fluorescence and bead image results of the conventional microarray assay reported that all alleles of the sample were wild-type. The bead images in the conventional microarray assay are visually similar to those shown in Figure 2b from the automated microarray assay.
As the hybridization step is the largest element of the microarray processing time, we studied the influence of the hybridization time on the spot signals ( Fig. 3 ). Hybridization times of 5, 10, and 15 min were examined with different automated platform runs ( Fig. 3a ), and these signals (among 33 groups of probes) were compared with the conventional microarray assay using a hybridization of 60 min ( Fig. 3b ). For the positive signals on the automatically processed arrays, marked increases in signal intensities were seen between hybridization times of 5 min and 10 min (p < 0.01); however, there were only slight increases between the hybridization time of 10 min and 15 min (p < 0.01). Furthermore, although there were obvious differences between positive signals with the hybridization time of 10 min on the automated platform and positive signals after 60 min by conventional hybridization (p < 0.01), there were no obvious differences between signals with the hybridization time of 15 min on the automated platform and 60 min on the conventional platform (p > 0.05). The positive signals in the conventional assay showed marked increases when the hybridization time was prolonged from 5 min to 15 min in Figure 3b (p < 0.01); however, the positive signals with a hybridization time of 15 min in the conventional assay were obviously weaker than the positive signals with a hybridization time of 5 min in the automated assay (p < 0.01). For the negative signals, there were no obvious differences among different hybridization times (p > 0.05) on the automated platform or the conventional assay. These results demonstrate that the positive signal intensities increased while the negative signals remained invariable with prolongation of the hybridization period on the automated platform or on the conventional platform, and when the hybridization time was prolonged to 15 min, the positive and negative signals on the automated platform were equivalent to those with the hybridization time of 60 min on the conventional platform. During conventional microarray hybridization, the sample solution resides statically in the array area; hence, the binding efficiencies of probes and targets are low and the processing time is consequently prolonged significantly compared with the dynamic hybridization, in which the sample solution flows across the active array area. Thus, the automated platform can shorten the processing time for hybridization to one-fourth of the standard hybridization time.
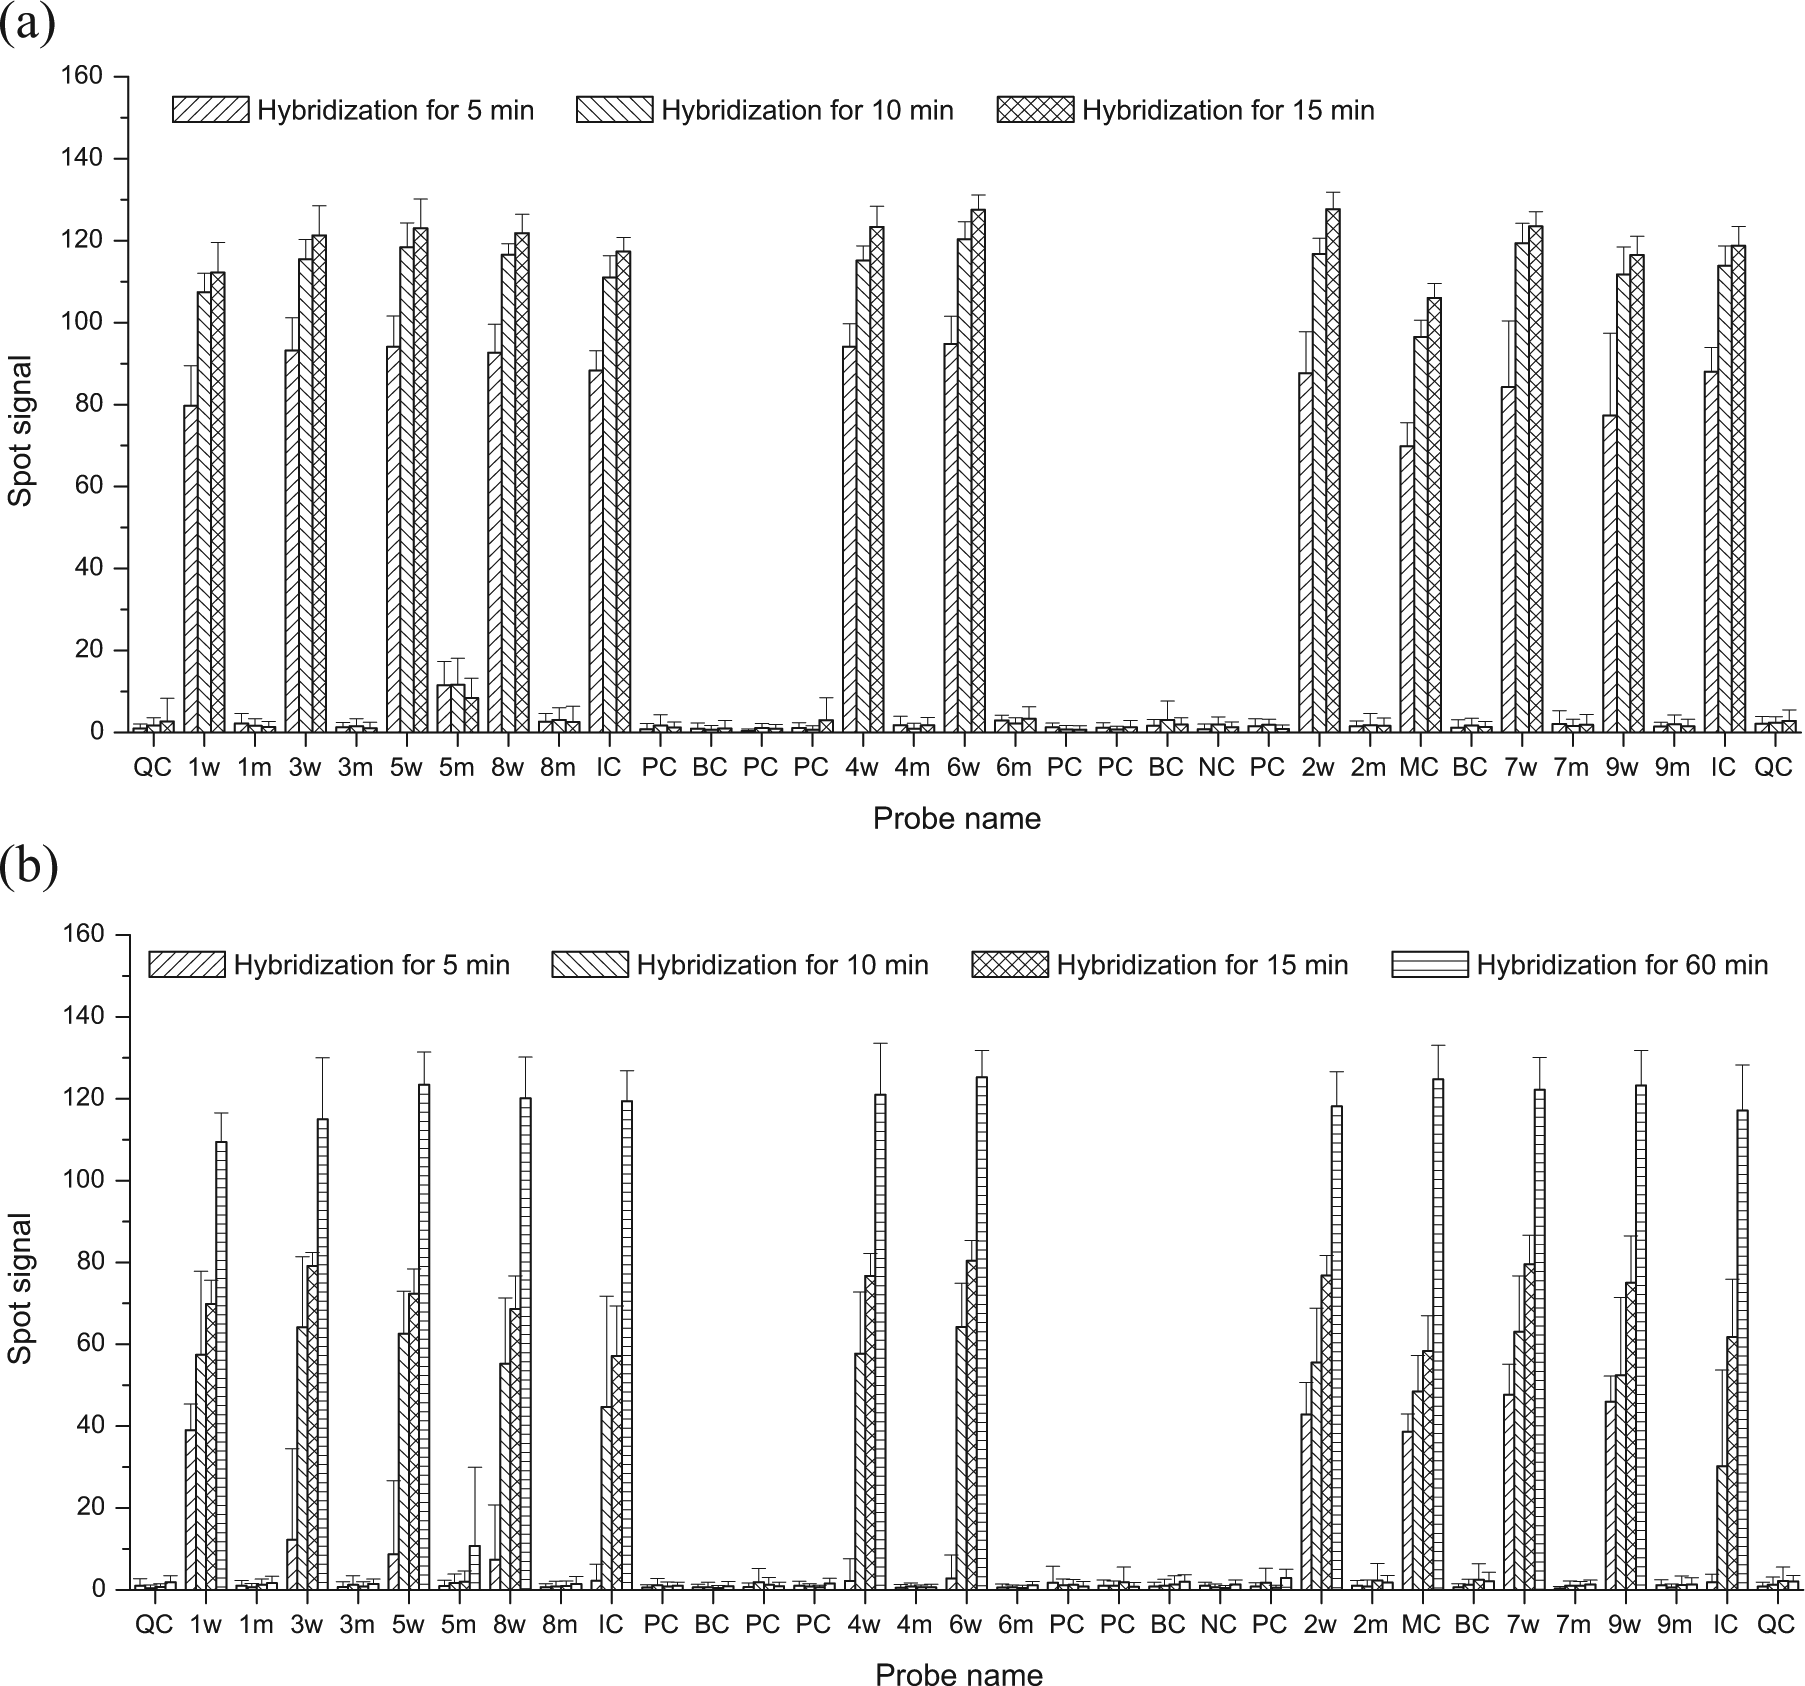
Comparison of spot signals among the 33 groups of probes present on the microarrays. Each group contained three replications on a microarray. Five microarrays were processed under each condition. Error bars represent the standard deviations of 15 replications. (
Use of the Automated Platform for Optimization of Microarray Processing
The automated platform continuously monitors the microarray signals in real time during the hybridization and washing steps. Videos of these process steps can be used to analyze particular steps and to optimize the microarray processing conditions for individual molecular genetic assays. Video images at 1 min intervals are shown in Figure 4 . In this experiment, the hybridization period was 15 min, and the washing period was 2 min for solution I and 2 min for solution II, such that the total processing time was 19 min. As hybridization time progresses, the positive signals gradually appeared and increased in intensities, whereas negative and control signals remained almost undetectable. After the washing steps to remove unbound magnetic beads, the background signals of the images sharply decreased.
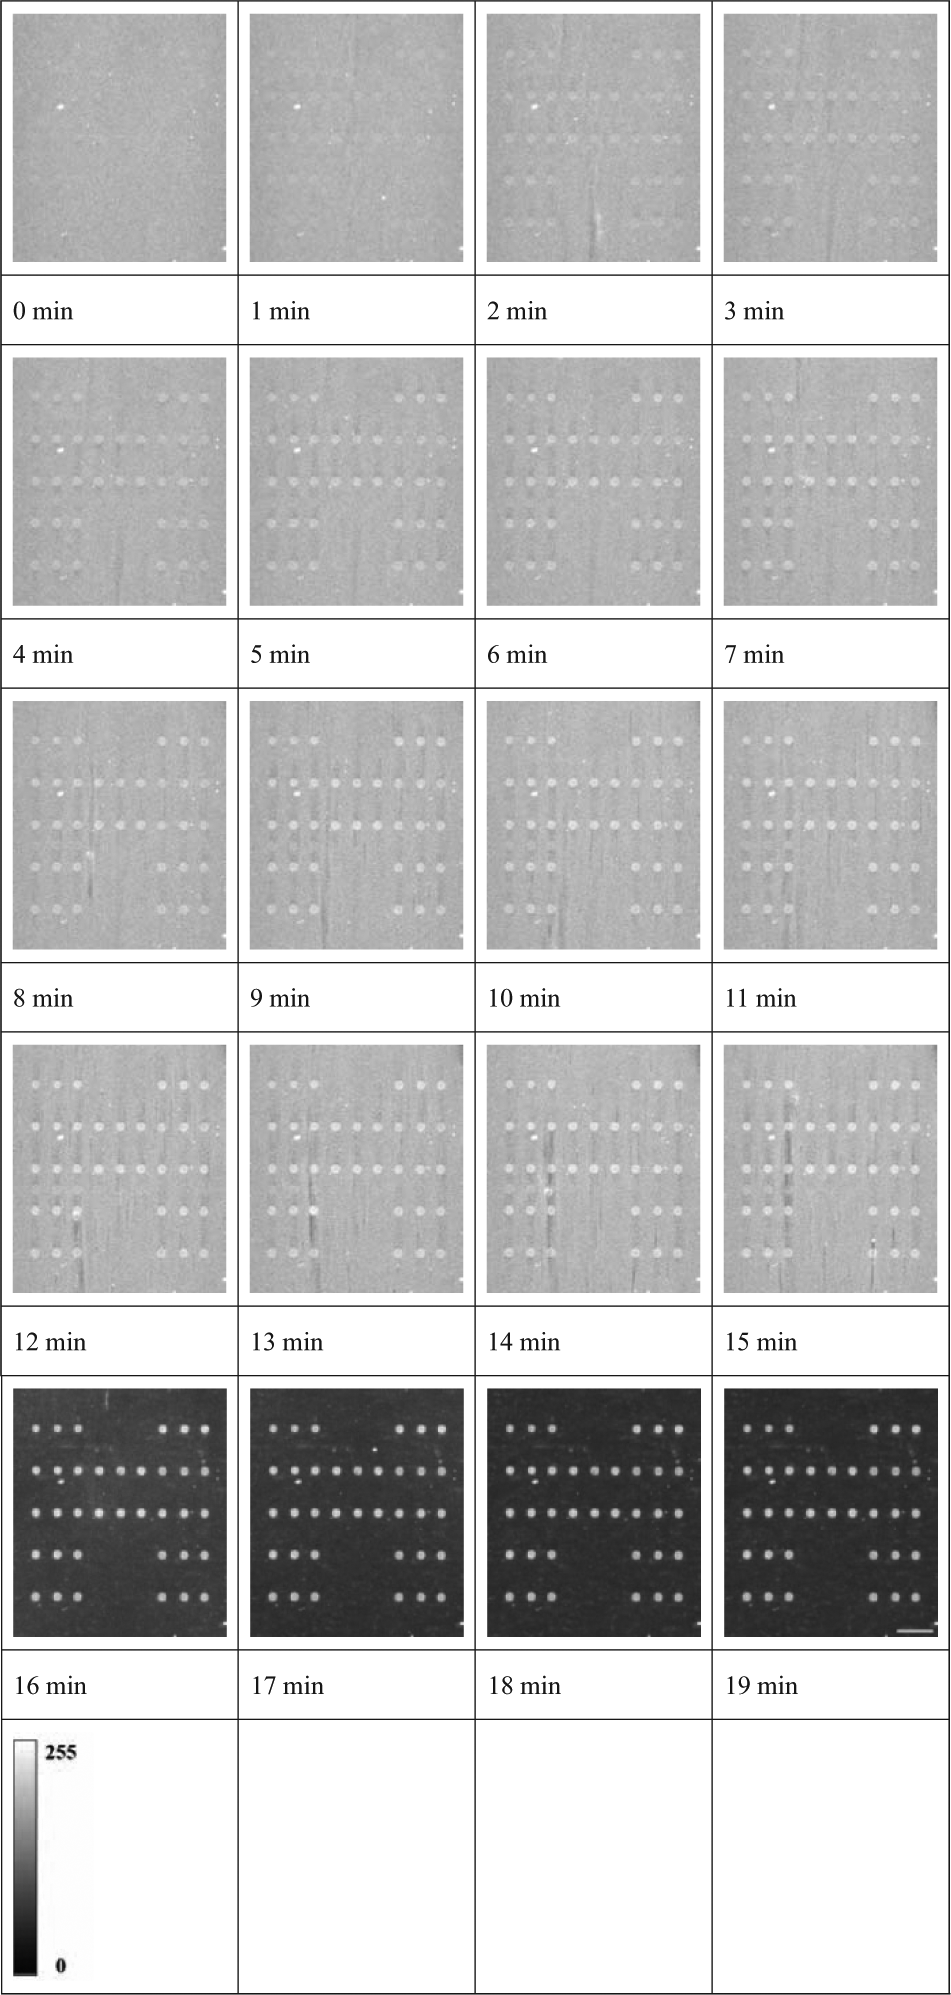
Sequential video images of the array area captured at intervals of 1 min. The microarray was processed on the automated platform with a total hybridization time of 15 min. The genomic DNA sample contained all wild-type alleles. Scale bar, 500 µm.
One of the most common issues with the microarray technology is to arrive at acceptable optimum conditions for this assay with minimal false-positives and false-negatives. The quantitative analysis of the spot signals throughout the processing can be used for this purpose. The signals of six typical probes were extracted, including the wild-type probe of 1w, the mutation-type probe of 1m, MC, NC, IC, and the mutation-type probe of 5m. These data are shown in Figure 5 . The 1w, MC, and IC signals presented significant increases from the beginning to 10 min and only slight increases from 10 min to 15 min. The 1m and NC signals were almost zero during the 15 min hybridization period. There was also a slight increase for the 5m signals during this 15 min, due to nonspecific binding. As the wash solution flowed through the chamber from 15 min to 19 min, the 1w, MC, and IC signals rapidly increased due to the decreases of the background signals; the 1m and NC signals were still zero. The nonspecifically bound beads on the 5m spots were washed away, and the residual 5m signal was close to zero. Hence, the conditions for the hybridization and washing can result in minimal false-positives. The results shown in Figure 5 demonstrate that there were obvious differences between positive signals, such as 1w, MC, and IC signals, and the negative signals, such as 1m, 5m, and NC, from the time of 5 min, which suggests that the hybridization time for this molecular array assay could potentially be optimized to 5 min on the automated platform for minimal false-negatives.
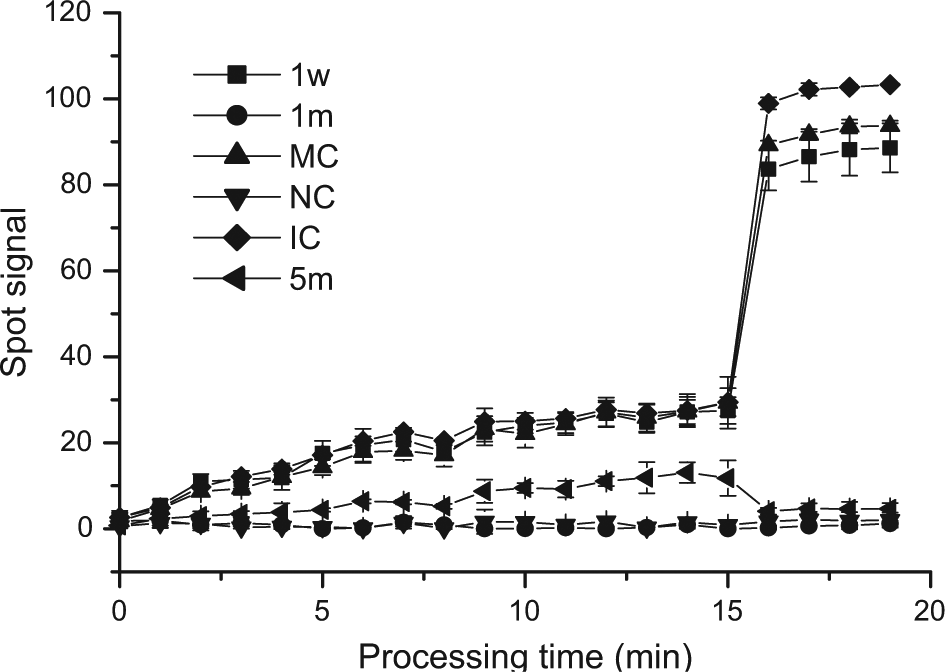
Signals obtained from six typical probes at 1 min intervals over the entire processing time. The signals shown are for the wild-type probe (1w), the mutation-type probe (1m), MC, NC, IC, and the mutation-type probe (5m). The microarray was processed on the automated platform with the hybridization time of 15 min. The genomic DNA was extracted from a sample with all wild-type alleles.
If nonspecific signals appeared in the video images during the hybridization step, similar to the 5m signal, this could suggest the need for the optimization of washing conditions, such as adjusting the flow rate of wash solution. If positive signals do not appear in the video images after the washing steps, this might indicate that the labeled targets cannot bind to the probes or that the bound targets were washed away. For the former case, adjusting the hybridization conditions may be necessary, whereas for the latter case, the wash times or the flow rate of the wash solution(s) may need to be adjusted. Such detailed real-time monitoring and signal analysis to aid assay optimization cannot be performed easily on conventional microarrays. When the automated platform is used for other applications, the processing conditions will require case-by-case optimization because of the changes of reaction systems such as the sequences and concentrations of the targets and probes and the material and size of the label. In general, the hybridization time should be prolonged when the concentrations of the targets decrease. If the size of the label increases, the flow rate of wash solutions should be decreased to prevent the specifically bound targets from being washed away. When the altered material of the label is used, some parameters of the detection system may be slightly adjusted for higher signal-to-noise ratios of the images.
Validation of the Hearing-Loss Gene Mutation Detection
We tested 32 samples from patients, including 28 mutant-type and four wild-type samples, to validate the use of the automated platform for hearing-loss gene mutation detection. A detection limit of 2 ng/µL genomic DNA and an array hybridization time of 15 min were used for each consecutive analysis. The microarray images are shown in
Operational Considerations of the Automated Platform
Because of the active flow of solutions during the automated microarray processing, particular caution must be taken, as the presence of air bubbles in the hybridization or the wash solutions might impede hybridization to exposed areas, result in a failure to wash adequately, or physically scrape bound beads off from the microarray surface. The tensile force of moving bubbles or forces released during fusion of small bubbles could potentially scrape off bound beads, resulting in false-negative signals. Similarly, contamination of the solution inlet might result in the false-positive signals.
To prevent the presence of the bubbles, we filled the inlet tubes with the wash solutions prior to the hybridization step. This involved first connecting a tube to the solution inlet and outlet, then peristaltic pumping of the wash solutions through the chamber until the inlet pipes were full. Last, the tube used for the connection between the solution inlet and the outlet was removed. To prevent contamination of the solution inlet, the hybridization solution, containing the DNA sample, should be strictly restricted in the hybridization chamber and isolated from the solution inlet. Two designs were produced for these purposes, including the construction of the sample inlet and outlet (see Fig. 1b ) and the use of a photoelectric sensor (see Fig. 1a ). The sample inlet and air outlet were designed for the sample injection, which were apart away from the solution inlet. The DNA sample can be injected onto the microarray and be restricted within the chamber. During the hybridization step, the DNA sample was moved in a reciprocated motion within the chamber and may flow to the solution inlet. To keep the DNA sample away from the solution inlet, we established a photoelectric sensor for the detection of the sample solution. The light beam transports across the chip channel close to the solution inlet. As soon as the sample flows through the light beam, the light intensity detected by the sensor will vary, and the plunger of the plunger pump will change the motion direction. Then the sample will flow away from the solution inlet to prevent contamination. To demonstrate that contamination was prevented, we analyzed the sample without genomic DNA on the automated platform, which was regarded as the negative sample, here shown in Figure 6 . Only MC signals can be detected, and no mutation-specific, wild-specific, or IC signals were detectable, which indicates that no false-positive signals were present on the microarray; thus, no residual DNA samples contaminated the automated platform.
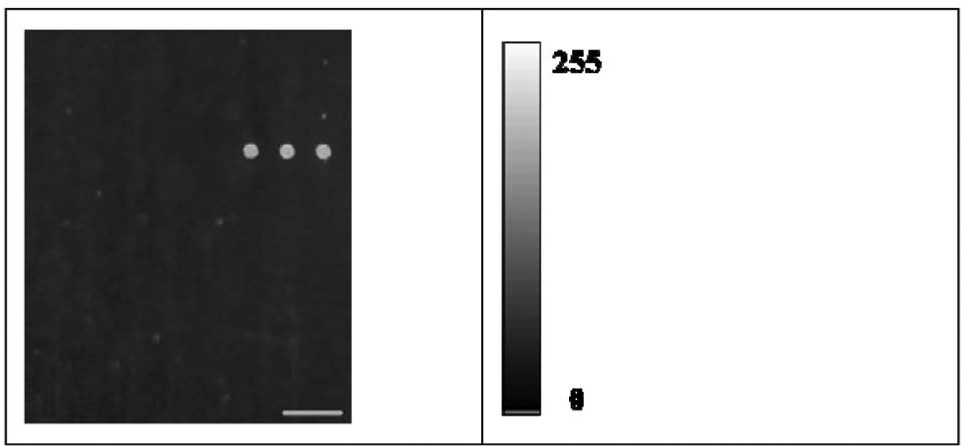
Video image of a microarray area processed automatically after a 15 min hybridization period. No genomic DNA was present in the hybridization solution, and only the positive bead signal is visible. Scale bar, 500 µm.
The performance of the automated platform compares well with other commercial microarray processing stations in particular respects. Current commercial hybridization instruments such as the Roche NimbleGen Hybridization System (Roche NimbleGen, Madison, WI) 29 and the Agilent SureHyb Microarray Hybridization System (Agilent Technologies, Santa Clara, CA) 30 require that the slide cover be pressed tightly to prevent leakage or cross-contamination, and typically three-phase agitation is used to promote local sample flow within a limited volume. These features demand close attention by users during assembly to prevent contamination, and the processing time is prolonged by the limited solution flow during the hybridization. Fully robotic instruments such as Affymetrix GeneTitan (Affymetrix, Santa Clara, CA) 31 have been developed for research applications, which eliminate all manual processing steps. Although these instruments provide extremely high analytical content and throughput, as well as high reproducibility, they require absolute compatibility among each functional instrumented element and involve engineering complexity. Hence, the expensive instruments such as GeneTitan do not easily lend themselves for use in many clinical situations, in which low cost, low complexity molecular genetic analysis, and only one or several specific genetic tests are required.
Conclusions
We have established an automated platform for rapid microarray processing. The performance was validated by the bead label–assisted microarrays for the hearing-loss gene mutation detection. The results showed that this automated platform has three advantages compared with the conventional microarray processing. First, the automated platform can analyze the microarray from the hybridization to the analysis report without manual intervention, improving reproducibility and eliminating user errors. Second, dynamic hybridization based on the flow of the sample solution on the automated platform can accelerate the hybridization process and thus greatly reduce the processing time for microarray analysis. Last, the automated platform can monitor the analysis processes in real time during hybridization and washing steps, which can be used to aid efficient testing and optimization of the different processing conditions, including identifying probe effectiveness.
Footnotes
Acknowledgements
We thank Huanxia Li, Pingping Qu, and Jinglin Zhou (CapitalBio Corporation) for helpful support.
Declaration of Conflicting Interests
The authors declared no potential conflicts of interest with respect to the research, authorship, and/or publication of this article.
Funding
The authors disclosed receipt of the following financial support for the research, authorship, and/or publication of this article: This work was supported by the National High-tech R&D Program of China (grant 2012AA020102).
References
Supplementary Material
Please find the following supplemental material available below.
For Open Access articles published under a Creative Commons License, all supplemental material carries the same license as the article it is associated with.
For non-Open Access articles published, all supplemental material carries a non-exclusive license, and permission requests for re-use of supplemental material or any part of supplemental material shall be sent directly to the copyright owner as specified in the copyright notice associated with the article.