
Abstract
Lab-on-a-chip technology achieves a reduction of sample and reagent volume and automates complex laboratory processes. Here, we present the implementation of cell assays on a microfluidic platform using disposable microfluidic chips. The applications are based on the controlled movement of cells by pressure-driven flow inside networks of microfluidic channels. Cells are hydrodynamically focused and pass the fluorescence detector in single file. Initial applications are the determination of protein expression and apoptosis parameters. The microfluidic system allows unattended measurement of six samples per chip. Results obtained with the microfluidic chips showed good correlation with data obtained using a standard flow cytometer.
INSTRUMENT AND CELL ASSAY CHIP
The 2100 bioanalyzer was introduced by Agilent as the first available product using microfluidic Caliper LabChip® technology. On this platform microfluidic chip-based approaches for a variety of separation techniques have been introduced, addressing DNA, RNA, and most recently, protein. The system is capable of two-color fluorescence detection and runs disposable microfluidic glass chips. For the detection of cellular fluorescence parameters a modified 2100 bioanalyzer is used. This instrument utilizes vacuum to move cells through the microfluidic channels of the cell assay chip having channel dimensions of 25 × 75 μm. Fluid flow is controlled by a peristaltic pump driven by a stepper motor and the vacuum is tightly controlled by a pressure sensor (range 0–140 mbar) thus guaranteeing a constant flow speed within the microfluidic channels. A special cartridge is used to interface the pressure control with the chip. The cartridge also contains a filter assembly to prevent fluid from entering the system in case liquid should overflow the waste well of the chip (Figure 1). For optical detection cells are prestained with fluorescent markers.
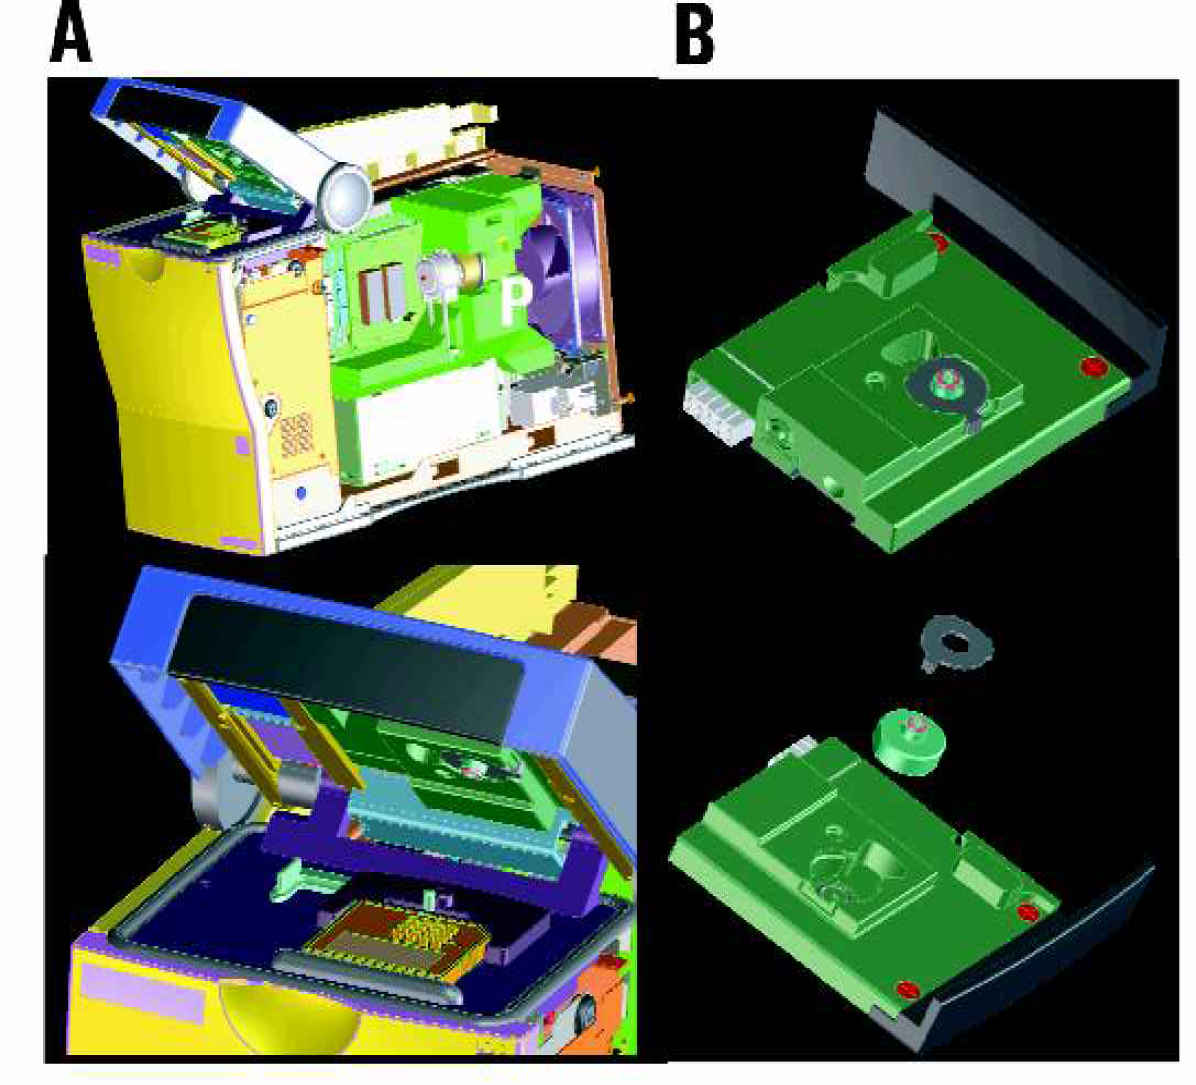
Instrument. A) For the detection of cellular fluorescence parameters a modified Agilent bioanalyzer 2100 was used. It uses vacuum to move cells through the microfluidic channels of the chip. Fluid flow is controlled by a peristaltic pump P driven by a stepper motor. Pressure is controlled by a pressure sensor. B) A special cartridge is used to interface the pressure control with the chip. The cartridge contains a filter assembly to prevent fluid from entering the system.
Following staining, cells are resuspended in an isobuoyant buffer at a concentration of 2 × 10⁶ cells/ml to guarantee that they remain in suspension during the course of a chip run (approximately 25 minutes). Only 10 μl of this suspension were loaded per sample well (20,000 cells). Before the cells are loaded, the chip is primed with an aqueous solution through the priming well, which fills the channels by capillary forces. The chip can then be loaded with up to six cell samples and a fluorescent reference dye. This dye fills one channel after vacuum is applied to the chip, which then acts as a reference point for the optical detection system of the instrument before cell measurements actually start. Since flow cytometric assays require that cells pass by the detector in single file, a design was incorporated in the chip where cells are hydrodynamically focussed to one side of the microfluidic channel before passing the detector after vacuum is applied (Figure 2A). This is achieved by a junction of the channel carrying the cells and a buffer channel shortly before the detection area (pinch area, Figure 2B).
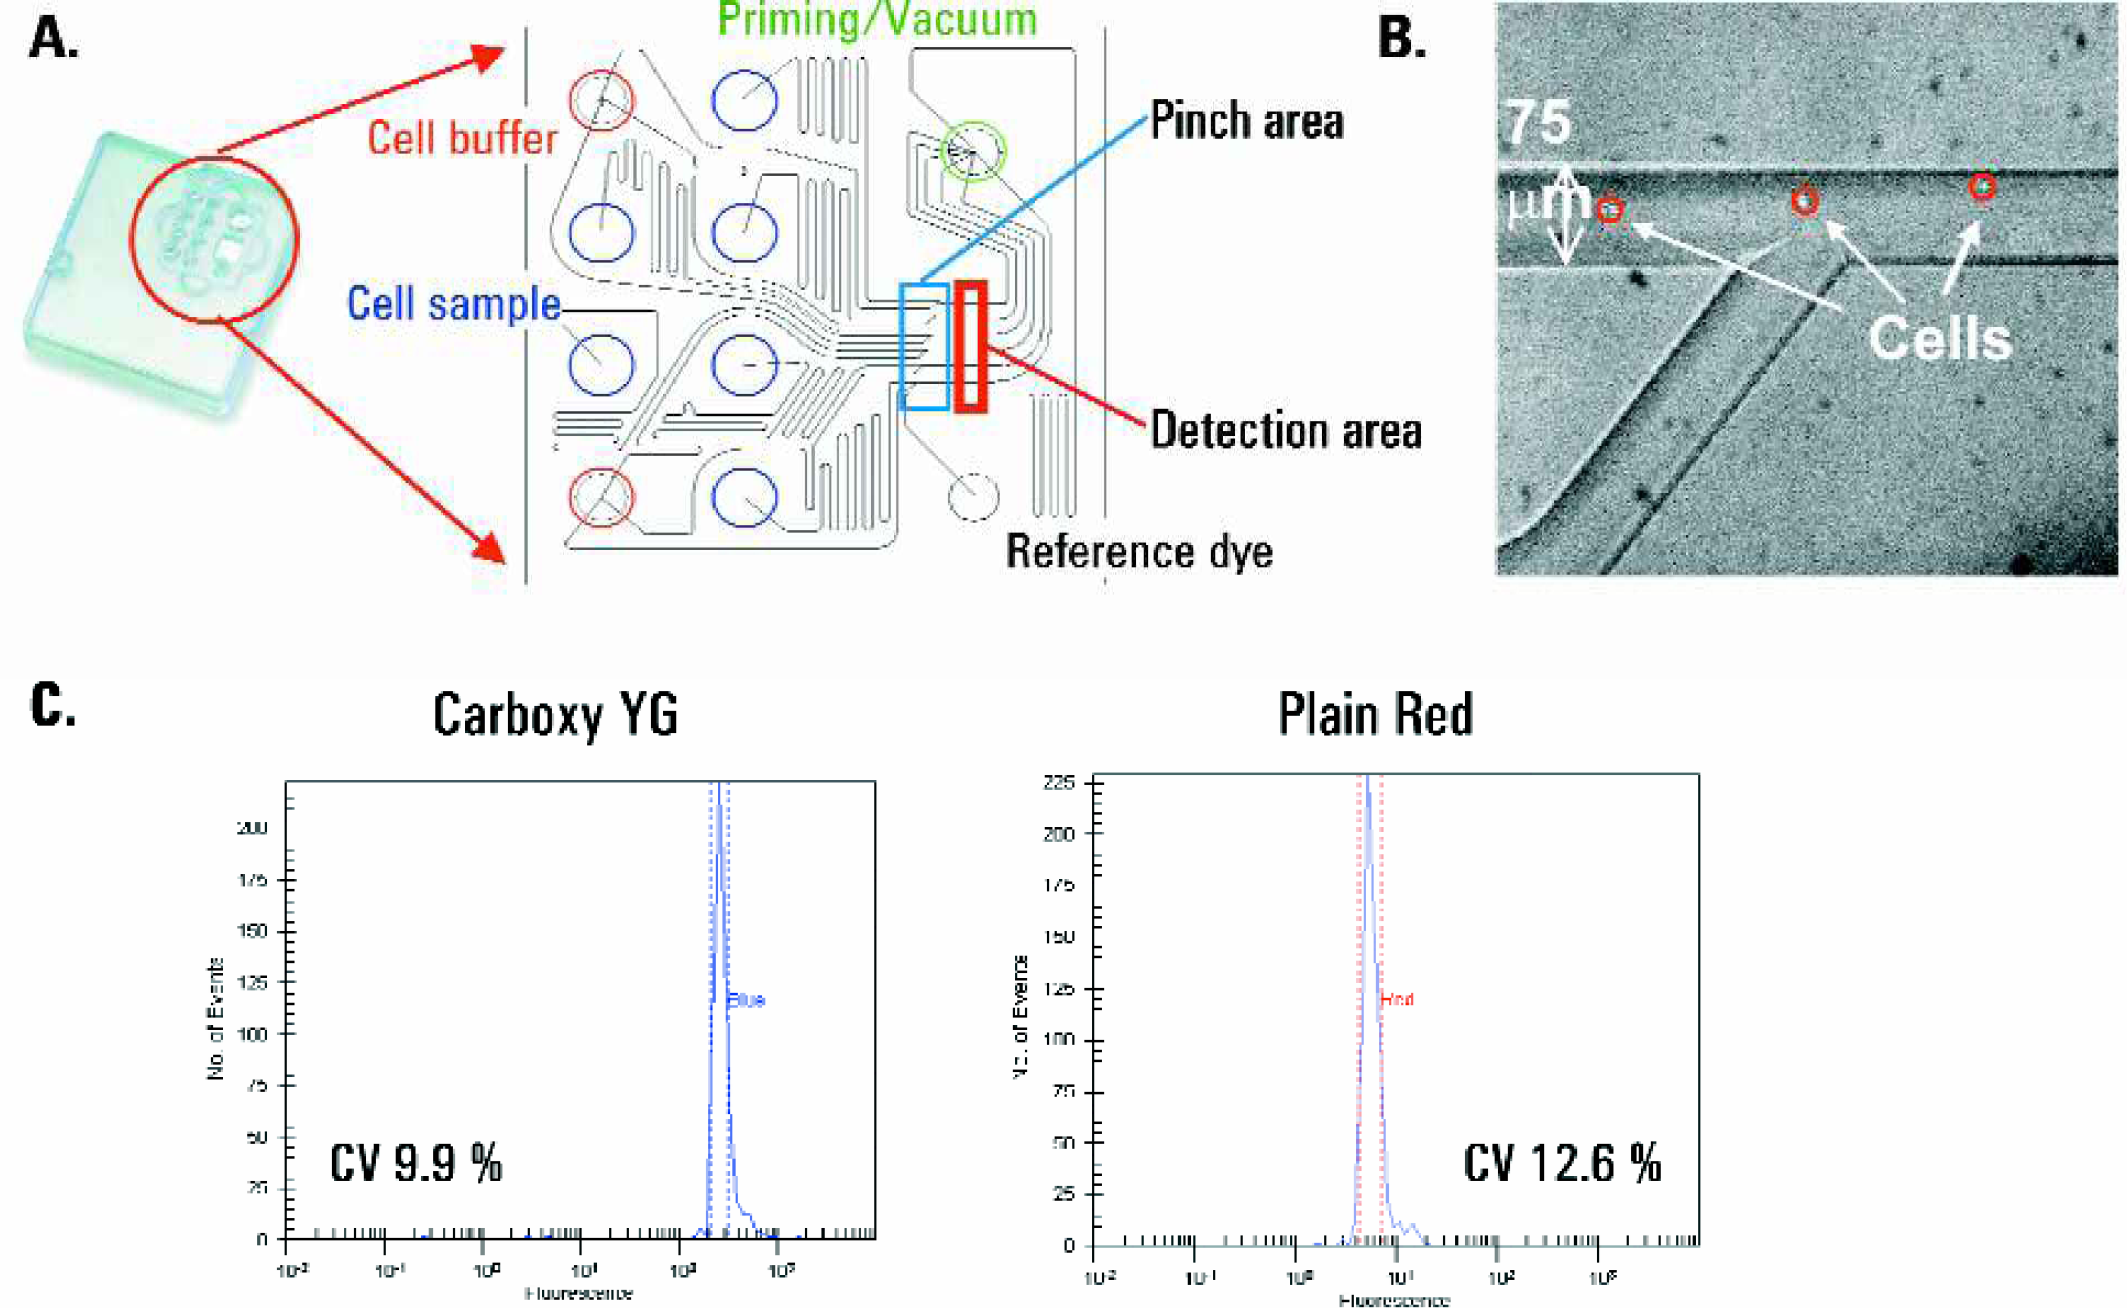
Chip features and layout. A) Microfabricated glass chips for handling nl-amounts of liquid were glued into a plastic caddy which accommodates six sample wells, two buffer wells, one well for a reference dye, a well for a vacuum interface and collection of fluid waste. B) Each sample channel is joined by a buffer channel in close proximity to the detection area. Here each sample is focussed to a portion of the microchannel in order to generate a single file cell stream. C) Performance of the chip design and detection system was tested with commercially available calibration beads red Fluoresbrite™ Plain Red microspheres and blue Fluoresbrite™ Carboxy YG microspheres, “Polysciences Inc., Warrington, PA”. Beads were measured on the microfluidic system and frequency histograms are shown. CV's measured at half height of histograms were compared to the supplier's specifications (percentage for blue, percentage for red beads).
In order to test performance of the chip design and detection system we used commercially available calibration beads. Red and blue fluorescently labeled beads were measured on the microfluidic system (Figure 2C). Histogram CV's (coefficient of variation) measured at half height of frequency histograms were 9.9% for blue beads and 12.6% for red beads. The supplier's specifications for the bead preparations were 7% for the blue and 10% for the red beads. The data confirmed that the number of cases where more than one bead or only a part of a bead pass the detector at a given time is not significant under the experimental conditions used. If this would have been the case, one would have expected significant broadening of the fluorescence intensity distribution.
During the chip run fluid flow in all channels is tightly regulated by the vacuum applied. Only one channel is read by the optical system at a given time. However, fluid flows in all channels simultaneously. A chip can be run for a maximum time of 25 minutes. Thus, if only one sample is loaded on a chip it can be measured for that time while two samples could be analyzed for 12.5 minutes. Furthermore, it is not mandatory that each sample on a chip is analyzed for the same amount of time. We programmed the system so that it can switch to the next sample once a certain number of cells have passed the detector. For the experiments described below a constant flow rate was used (average flow rate of the cells was 3–4 mm/s) and approximately 500–1000 cell events of 20,000 were analyzed per sample in 240 seconds. However, it is conceivable that with higher flow rate analysis time on such type of instrumentation could be reduced. The instrument uses two independent light sources, a blue LED and a red diode laser which excite at 458–482 nm and 625–645 nm respectively. The light is focussed on the microfluidic channel and fluorescence emission from the cells is detected at 510–540 nm (blue) and 674–696 nm (red). We have found a cell-sample concentration of 2 × 10⁶/ml to be optimal. Lower concentrations yield less events while significantly higher concentrations could result in more than one cell passing the detector at a given time. For the applications tested we did not observe limitations regarding sensitivity. As a reference samples were measured on a standard flow cytometer.
DATA ANALYSIS
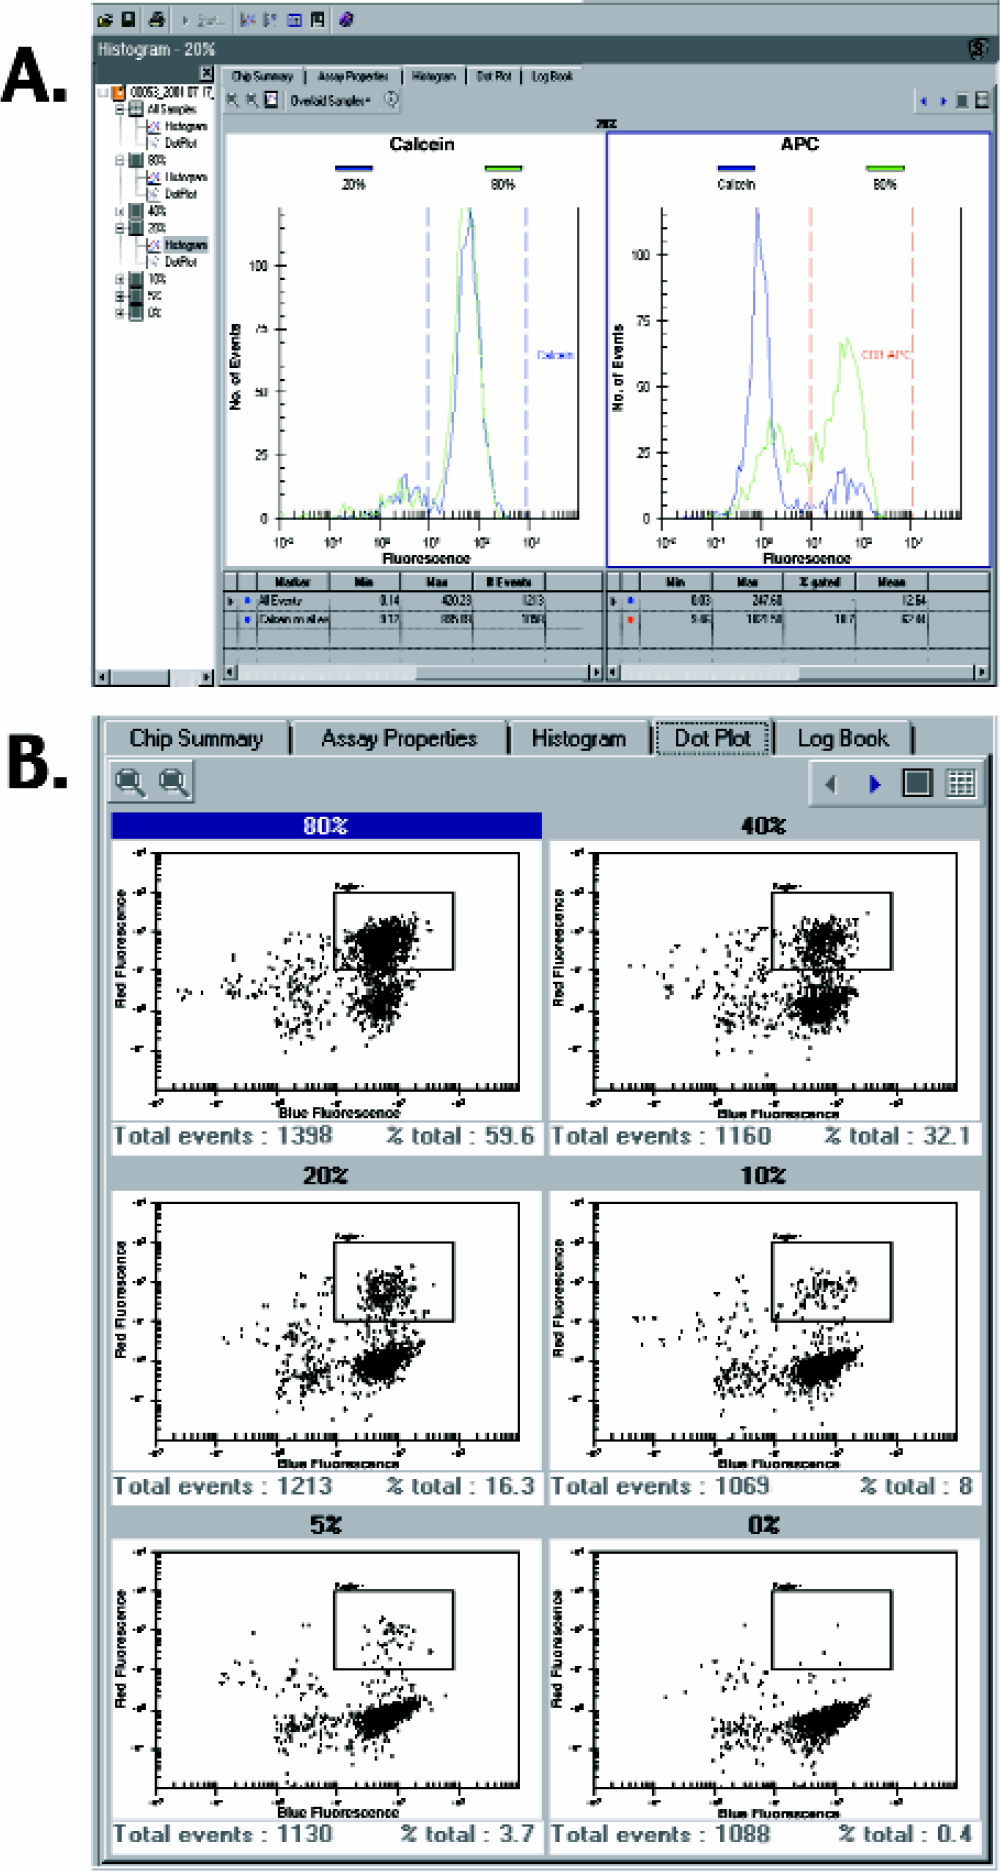
Cells are stained such that each cell carries a fluorescence intensity value in both colors. As a cell passes the instrument optics in single file its fluorescence intensities in the two detection wavelengths are detected and recorded. The sampling frequency of the detector is above 1 kHz. Each cell emitting fluorescence above a threshold value is counted as one event and for each event the intensities of the two different fluorescent signals (red and blue) are recorded. The intensity of the fluorescent signal depends on the amount of fluorescent probe bound to or incorporated into the cell. The data can be analyzed in two ways: Events are either plotted against their fluorescence intensity in frequency histograms (number of events vs. fluorescence intensity in one color, Figure 3A) or they are plotted in a two-dimensional dot plot where the fluorescence intensity of each color is depicted along one axis (Figure 3B). Cell populations of interest can be selected by regions (in dot plots) or markers (in histograms). The software calculates percentages of subsets within a given population, e.g., percentage of antibody-stained or annexin-positive cells within the live cell population and gives statistical information.
APPLICATIONS
The applications described herein are monitoring of protein expression and apoptotic processes in eucaryotic cells. Monitoring cellular protein expression is a critical step for characterization of cell populations or assay optimization and can be achieved by staining the protein of interest with a specific antibody.
Fluorescently labeled antibodies are used to detect cells bearing specific antigens (lipids, proteins or carbohydrates). The antibody may be directly conjugated to a fluorescent probe or a fluorescently labelled secondary antibody may be used which specifically binds to the primary antibody.
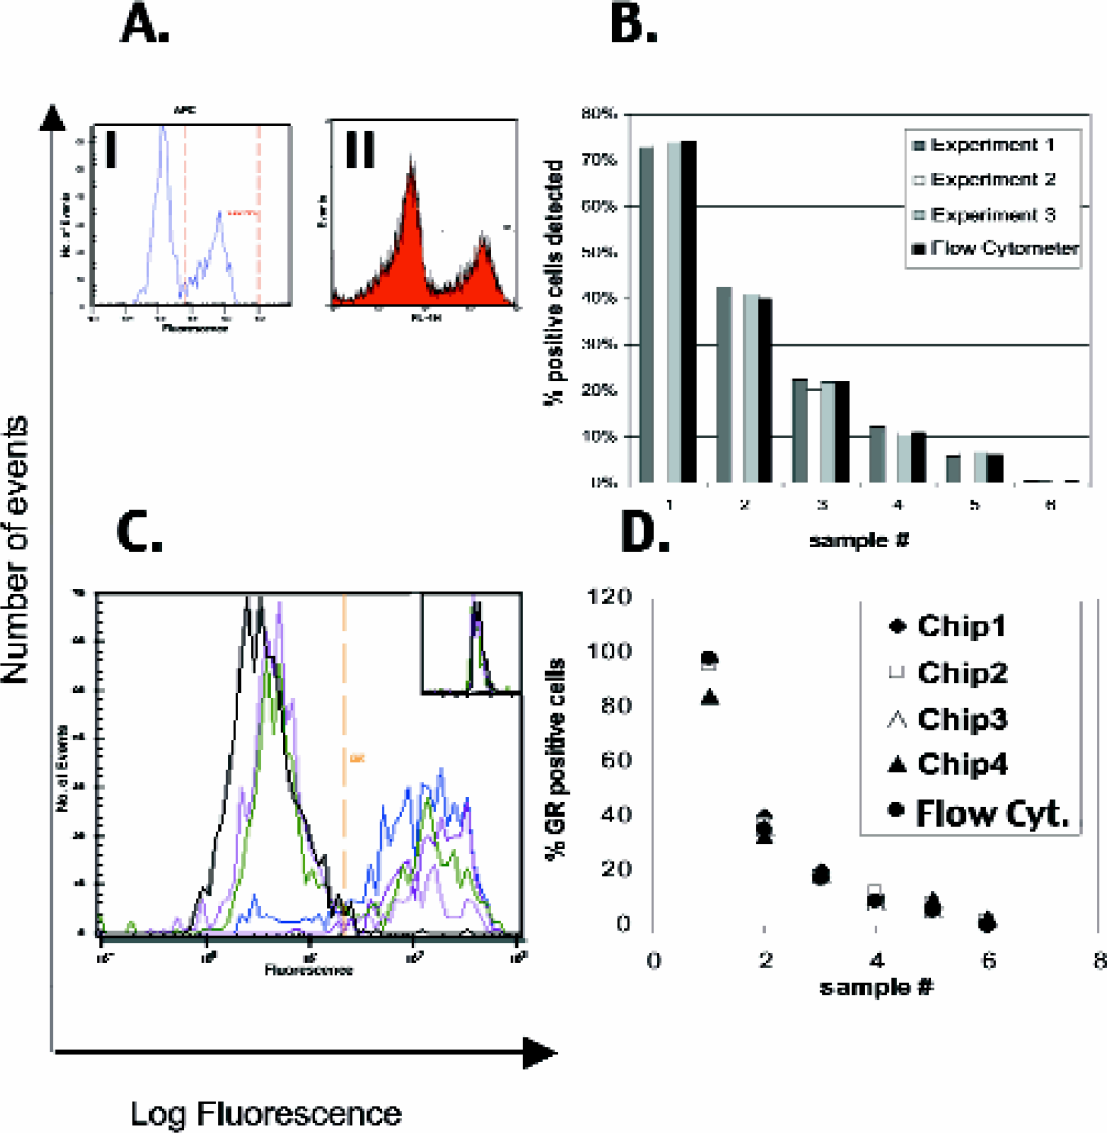
The detection of proteins generally only depends on the availability of a suitable antibody. Figure 4 demonstrates the use of our microfluidic system for detection of protein expression analysis. In Figure 4A, B, Jurkat cells were stained with a directly labeled CD3 antibody and the live-cell stain calcein. Histogram quality and data of the microfluidic system as expressed in CD3 positive cells within the live cell population are in agreement with that of conventional flow cytometer. Less than 10% protein expressing cells were detected with good accuracy and reproducibility (Figure 4B). The application of antibody staining is not restricted to the use of antigens that are expressed on the cell surface. Following fixation and permabilization of cells, intracellular antigens can be easily detected. Figure 4C, D, demonstrate that fixed and permeabilized cells can readily be detected after staining with a suitable antibody. As a counterstain the DNA-specific dye SYTO16 was used. The percentages of expressed protein detected compare well with the results obtained with a standard flow cytometer (Figure 4D).
Antibody staining of extra- and intracellular proteins on eucaryotic cells. Jurkat cells were stained with calcein (1 μM final concentration) alone or with calcein and APC-labeled anti hCD3-antibody. After washing, mixtures of both populations were prepared at various ratios of antibody/calcein and calcein only-stained cells to simulate different percentages of protein expressing cells.
Due to the instrument's blue light source we were able to use the system to detect cells transfected with green fluorescent protein (GFP). Transfection, the introduction of foreign DNA into eukaryotic cells, is an important tool for studying the regulation of gene expression as well as protein expression and function. In order to determine the percentage of cells in a transfection experiment that have received and are expressing the foreign DNA, a reporter gene can be used. A convenient reporter for monitoring transfection efficiency is green fluorescent protein (GFP). When excited by blue light, the protein emits bright green fluorescence. Many expression vectors containing GFP variants are commercially available. In Figure 5 CHO-K1 cells were transfected with EGFP-DNA (B) or mock transfected (A) and analyzed for GFP expression.
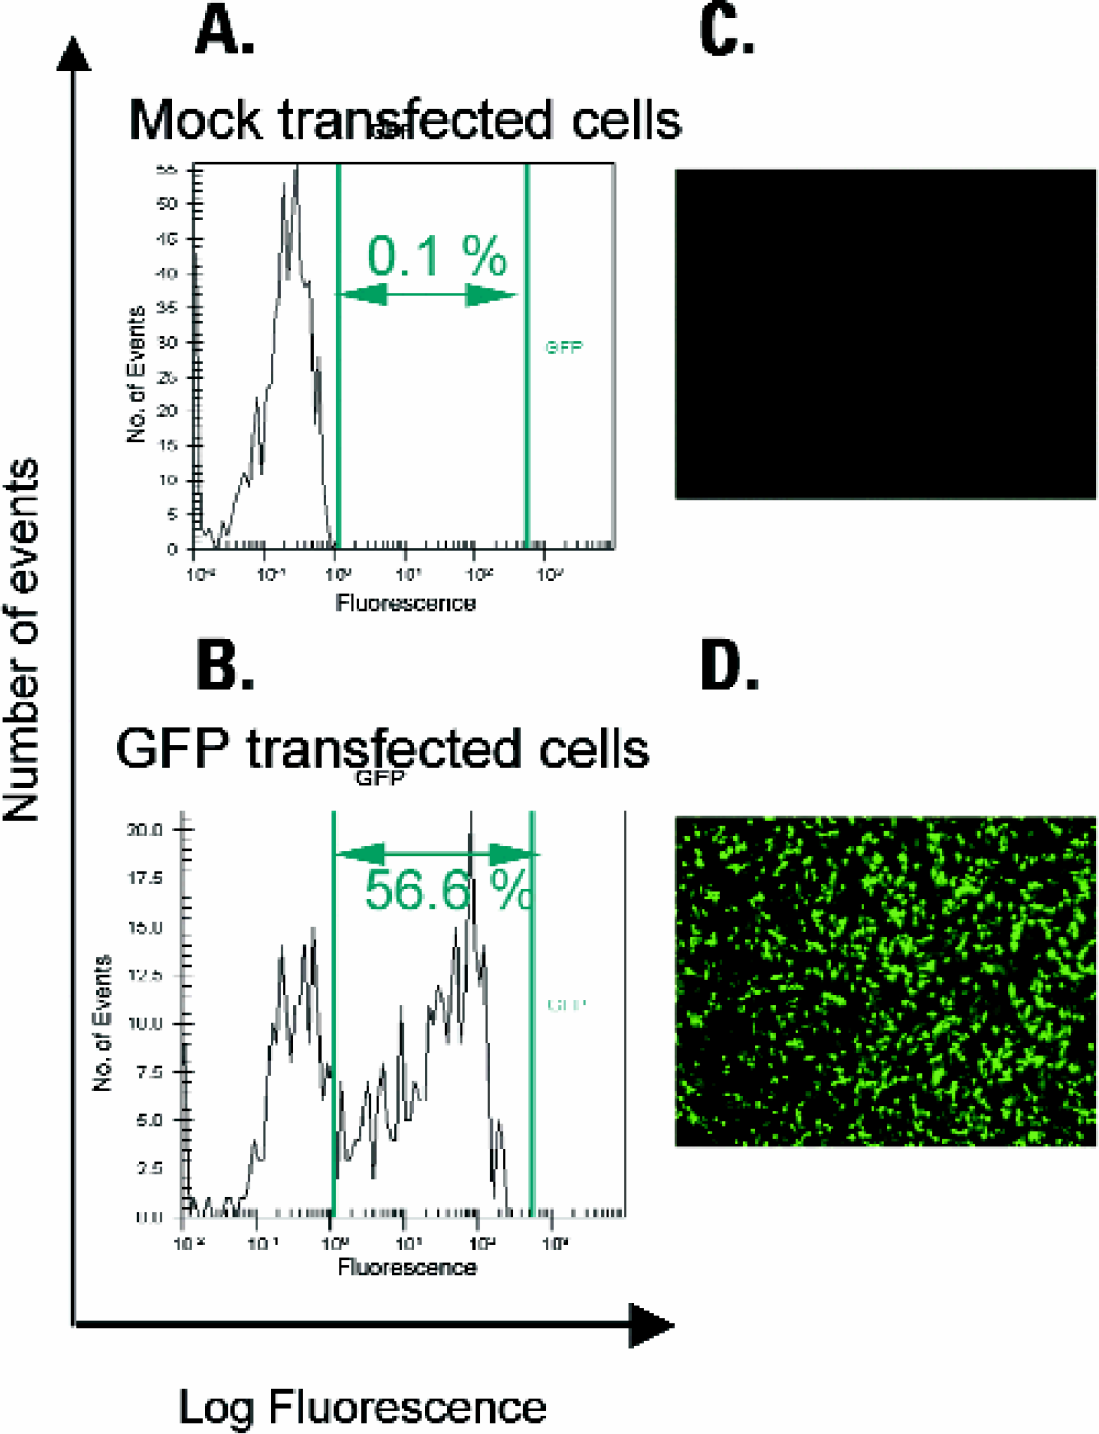
Analysis of GFP transfection. CHO-K1 cells were transfected with EGFP DNA and Lipofectamine according to the manufacturer's protocol. Mock-(A) and GFP-transfected (B) cells were harvested, stained with the live cell stain carboxynaphthofluorescein (CBNF) and analyzed on the microfluidic system. Shown are histograms (A, B) listing the percentages of GFP-expressing, CBNF-positive cells and photographs of the cells taken using a fluorescent microscope (C, D) with a 530 nm filter.
The third application investigated was the detection of apoptotic cells. Upon induction of apoptosis, phosphatidylserine (PS), a membrane constituent that is actively confined to the inner leaflet of the cell membrane becomes displayed on the outer leaflet of the membrane. Annexin V is a member of the family of calcium and phospholipid-binding proteins with high affininty for PS 1 and can be used as a sensitive probe for PS. The measurement of annexin V binding to the cell surface was performed in conjunction with the live stain calcein, which is a specific indicator for cells with an intact membrane. 2
In addition to changes in the cell membrane, apoptosis involves the active participation of endogenous cellular enzymes. A family of cysteine proteases (caspases) seems to represent the effector arm of the apoptotic program. 3 Caspase-3 is a key protease that is activated during the early stages of apoptosis and is synthesized as an inactive proenzyme. It is cleaved and thereby activated in cells undergoing apoptosis. The expression of active caspase-3 can be studied in apoptotic cells by staining the cells intracellularly with antibodies. Figure 6 shows typical data of the microfluidic system obtained in apoptosis experiments. Jurkat cells were either not treated or treated with camptothecin for different time points to induce apoptosis. Cells were then stained with either annexin V and Cy5-streptavidine or active caspase 3 and a Cy5-labeled secondary antibody. As a counterstain either the live dye calcein or the DNA binding dye SYTO16 was used. We observed that the percentage of apoptotic cells detected was almost identical at a given timepoint of induction independently of staining for caspase 3 or PS (compare ∼70% apoptotic cells in Figure 6E, F at 2h). This indicates a nearly simultaneous induction of active caspase-3 and display of phosphatidylserine on the outer leaflet of the cell membrane which has been described previously. 4 The data obtained in several experiments compared well with reference data obtained from a flow cytometer (Figures 6E, F).
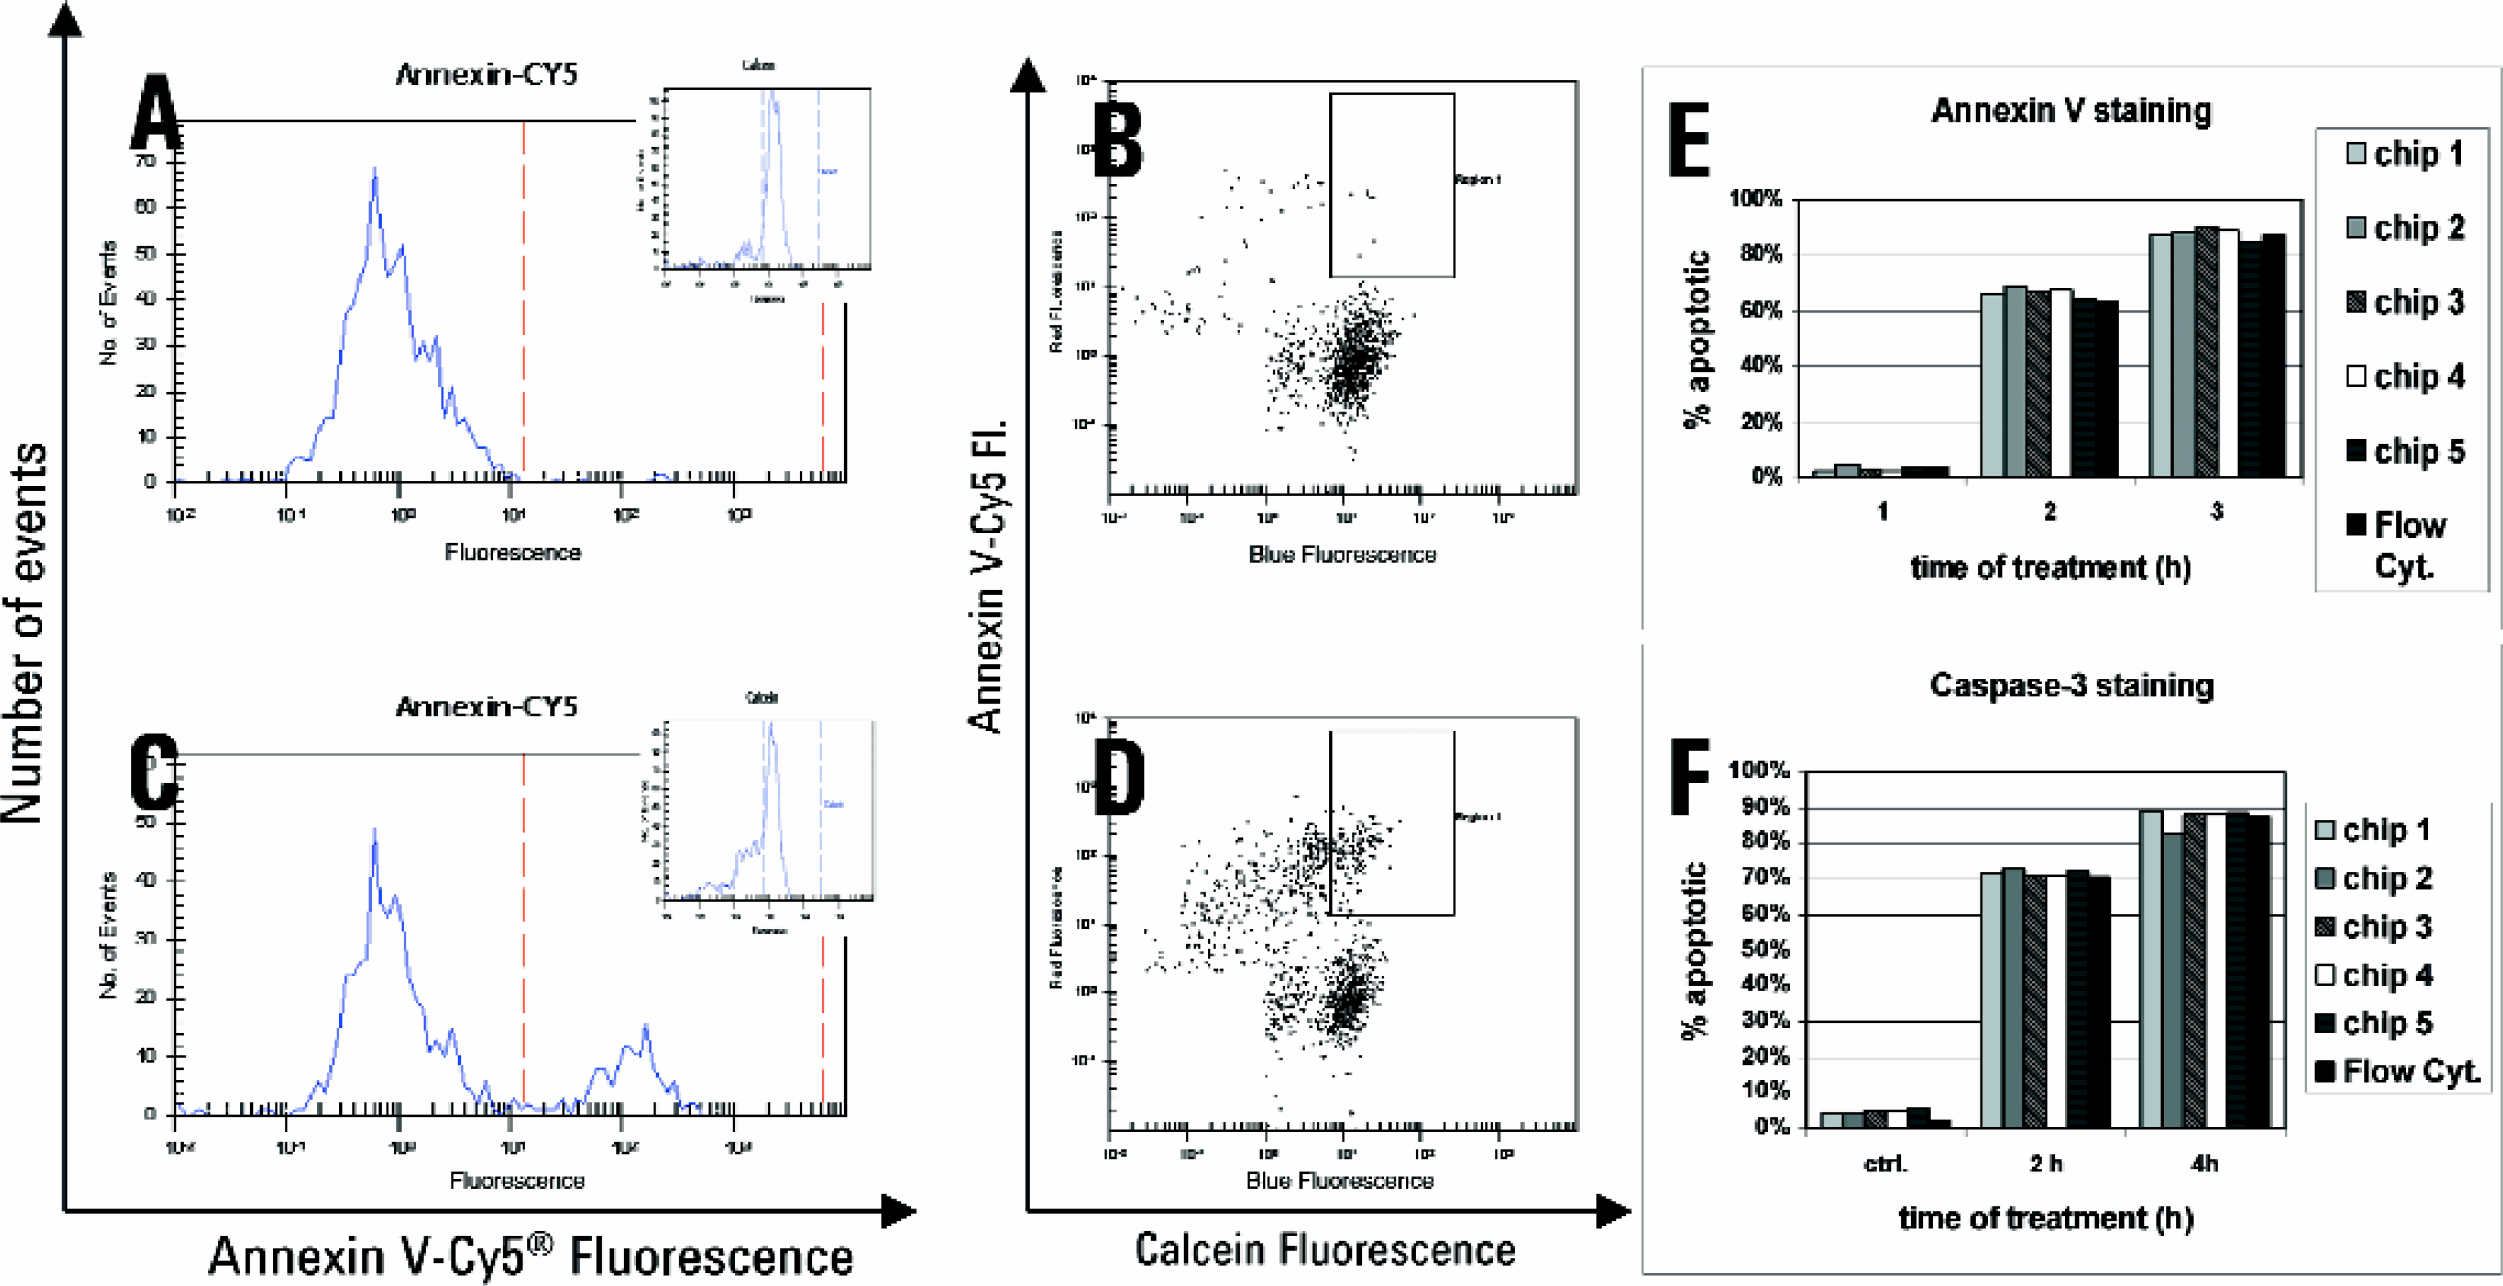
Detection of apoptosis in Jurkat cells by annexin V- and active caspase 3-staining. Cells were treated with camptothecin, subsequently stained with either the live cell stain calcein and annexin V-biotin/Cy5-streptavidine or SYTO16 and active caspase 3/Cy5-labeled antibodies. Cells were then washed and analyzed on the microfluidic chip-based system. Annexin-Cy5 histogram of untreated (A) and 24 h treated (C) sample. Dot plot of untreated sample (B) and 24h treated (D) annexin-Cy5 stained sample. Reproducibility of annexin V (E)- and active caspase 3 (F)-staining. Cells were treated with camptothecin for different timepoints and stained. Data of 5 chips was compared with measurements of the same samples on a standard flow cytometer (Flow Cyt).
CELL TYPES TESTED
In order to assess the compatibility of our microfluidic chips with different cell types we obtained a number of adherent cells and cells growing in suspension. Adherent cells were trypsinized to remove them from their substrate before staining. Cells were stained with fluorescent reagents and run on the microfluidic chips under the standard conditions. Cell types included, but were not limited to, CCRF-CEM, CHO-K1, Jurkat, H4, THP-1, HEK293, U937, HL-60 and A10 cells. During these tests we did not observe clogging of channels or sticking of cells to the channel walls. This was also true if cells were apoptotic, permeabilized or fixed.
CONCLUSIONS
We developed miniaturized flow cytometric assays for antibody staining, GFP-detection, annexin V and activated caspase-3 assays using microfluidic glass chips. Six samples per chip were automatically measured and analyzed. The results from the chip-based system with two-color detection are in good agreement with conventional flow cytometry. In addition, the system shows high sensitivity and low cell consumption: 20,000 cells or less per sample were required for an analysis. Several cell types differing in morphology and origin were successfully tested. The instrument is compact and could be used in a biosafety hood for work with infectious material with no risk of contamination to the operator. The chips are disposable, eliminating cross-contamination of tubing with dyes and cleaning procedures. Compared to flow cytometers which are generally set up in a centralized lab the microfluidic instrument can be used in a decentralized fashion. Especially, if DNA, RNA or protein applications are run on the same instrument this aspect will prove to be advantageous. Finally, the lab-on-a-chip device is easy to use, requires a short setup time and performs automated data analysis and storage. It is conceivable that this approach could be used to further automate fluorescence-based cell analysis, i.e., in HTS applications.
ACKNOWLEDGEMENTS
The instrument and the microfluidic chips were jointly developed by Caliper Technologies and Agilent Technologies. The authors would like to thank their colleagues at Agilent Technologies and Caliper Technologies for their work on microfabrication, assay development and engineering. Gerd Luedke and Tobias Preckel are Research Scientists, Carsten Buhlmann is Product Manager Cell Assays at Agilent Technologies GmbH. Samuel Chan is Staff R & D Scientist, Benjamin Wang is R & D Engineer, Robert Dubrow is Director of Product Development at Caliper Technologies.