
Abstract
The secretome represents the set of proteins secreted into the extracellular space of cells. These proteins have been shown to play a major role in cell-cell communication. For example, recent observations revealed the presence of diffusible factors with proliferative properties in the secretome of cancer cells. Thus, a qualitative and quantitative analysis of the secretome could lead to the identification of these factors and consequently to the development of new therapeutic strategies. Here, we provide an automated simple and effective strategy to identify novel targets in the secretome of specifically treated cells using liquid chromatography–tandem mass spectrometry (LC-MS/MS). Furthermore, we explore the supportive role of mass spectrometry (MS) in the development of functional assays of identified secreted target molecules. Simplicity is achieved by growing cells in medium free of serum, which eliminates the need to remove the most abundant serum proteins and at the same time reduces disturbing matrix effects. Upon identification of these factors, their validation and characterization will follow. Moreover, this approach can also lead to the identification of proteins abnormally secreted, shed, or oversecreted by cells as response to a stimulus. Furthermore, we also discuss the problems that one may encounter. Finally, we discuss the broad application of automated MS-based proteomics, particularly in cancer research, highlighting new horizons for the use of MS.
Introduction
The secretome represents the set of proteins secreted into the extracellular space of cells.1,2 These proteins have been shown to play a major role in cell-cell communication. Therefore, characterization of the proteins that form a secretome (secretomics) can help us not only in the identification, quantification, and characterization of proteins but also in the identification or prediction of the physiological or pathological state of a cell type or a cell population.3–10
Many methods can be used to analyze secreted proteins, and historically, perhaps the most frequently used ones have been Western blotting and enzyme-linked immunosorbent assay.11–13 However, recent advances in mass spectrometry–based proteomics approaches allow one not only to identify all proteins in a particular secretome but also to automatize these proteomics approaches.14,15 Here we describe the concept of a proteomics approach for the characterization of proteomes and the transition of a proteomics approach to high-throughput analysis of secreted proteins (secretomics).1,2,4,5 Particular applications of proteomics in the analysis of secretomes, as well as the problems that one may encounter during these analyses, are also described.
Secretome: Definition and Classification
Secretomes are the proteins secreted by cells, either as a natural process or as a result of a stimulus.1–6,8 Secretomes may be classified according to various criteria, such as the type of the cell or the type of the tissue producing the secretome, or the location of the secreted proteins such as extracellular but nonsystemic, intraorgan (e.g., intrahepatic) or extracellular but systemic, extraorgan (e.g., blood, saliva, urine, or lymphatic fluid).16–29 Depending on the type of secretome analyzed, specific information may be obtained. For example, analysis of proteins secreted by cells grown in cell culture will reflect the health and activity of those cells. Conversely, analysis of proteins from blood or urine will reflect the health not only of an organ (e.g., the health of the liver by measuring the activity of the blood transaminases) but also of the whole organism.22,25–33 Although a particular secreted molecule (and/or protein) may reveal information about a particular organ, a combination of secreted molecules (and/or proteins) may reflect the physiological state of a particular cell type, or of an organ or of the whole organism. Here we primarily discuss secreted proteins, as analyzed by mass spectrometry.
Proteomics Methods for Analyzing Secretomes
Two main types of analyses can be performed using proteomics approaches: top-down secretomics and bottom-up secretomics.34–36 These two different approaches are conventionally or historically performed on different instruments (i.e., mass spectrometers that have different ionization sources). In top-down secretomics, the preferred mass spectrometer has a matrix-assisted laser desorption ionization source (MALDI source; the mass spectrometer is MALDI-MS), whereas in bottom-up secretomics, the preferred mass spectrometer has an electrospray ionization (ESI) source and the mass spectrometer is named ESI-MS.37–39 If the MS is coupled with high-performance liquid chromatography (HPLC), then the MS system is HPLC-ESI-MS or LC-MS. If the MS is a tandem MS, then the LC-MS is an LC-MS/MS.
Top-Down Secretomics
Top-down secretomics involves analysis of secreted proteins by MALDI-MS without prior digestion or fractionation. The analysis can be performed using either scanning in the low molecular mass range or high molecular mass range. Once the differences between two conditions are identified, then they can be reanalyzed by a different method (e.g., sodium dodecyl sulfate–polyacrylamide gel electrophoresis [SDS-PAGE]). Although the principle is simple, this method is not very successful, simply because many eukaryotic cells secrete proteins that are intensely posttranslationally modified.40–47 Therefore, a peak in the MALDI-MS spectrum does not represent a protein or a peptide but rather a posttranslationally modified protein (or peptide).45–47 However, even if the differences detected are not at the “naked” protein level, the differences observed may still be detected and the proteins responsible for them can be identified. For example, in a very recent study, Champion et al. 48 investigated secreted protein from intact biosafety level 2 pathogenic mycobacterial colonies using a modified version of whole-colony MALDI–time-of-flight (TOF)–MS. In their studies, they spotted onto a 384-well Gold MALDI target 1 µL of filtrates of Mycobacterium marinum and analyzed the spots by MALDI-TOF. They identified ESAT-6 and CFP-10, which are two major substrates of ESX-1 (type VII secretion). 48
Bottom-Up Secretomics
In bottom-up secretomics, the secretome from two (or more) different conditions is digested by an enzyme (e.g., trypsin) and then analyzed by LC-MS/MS.4,5,8,16,17,19 The differences between two different secretomes are identified either before (e.g., in SDS-PAGE or 2D SDS-PAGE) or after protein digestion (e.g., in LC-MS/MS or during data processing and/or analysis). Since the posttranslationally modified proteins are digested into many peptides, parts of these proteins that are not modified can be analyzed by LC-MS/MS and the sequence of the peptides determined and, implicitly, the protein identified and then quantified. Although this method is much better, more sensitive, and perhaps more reliable providing sequence information, there are also drawbacks associated with this method: Some proteins truncate and/or degrade, and when analyzed, this information is not taken into consideration.45–47,49 As such, if a quantitation is performed, there is a high chance that the quantitation will produce false-positive or not very accurate results.50–54 To compensate for that, one may have to consider the use of more than two or even three peptides for quantitation purposes.
High-Throughput Methods for Analyzing Secretomes
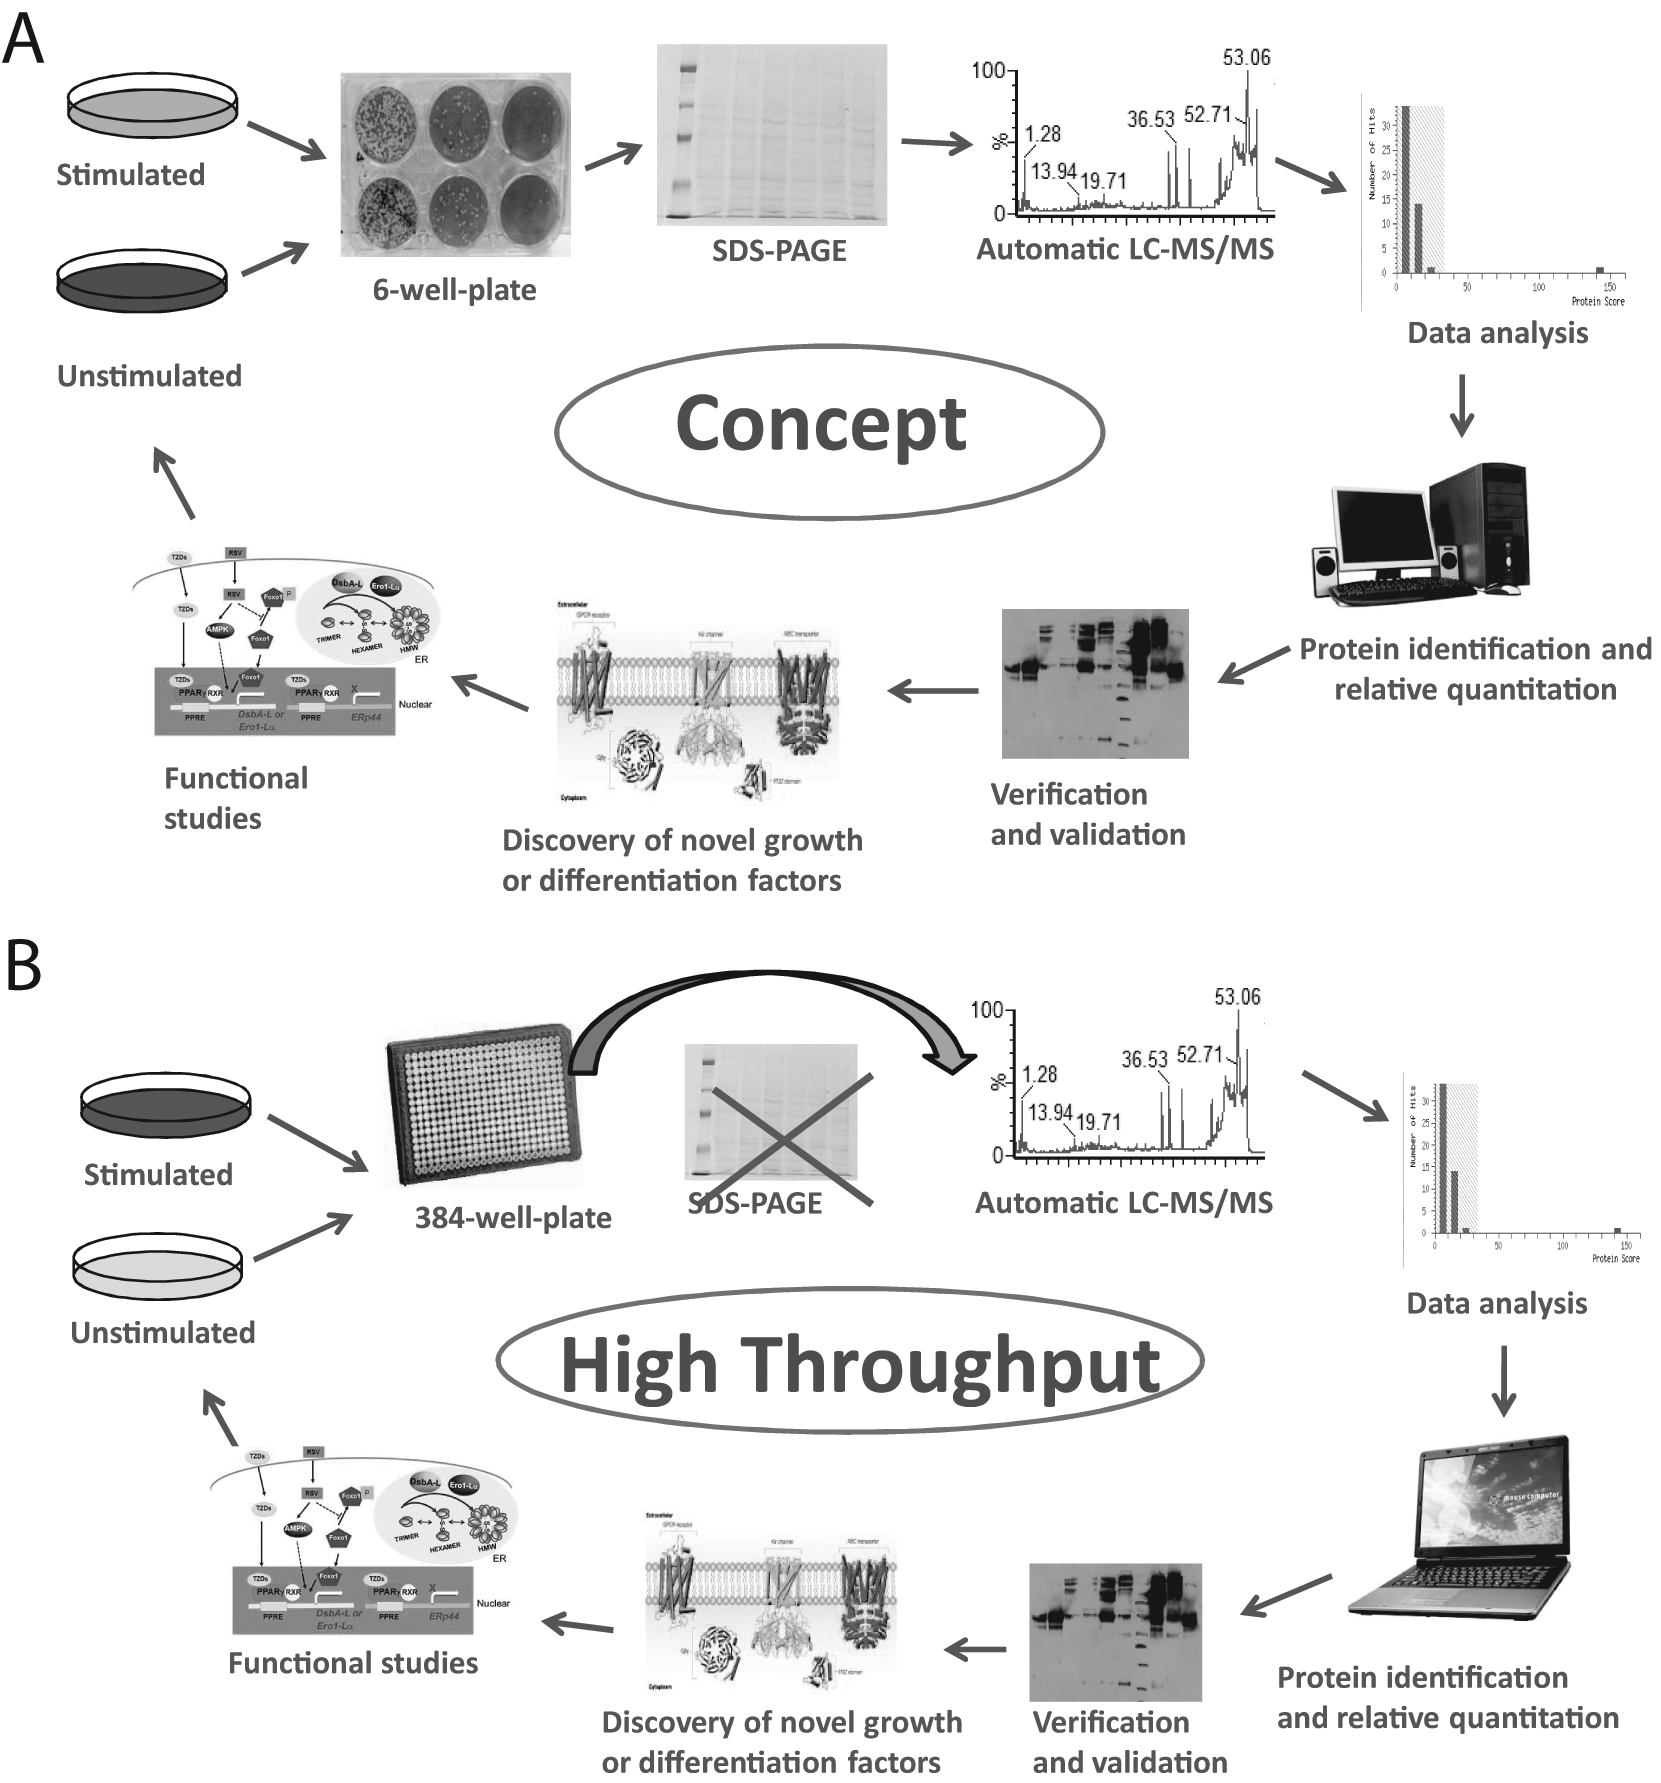
The high-throughput methods that we proposed are based on the use of bottom-up LC-MS/MS, but in principle, they can be adapted for top-down MALDI-MS or even bottom-up MALDI-MS, as well.48,55,56 The principles of the concept and high-throughput methods are shown in Figure 1 . In general, cells grown under identical or similar conditions differ by only one parameter such as (growth factor) unstimulated and stimulated or cells grown with serum-containing medium or with serum-deprived medium. Therefore, the two cell populations will produce two different secretomes. As such, the differences between the secretomes can be identified. Once the secretomes have been harvested, they are analyzed by SDS-PAGE. This is the first step in the identification of differences between the two different secretomes. The complete secretomes or only partial, targeted secretomes (identified by SDS-PAGE) are then digested by trypsin and analyzed by LC-MS/MS. As an alternative, the secretomes may be directly digested in solution and then analyzed by LC-MS/MS, bypassing the SDS-PAGE step. Inclusion of known amounts of a digested protein or a peptide in digested secretomes will allow one to do (in addition to protein identification) protein quantification.57,58 Once the LC-MS/MS is performed, data analysis follows, which leads to identification and quantitation of the proteins from the secretomes. These proteins are then verified using the LC-MS/MS raw data to confirm the correct sequence of the peptides identified, and then the data are validated, usually by Western blotting (WB), using antibodies against the proteins of interest. If the verification and validation are successful, one may start functional studies, which leads to identification/discovery of novel proteins/factors or known proteins/factors with novel function.9,59 Once completed, the process can start again. The concept methodology is summarized in Figure 1A . High throughput of the concept methodology can be achieved through an increase of the number of secretomes that can be collected at one particular time point. However, the SDS-PAGE step has to be bypassed and the digestion has to be performed only in solution ( Fig. 1B ). In an alternate method for high throughput, the secretomes (e.g., from 384-well plates) are directly co-crystallized with a matrix on a MALDI target plate and analyzed by MALDI-MS, which allows rapid screening and identification of the differences between these 384 secretomes. The general principle for automatic analysis of multiple secretomes is shown in Figure 2A . This method can be used to analyze secretomes in both low and high molecular mass range ( Fig. 2B ).
Principle of analysis of the secretome by liquid chromatography–tandem mass spectrometry (LC-MS/MS). (
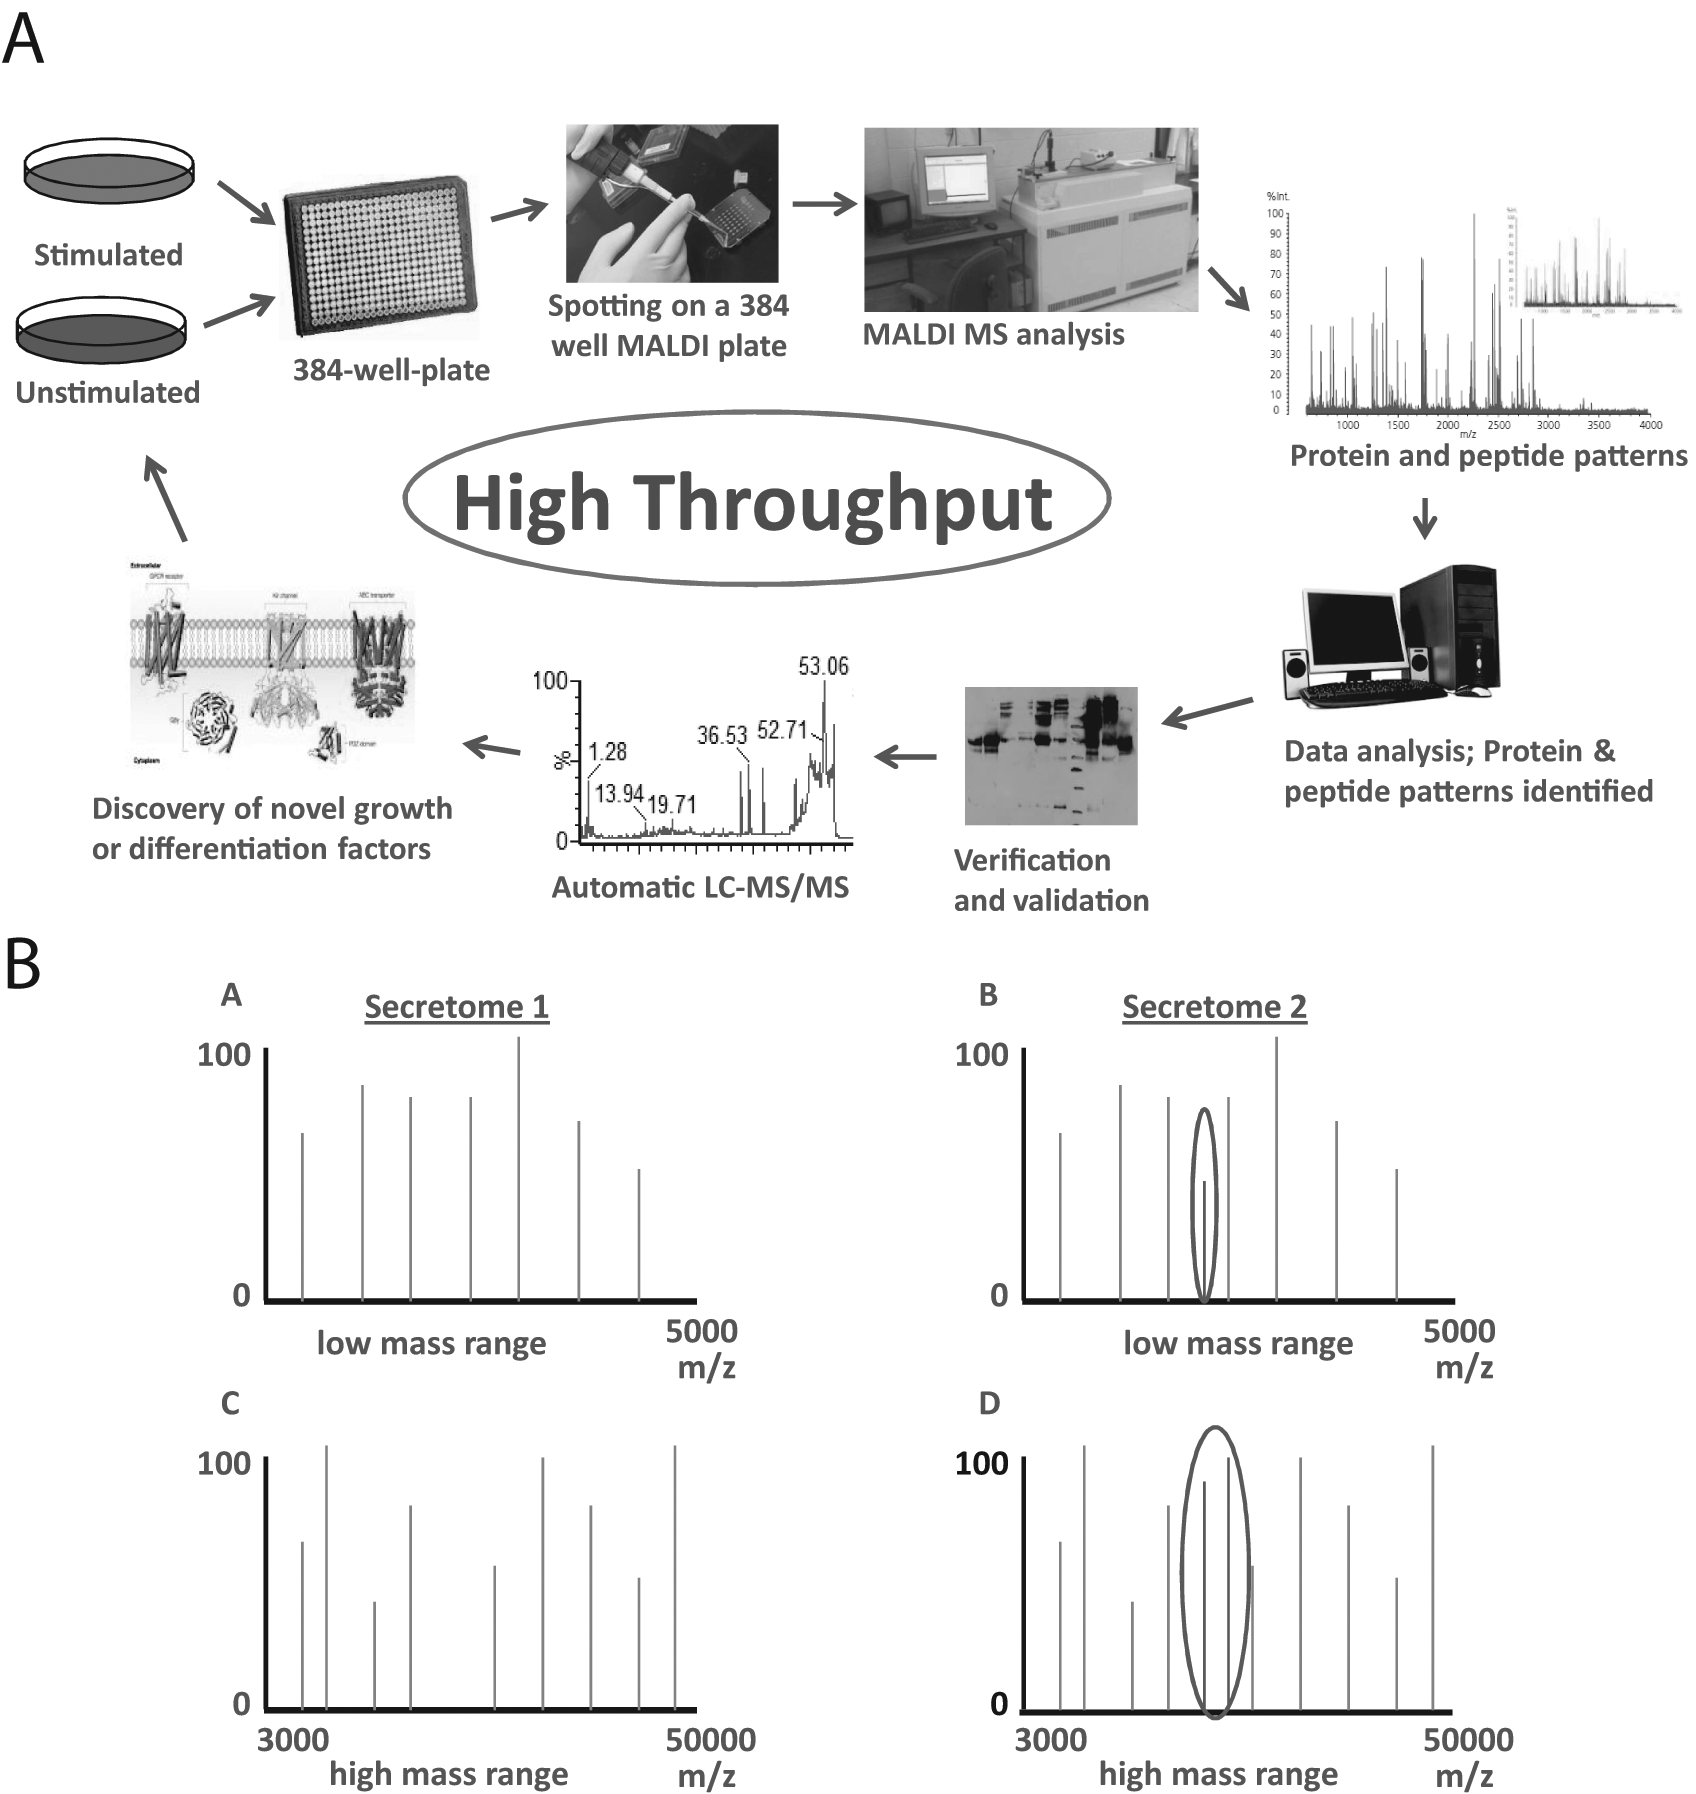
Principle of analysis of the secretome by matrix-assisted laser desorption ionization–mass spectrometry (MALDI-MS). (
Examples of Secretome Analysis
The secretomes represent the set of all proteins secreted by various cells. Recently, research on the secretomes has risen due to early reports that this entity can be very useful as a source of biomarkers besides hitherto commonly used bodily fluids such as blood, plasma, or saliva. There are many ways of characterizing secretomes, depending on the biological question that is asked and on the final goal that the researcher wants to achieve.1,2,17,22,31–33,41,60 Mostly, the main approach consists of conditioning cell cultures for 1 to 2 days that were stimulated or not, then collecting (and if necessary concentrating) the supernatant followed by fractionation and subsequent identification of secreted proteins by MS.12,13 In another approach, body fluids are considered instead of conditioned medium. The first approach was applied by Stastna and Van Eyk12,13 to identify secreted proteins that could be potential biomarker candidates in cardiovascular diseases. This approach also was employed for secretome profiling of mesenchymal, adipose, neural, and embryonic stem cells as well as primary isolates of astrocytes, endothelial cells, and muscle cells in the search for proteins involved in cell survival, proliferation, differentiation, or inflammatory response. 11 Although the focus of secretome research lately has been primarily to implement the method or strategy in place, less attention has been given to the development of the functional assay to validate the identified targets in the cell culture system. Moreover, important parameters such as protein concentration, function, and interaction studies are valuable in determining the roles of target proteins in physiological and pathological conditions. As for protein concentration, much has been done already in this area with the development of labeling approaches (stable isotope labeling by amino acids in cell culture or SILAC53,61–63), proteolytic labeling with O18 s, 64 isotope-coded affinity tags (ICAT), 65 and isobaric tags for relative and absolute quantification (iTRAQ) 66 and label-free methods (ion intensity, spectral counting). We will show two examples of the investigation of secretomes: in the first example, an external molecule stimulates an effect on the cells, producing a particular set of proteins in the secretome, whereas in a different case, one tries to identify a factor that is secreted by the cells of interest and a biological function that can be monitored.
Application 1: Identification of the Changes within the Secretome upon Stimulation of Cells to Differentiate in Cell Culture
Although in the previous example, we described the strategy for identifying a factor that can be monitored using a biological function/effect, a different example demonstrates how the secretome can be analyzed blindly, without any means for monitoring any function ( Fig. 3 ). In this case, we use a factor/protein, tumor differentiation factor (TDF), to produce an effect on cells that will be reflected in the content of the secreted proteins.52,54,67–69 Therefore, this analysis focuses on investigating the differences in the protein content of the two secretomes and identifying the proteins that may be different in each secretome. These differences usually reflect the intracellular pathways and the metabolic state of a particular set of cells, without a specific focus on directly identifying one protein. Although these two approaches are totally different, each one can provide valuable information that can be used to understand the biology of a specific reaction or set of reactions for that particular cell type.
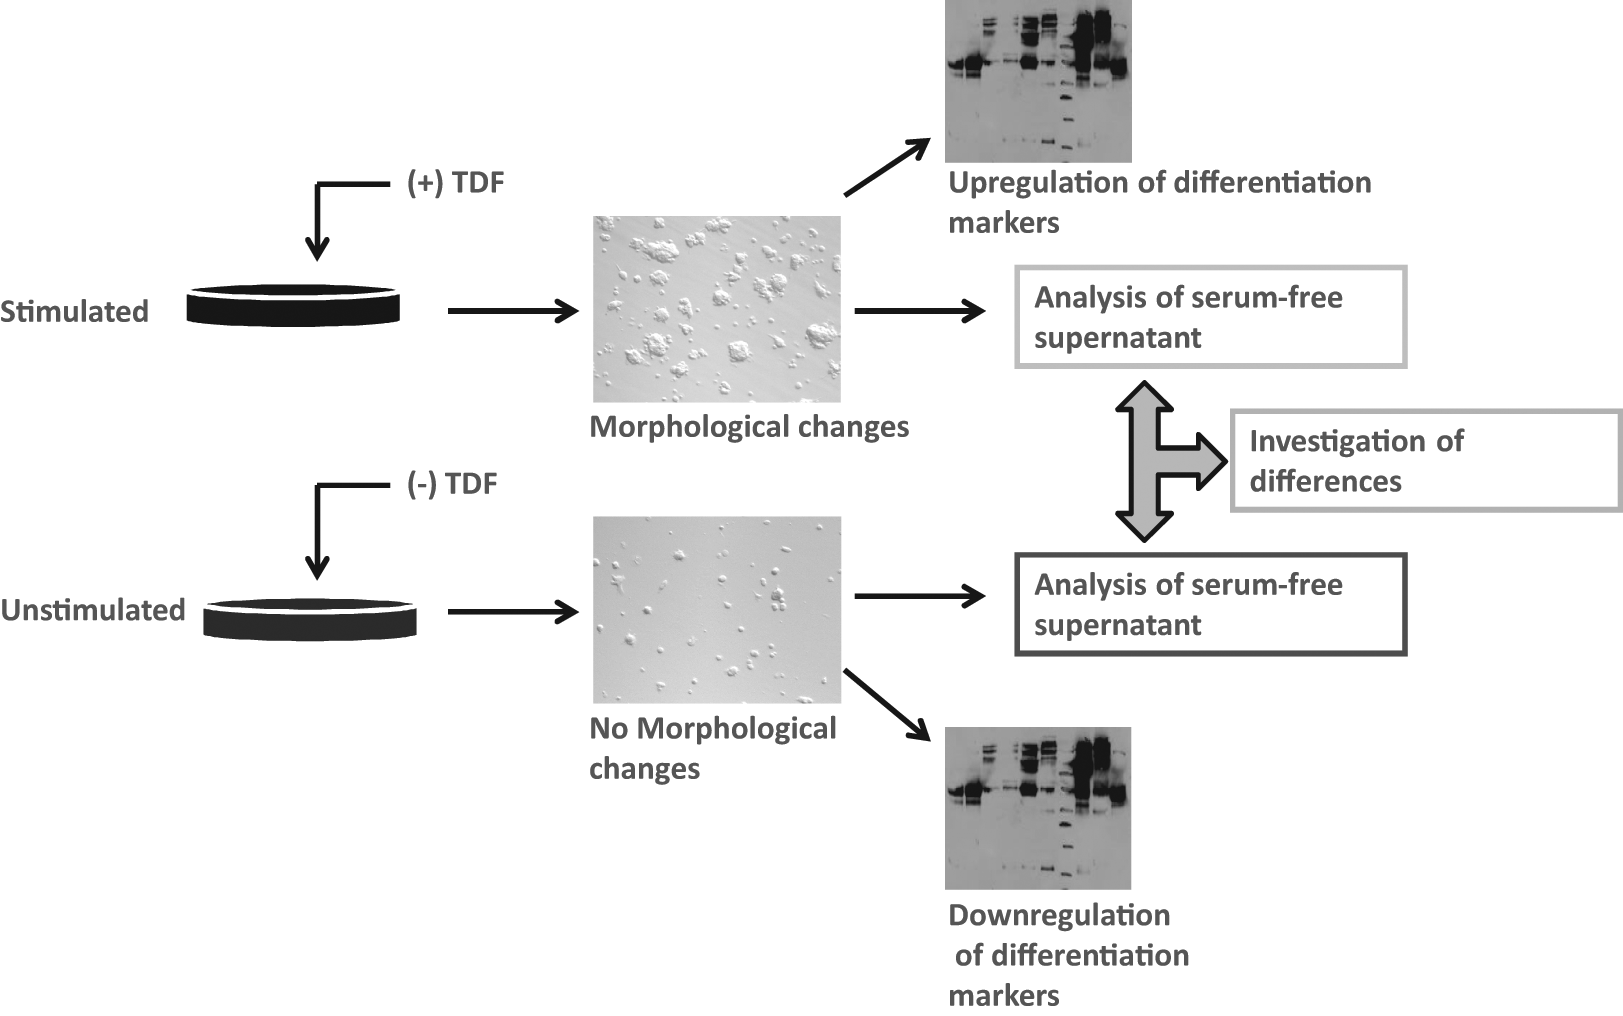
Principle of investigating a secretome upon stimulation with an external factor (e.g., tumor differentiation factor [TDF]). In this case, there is no search for identifying any factor with biological activity, but rather identifying the differences between the two secretomes, which in turn reflect the state of the cell, which indirectly reflects the function of TDF.
Application 2: Identification of a Growth/Proliferation Factor within the Secretome of Cells Grown in Cell Culture
Using the first application, cells produce and secrete a stimulatory factor that induces the growth of cells at a particular density ( Fig. 4 ). However, if the cell density is not high enough, the stimulatory factor is not produced and secreted in sufficient amounts, and its stimulatory activity has no effect on cells. This is perhaps a classical example of an experimental setup in which one searches for an unknown factor with stimulatory activity that can be monitored by the presence of its activity (e.g., counting the cells treated with the stimulatory factor over time). In addition, cell proliferation can also be monitored. For this application, a proteomic investigation of the full secretome can lead to investigation of all secreted proteins. Fractionation of the secretome by biochemical approaches such as ion exchange or size exclusion chromatography will narrow down the number of proteins that are potentially responsible for the stimulatory activity. Once identified, the protein responsible for the stimulatory activity can be overexpressed and spiked in the fresh cell medium and further tested for its stimulatory activity. Of course, posttranslational modifications within proteins (e.g., only the phosphorylated or glycosylated protein is responsible for the stimulatory activity) and/or interaction of these proteins with other proteins (e.g., a protein complex responsible for the stimulatory activity) also have to be taken into account. Once the protein responsible for the stimulatory activity is identified, verified, and validated, then the gain and loss of function for that factor (using a knock-in and knock-out, respectively) can be investigated. Finally, specific inhibitors for that protein can be designed and tested.
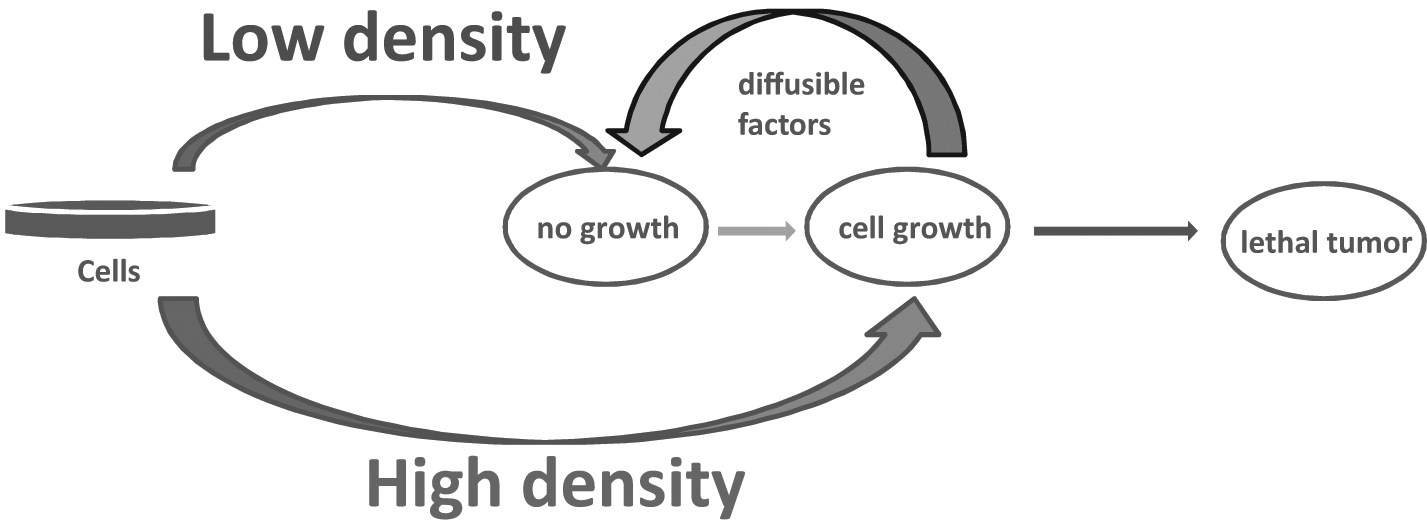
Principle of investigating a secretome for identification of a factor with biological activity (induction of cell growth).
Problems and Challenges Encountered in Analyzing Secretomes
Many problems can be encountered during the analysis of secretomes, as well with the automation of this analysis. The first and the most important consideration is whether the full identification and characterization of a secretome has been achieved. Secreted proteins suffer intense posttranslational modifications that could heavily influence the final outcome of the proteomic analysis of these secretomes. For example, secreted proteins are glycosylated through both N- and O-glycosidic bonds, and if the peptide backbone is occupied by oligosaccharides, then most likely they will not be identified in a proteomic analysis.40,45–47,70–72 As such, if the glycosylated protein has a low molecular mass, then the chance of being identified decreases. Therefore, the immediate consequence is false-negative data. The protein is in the sample, but it is not identified. Another example is identification of a truncated protein and its further investigation without knowledge that the protein is truncated. Physiological truncation of proteins, especially at the C-terminus, is common in secreted proteins. For example, all proteins that contain a zona pellucida domain, such as zona pellucida proteins, uromodulins, vitelline envelope proteins, and endoglins, are processed and activated through truncation of the C-terminal amino acid sequence.72–76 As such, the investigator deals with a truncated protein but believes that it is a full-length protein. Therefore, the immediate consequence is false-positive data. The opposite, using the same example, can also be possible: One may identify a truncated protein, which results in sample collection and is mostly due to the sample storage, with no physiological significance. In this case, the researcher identifies a truncated protein and believes that it may have biological significance, but in reality he or she deals with an intact, regular protein. Having these examples described, a different question arises: How can one do label-free, relative protein quantitation? This is hard to define, simply because many factors really depend on the amino acid sequence of proteins. For example, if a protein is partially phosphorylated and both peptide species (unphosphorylated and phosphorylated peptides) coexist in a sample, then it is a matter of which peptide population is being analyzed and quantified.50–52,54,77 Therefore, one may analyze an unphosphorylated peptide, ignoring the phosphorylated one. However, since many modifications can be predicted by analyzing the amino acid sequence of a protein (e.g., glycosylation, acetylation, or myristoylation), it is difficult to look into the amino acid sequence of all proteins that are identified in a proteomic experiment. Perhaps the most insidious peptides are the ones that are unseen or that are not identified by the database search engine. 78 For example, alkylation by iodoacetamide has historically been considered to be specific for cysteine. However, as a few groups have demonstrated, alkylation at amino acids other than cysteine is more common than previously expected and many times more specific to the N-terminal amino acid. Dialkylation is also not uncommon. 78 Therefore, not considering alkylation at an amino acid other than cysteine will produce an inaccurate quantitation. The two most described label-free methods are based on the comparison of two or more experiments by either comparing the direct mass spectrometric signal intensity for any given peptide (ion intensity) or looking at the amount of recorded spectra corresponding to a specific peptide/protein (spectral counting). 79 Above-mentioned labeling methods can also be used for absolute quantification, which is very important in the case of clinical samples, where not only relative amounts are of interest but also the absolute concentration of the proteins of interest. 80 A major point to consider about label-free methods is the equal treatment of all samples to be quantified during sample processing. However, the use of spiked internal standards can help correct sample processing errors. It has been found that spectral counting is less accurate, as shown by estimates of protein ratios, than peak intensity measurements. 81 Another factor to consider when deciding which one of the two label-free methods to choose is the fact that for spectral counting, particular statistical tools are needed to calculate the extent and probability/significance for differential protein expression. 82 Luckily, label-free quantitation requires at least two peptides for reliable results, but if one has the option and capability to include the naked, unmodified peptide, the modified (and identified by a Mascot database search) peptide and the modified (and not identified by a Mascot database search) peptide, then this gives a comprehensive, reliable quantitation.
A different set of challenges directly related to the sample preparation lies within the source and composition of the sample. A concentrated sample such as serum or plasma would be the best choice, if abundant proteins can be easily removed and there are available kits/columns that allow us to perform automation. Similarly, analyzing a secretome from a cell population grown in culture may be challenging from many standpoints. For example, when cells are grown in cell culture, the medium generally contains fetal bovine or calf serum. The serum protein content is much larger than the secretome and makes proteomic analysis difficult.
A different option is to replace the serum-containing medium with serum-free medium 24 hours prior to collecting the secretome. Another alternative is to use protein-free medium such as Cellgro (Corning life Sciences, Corning, NY), which allows cells to produce a stress-free secretome, as compared with serum-free medium, in which cells are a little bit stressed because they do not have sufficient nutrients in the medium.
Another point to consider is the concentration of the proteins in the secretome and the types of abundant proteins present in the medium. For example, QBSF medium (Quality Biological, Inc., Gaithersburg, MD) contains bovine serum albumin and transferrin. Although albumin is easy to remove directly from the unprocessed proteome by affinity chromatography, transferrin cannot be easily removed, and the secretome must be first concentrated and then the transferrin removed. Even so, transferrin removal by immunoaffinity chromatography is expensive and still not very successful (unpublished observations). An example of secretome separated by SDS-PAGE is shown in Figure 5 . Here, the highest intensity band in the secretome is actually albumin, whereas the second one is transferrin. As observed, after albumin depletion and concentration (about 50 times concentration), the transferrin band becomes dominant in the gel. In addition, if in the unconcentrated secretome, there are not many visible bands in the gel lane; many bands (and also additional bands) can be easily observed in the depleted and concentrated samples that can be analyzed by LC-MS/MS. However, there has been significant progress in expanding the detection range of secreted proteins, which can be as low as ng/mL concentrations. Still, the goal is to bring the detection limit of secretomes analysis from conditioned media by conventional proteomics methods close to those of antibody-based methods, which are in the range of pg/mL. 11
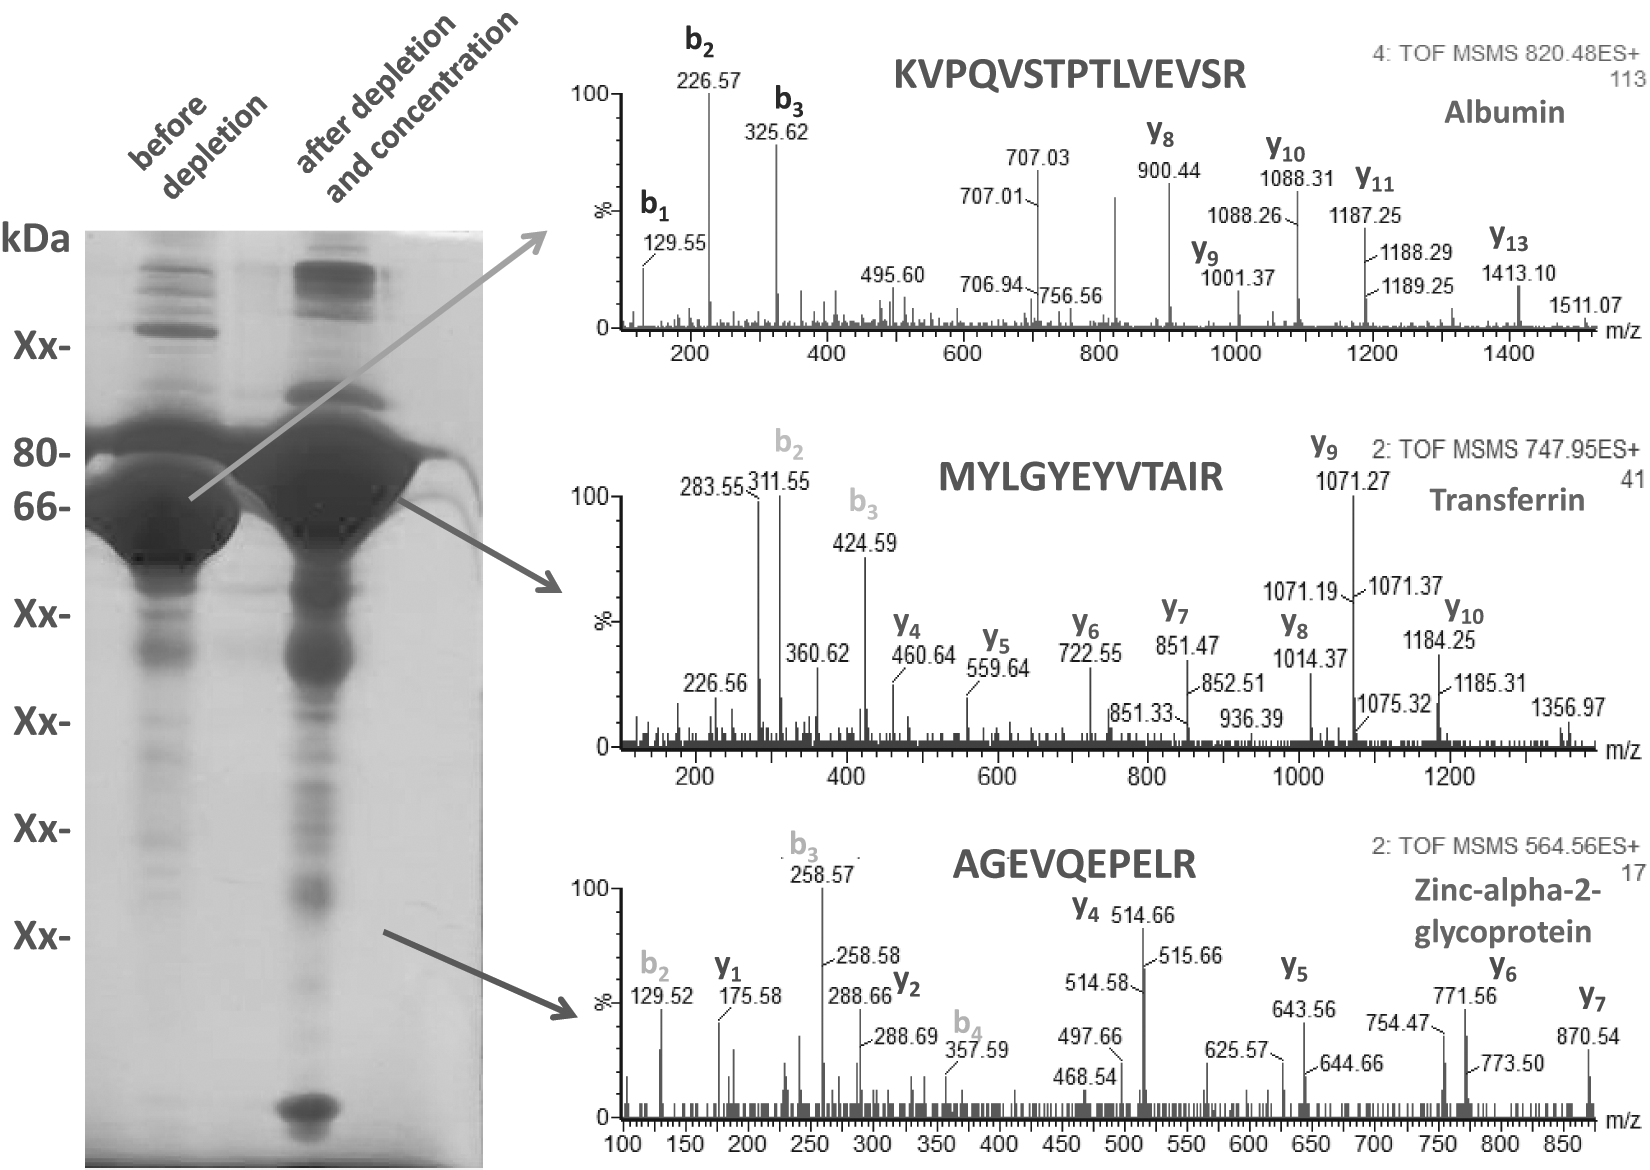
Analysis by sodium dodecyl sulfate–polyacrylamide gel electrophoresis (SDS-PAGE) and liquid chromatography–tandem mass spectrometry (LC-MS/MS) of a secretome that was depleted from albumin and then concentrated. Left lane: undepleted, unconcentrated sample. Right lane: sample depleted form albumin and concentrated 40 times. Transferrin, a not very abundant protein before depletion and concentration, is now the most abundant protein in this sample. Successful characterization of the secretome depends on the successful removal of the abundant proteins such as albumin and transferrin. To identify the proteins from the secretome, the gel bands were excised and digested and analyzed by LC-MS/MS, followed by database search. Examples of MS and MS/MS that correspond to peptides that were part of albumin, transferrin, and zinc-α-2-glycoprotein, as well as the position of these proteins in the gel, are indicated. Analysis of the b and y ions from the MS/MS led to identification of the peptides with the amino acid sequence indicated in each MS/MS spectrum, which are also part of the protein indicated.
In conclusion, we have reviewed some of the approaches that can be used to investigate secretomes, and we have provided examples of two totally different types of secretomes analyses. We also have focused on the qualitative and quantitative analysis of the secretome, with particular focus on the problems and pitfalls that one can have when analyzing secretomes by MS.
Footnotes
Acknowledgements
C.C.D. thanks Ms. Laura Mulderig and her colleagues (Waters Corporation, Milford, MA) for their generous support in setting up the Proteomics Center within the Biochemistry & Proteomics Group at Clarkson University and to Dr. Thomas A. Neubert for the TofSpec2E MALDI-TOF mass spectrometer.
Declaration of Conflicting Interests
The authors declared no potential conflicts of interest with respect to the research, authorship, and/or publication of this article.
Funding
The authors disclosed receipt of the following financial support for the research, authorship, and/or publication of this article: This work was supported in part by Clarkson University (start-up to C.C.D.), the Army Research Office through the Defense University Research Instrumentation Program (DURIP grant #W911NF-11-1-0304 to C.C.D.) and Keep A Breast Foundation (KEABF-375-35054).