
Abstract
Since the function of the spinal cord depends on the proteins found there, better defing the normal Spinal Cord Proteome is an important and challenging task. Although brain and cerebrospinal fluid samples from patients with different central nervous system (CNS) disorders have been studied, a thorough examination of specific spinal cord proteins and the changes induced by injury or associated to conditions such as neurodegeneration, spasticity and neuropathies has yet to be performed. In the present study, we aimed to describe total protein content in the spinal cord of healthy rats, employing different proteomics tools. Accordingly, we have developed a fast, easy, and reproducible sequential protocol for protein extraction from rat spinal cords. We employed conventional two dimensional electrophoresis (2DE) in different pH ranges (eg. 4–7, 3–11 NL) combined with identification by mass spectrometry (MALDI-TOF/TOF), as well as first dimension protein separation combined with Liquid Chromatography Mass Spectrometry/Mass Spectrometry (LC-MS/MS) to maximise the benefits of this technology. The value of these techniques is demonstrated here by the identification of several proteins known to be associated with neuroglial structures, neurotransmission, cell survival and nerve growth in the central nervous system. Furthermore this study identified many spinal proteins that have not previously been described in the literature and which may play an important role as either sensitive biomarkers of dysfunction or of recovery after Spinal Cord Injury.
Keywords
Introduction
Spinal cord injury (SCI) has a significant disabling and lifelong effect on many people and as such, it represents a major challenge for successful health care management. SCI is a devastating neurotrauma insult that can lead to the loss of sensory and motor function below the level of injury.1,2 The progressive pathological changes initiated by SCI include complex and evolving molecular cascades whose interrelationships are not fully understood, and many molecules involved in these processes remain to be discovered.3–7 To date, brain and cerebrospinal fluid samples from patients with different central nervous system (CNS) disorders have been studied extensively using different biochemical assays.8–12 However, relatively few studies have focused on spinal cord protein content, and the changes induced after spinal neurotrama or in association with symptoms such as spasticity or neuropathic pain. Indeed, recent studies have been conducted to screen for a wide range of proteins following SCI using comparative proteomic technologies.13–17
The tremendous advances in molecular biology, mainly in the field of genomics and proteomics, open the possibility to understand the mechanisms underlying many neuropathologies. After genomics, proteomics is often considered the next logical step to study biological systems, with the added capacity to describe the spatiotemporal differences in protein expression, both in normal and pathological tissue.18–20 The proteome represents all the proteins expressed by a genome, cell, tissue or organism at a given time under defined physiological conditions. Since most physiological body functions reflect the integrity of their proteins, understanding the complex biological processes active in the spinal cord during pathological conditions like SCI requires the key proteins involved at an early stage of the neurotrauma21,22 (acute phase) and during injury progression to be identified.
Proteomic analysis is now a key biomedical tool to establish protein maps that can assist in biomarker discovery and in the identification of therapeutic targets. In this respect, an important and challenging task is to develop protocols designed to extend our knowledge of the spinal cord (SC) protein profile that combine mass spectrometry with two dimensional gels (2-DE). Until now most studies have focussed on one protein or on a small number of proteins using standard techniques such as Western blotting, immunohistochemistry or RT-PCR, which fail to provide complete information regarding the general physiological state of the SC. In contrast, proteomic analysis is useful as multiple molecules can be assayed simultaneously using separation techniques combined with the powerful new mass spectrometry technologies, such as MALDI-TOF/TOF (Matrix Assisted Laser Desorption Ionization-Time of Flight/Time of Flight Mass Spectrometry), SELDI-TOF (Surface Enhanced Laser Desorption Ionization Time Of Flight Mass Spectrometry), Protein Arrays, LCM (Laser Capture Microdissection), MS-Imaging, LC-MS (Liquid Chromatography Mass Spectrometry), TOF-SIMS (Time of Flight Secondary Ion Mass Spectrometry).23–29
However, the development of global protein analysis using proteomic technologies needs to address several limitations and challenges. An important tool applied to study the proteome is 2-DE, whereby proteins are first separated by isoelectric focusing (IEF) and then based on their molecular weight by SDS-PAGE (sodium dodecyl sulphate polyacrylamide gel electrophoresis).30–32 However, this technique presents some important limitations that could be resolved by the application of other proteomics tools such as LC-MS/MS. 33 In addition, there is a need to develop efficient protocols to extract most of the proteins present in the spinal cord, given the limitations of each technique and the complexity of the proteome.
In this technical report, we present a fast, easy and reproducible protocol to extract SC proteins and analyze its proteome (Fig. 1). The aim of this study is to describe the majority of the proteins extracted from the rat SC proteome by employing conventional 2-DE spot maps over different pH ranges and MALDI-TOF/TOF for their identification, in combination with LC-MS/MS to maximise the utility of this technology. The application of this newly developed optimal protein extraction protocol compatible with 2-DE and LC-MS/MS will permit future translational studies to identify the main pathophysiological mechanisms associated with SCI.
The proteomic platforms used in this study and a flowchart demonstrating the strategy for the rat spinal cord analysis. Schematic illustration of the proteomics methods used to characterise the rat spinal cord proteome.
Materials and Methods
Collection of Rat Spinal Cords
Thoracico-lumbar spinal cord tissue was obtained from 12 week old male adult Wistar rats (n = 6: Harlan SA, Milano, Italy) weighing between 300–400 g sacrificed with an intraperitoneal overdose of Sodium Pentobarbital (Dolethal, Norman SA). Shortly afterwards, the spinal cord tissue was extracted using hydraulic pressure applied to the caudal vertebral canal, whereupon the tissue was cleaned with a saline solution (0.9%). The thoracico-lumbar segments were carefully dissected out and then frozen and stored at –20 °C until analyses.
Rat Spinal Cord Processing: Protein Extraction
After removal from –20 °C storage, the tissue was maintained at 4 °C in PBS solution and all the following steps in the protocol were performed at 4 °C (Fig. 2).
The protocol to extract proteins from the rat spinal cord. A) After surgery the spinal cord tissue was washed in saline buffer to eliminate blood contaminants and tissue was homogenized (Buffer 1) and later a new extraction of proteins was realized using buffer 2. Supernatant A, containing most of the soluble proteins and supernatant B, containing membrane and hydrophobic proteins were analysed separately in 2-DE in order to check the efficiency of the protein extraction protocol. B) Supernatant A and B were mixed and analysed by 2-DE.
Firstly, the tissue was washed 3 times in PBS to remove blood contaminants and it was then ground into a powder with a mortar in Liquid Nitrogen. This powder (0.3 g) was resuspended in 300 μL of protein extraction buffer 1 (Tris 10 mM [pH 7.5], 500 mM NaCl 0.1%, Triton x-100, 1% β-mercaptoethanol and 1 mM PMSF). 34 The homogenate was sonicated for 5 minutes and centrifuged at 21,000 g (5840 R Eppendorf) for 15 minutes at 4 °C to precipitate the membrane and tissue debris. The supernatant (supernatant A), containing most of the soluble proteins was collected and stored at 4 °C. The pellet was then dissolved in a buffer containing 7 M Urea, 2 M Thiourea, 5% CHAPS,35,36 and it was again centrifuged at 21,000g to obtain a second supernatant separated from the pellet of tissue debris (Supernatant B), mainly composed of membrane proteins. The tissue debris was then resuspended in protein loading buffer (Tris 0.5 M [pH 8.0], SDS 10%, Glycerol, β-mercaptoethanol and bromophenol blue 0.02%) and the protein concentration was determined by the Bradford-Lowry method using the Bio-Rad protein assay commercial Kit. 37 Finally, the protein composition was analyzed by resolving 25 μg of total protein content from each sample by SDS-PAGE 12% (Acrylamide/Bisacrylamide 30%/0.8% v/v).
Two-Dimensional Electrophoresis (2-DE)
All chemicals and instruments used for 2-DE gels have been described previously.35,36 Both the soluble and hydrophobic protein extracts were mixed and dialysed against 2 mM Tris buffer using Mini dialysis Kit 1 kDa cut-off (GE Healthcare). Subsequently, 300 μg of each protein extract was cleaned with the 2 D Clean up Kit (GE-Healthcare) and resuspended in rehydration buffer (7 M Urea, 2 M Thiourea, 4% CHAPS, 1%–2% Ampholites and 1% TBP: Bio-Rad). Isoelectric focusing (IEF) was performed in an IPGphor unit (GE Healthcare). The strips (17 cm and pH 4–7: Bio-Rad, or 24 cm pH 3–11 NL–-non-lineal: GE Healthcare) were actively rehydrated at 20 °C for 12 h at 50 V to enhance protein uptake, and the voltage was then increased according to the following program: 500 V for 30 minutes, 1000 V for 1 h, 1000–2000 V in 1 h (gradient), 2000–5000 V in 2 h (gradient), 5000–8000 V in 1 h (gradient), 8000 V to a total 88,000 V/h.
Subsequently, the strips IEF were equilibrated as described previously35,36 and the second dimension (SDS-PAGE) was run according to Laemmli's method, 38 using a Protean II system (Bio-Rad) at 1 W/gel at 20 °C overnight. Gels were fixed and stained by Silver Staining (GE Healthcare, according to the manufacturer's instructions) and they were then scanned with a GS-800 Calibrated Densitometer (Bio-Rad). Evaluation of the 2-DE gels was performed using PDQuest 2DE Gel Analysis Software version 8.0.1 (Bio-Rad). Reproducibility was tested comparing the variation within the different gels in the same group using the same software.
In Gel Digestion
Spots (200) were manually excised, automatically digested with “Ettan Digester” (GE Healthcare) and identified at the HNP Proteomic Unit according to Schevchenko et al 39 with minor modifications. 40 Gel plugs were reduced with 10 mM dithiothreitol (Sigma Aldrich) in 50 mM ammonium bicarbonate (99% purity; Scharlau) and by alkylation with 55 mM iodoacetamide (Sigma Aldrich) in 50 mM ammonium bicarbonate. The gel fragments were then rinsed with 50 mM ammonium bicarbonate in 50%. Methanol (gradient, HPLC grade, Scharlau) and acetonitrile (gradient, HPLC grade, Scharlau), and they were dried in a Speedvac. Modified porcine trypsin (sequencing grade; Promega, Madison, WI, USA) was added to the dry gel pieces at a final concentration of 20 ng/μl in 20 mM ammonium bicarbonate and the digestion proceeded at 37 °C overnight. Finally, 70% aqueous acetonitrile and 0.1% formic acid (99.5% purity; Sigma Aldrich) was added for peptide extraction.
Protein Identification by MALDI-TOF/TOF
An aliquot of each digestion was mixed with an aliquot of the matrix solution (3 mg/mL α-cyano-4-Hydroxycinnamic acid: Sigma Aldrich) in 30% ACN, 15% 2-propanol and 0.1% TFA. This mixture was pipetted directly onto the stainless steel sample plate of the mass spectrometer (384 Opti-TOF 123 × 81 mm MALDI: Applied Biosystem) and dried at room temperature.
The MALDI-MS/MS data were obtained in an automated analysis loop using a 4800 Plus MALDI TOF/TOF Analyzer (Applied Biosystems). Spectra were acquired in the reflector positive-ion mode with a Nd:YAG laser (355 nm wavelength at a frequency of 200 Hz), and between 100 and 2000 individual spectra were averaged. The experiments were acquired in a uniform mode with a fixed laser intensity. For the MS/MS 1 kV analysis mode, precursors were accelerated to 8 kV in source 1, and they were selected at a relative resolution of 350 (FWHM) with metastable suppression. Fragment ions generated by collision with air in a CID chamber were further accelerated at 15 kV in source 2. Mass data was analysed automatically with the 4000 Series Explorer Software version 3.5.3 (Applied Biosystems). Internal calibration of MALDI-TOF mass spectra was performed using two trypsin autolysis ions with m/z = 842.510 and m/z = 2211.105. For calibration in the MS/MS mode, the fragment ion spectra obtained from Glub-fibrinopeptide were used (4700 Cal Mix, Applied Biosystems). MALDI-MS and MS/MS data were combined through the GPS Explorer Software Version 3.6 to search a nonredundant protein database (Swissprot 56.7) using the Mascot software (version 2.2, Matrix Science), employing the following parameters: 50 ppm precursor tolerance; 0.6 Da MS/MS fragment tolerance; and allowing 1 missed cleavage, carbamidomethyl cysteines and methionine oxidation as a modification. The MALDI-MS/MS spectra and database search results were manually inspected in detail using the aforementioned software.
LC-MS/MS and Database Searching
Sample Preparation
Total spinal cord proteins (50 μg) were resolve by one dimensional (1-D) SDS-PAGE 12%. Each lane in the 1-D gel was divided into 24 gel slices that were manually excised and then digested automatically using the Ettan Digester (GE Healthcare). The digestion was performed according to Schevchenko et al 39 with minor modifications 40 and using Modified porcine trypsin (sequencing grade; Promega, Madison, WI, USA) diluted to a final concentration of 20 ng/μl in 20 mM ammonium bicarbonate. The gel slices were incubated with 10 mM dithiothreitol (Sigma Aldrich) in 50 mM ammonium bicarbonate (99% purity; Scharlau) for 30 minutes at 56 °C and after reduction, they were alkylated with 55 mM iodoacetamide (Sigma Aldrich) in 50 mM ammonium bicarbonate for 20 minutes at RT. Gel plugs were washed with 50 mM ammonium bicarbonate in 50% methanol (gradient, HPLC grade, Scharlau), rinsed in acetonitrile (gradient, HPLC grade, Scharlau) and dried in a Speedvac. Dry gel pieces were then embedded in sequencing grade modified porcine trypsin (20 ng/μL: Promega, Madison, WI, USA) and after digestion at 37 °C overnight, the peptides were extracted with 70% acetonitrile (ACN) in 0.1% formic acid (99.5% purity; Sigma Aldrich). Finally, the samples were dried in a speedvac and resuspended in 98% water with 0.1% formic acid (FA) and 2% ACN.
LC-MS/MS and Database Searching
The LC/MSMS system was comprised of a TEMPO nano LC system (Applied Biosystems) combined with a nano LC Autosampler. Each sample was injected in three replicates (3 μL) using mobile phase A (2% ACN/98% water, 0.1% FA) at a flow rate of 10 μL/minute for 10 minutes. Peptides were loaded onto a μ-Precolumn Cartridge (Acclaim Pep Map 100 C18, 5 μm, 100å; 300 μm i.d. × 5 mm, LC Packings) to preconcentrate and desalt samples. The RPLC was performed on a C18 column (Acclaim Pep Map 100 C18, 3 μm, 100å; NAN75-15-03-C18PM, 75 μm I.D. × 15 cm, LC Packings) using mobile phase A (2% ACN/98% water, 0.1% FA) and mobile phase B (98% ACN/2% water, 0.1% FA). Peptides were eluted at a flow rate of 300 nL/minute over the following gradient: initial conditions of 5% B that increased to 50% B over 70 minutes, 50 to 95% B for 1 minute and then 95% B for 3 minutes, returning to the initial conditions (5% B) over 2 minutes and maintaining these conditions for a further 14 minutes.
The LC-MS/MS analysis was performed on an AB/MDS Sciex 4000 Q TRAP System with NanoSprayII Source (Applied Biosystems). The TEMPO nano LC system and 4000 QTRAP were both controlled by Analyst Software v.1.4.2.
All the MS and MS/MS data were obtained in positive ion mode, with an ion spray voltage of 2800 V and a declustering of 85V. Nanoflow interface was heated at 150 °C, and the source gas 1 and curtain gas were set to 20 and 10, respectively. Nitrogen was applied as both curtain and collision gas. An Information Dependent Acquisition (IDA) method was programmed, with a full scan Enhanced MS (EMS) experiment at 4000 amu/s for ion profiling that was followed by an enhanced resolution (ER) MS experiment at 250 amu/s. The ER experiment permitted charge state recognition that was further submitted to IDA criteria to select precursor ions, and to estimate the collision energy to fragment them. These IDA criteria were set to select the 8 most intense double, triple or quadruple charged ions from 400–1200 m/z that exceed 100,000 counts for fragmentation in the LINAC collision cell. Isotopes within a 4.0 amu window and with a mass tolerance of 1,000,000 mmu were excluded. These 8 ions were submitted to 8 independent Enhanced Product Ion (EPI) MS/MS experiments at 4000 amu/s with Dynamic Fill Time (DFT). The total number of MS and MS/MS experiments per cycle was 10 (1 EMS, 1 ER and 8 EPI), resulting in a total cycle time of 5.0058 s.
Analyst software creates wiff format files including all the spectra data that were batch-processed with ProteinPilot™ Software 2.0.1 (Applied Biosystems/MDS Sciex). This software automatically generated peak lists that were searched against the Swissprot database version 56.7 using Paragon Algorithm (Applied Biosystems). Settings in the Paragon Algorithm included a detected protein threshold >1.0 (90%), Iodoacetamide was selected for Cys alkylation and Gel-based ID was selected as a special factor.
Results
Rat Spinal Cord Processing and Protein Extraction
To describe the complete proteome of an organ or tissue, it is necessary to establish an efficient extraction protocol to maximize protein recovery. Here, we present a flowchart to explain our approach to the proteomic study of rat SC (Fig. 1) and a schedule of the consecutive extraction protocol (Fig. 2). This method was based on two consecutive steps using two distinct extraction buffers, the first of which extracted the more soluble proteins, while the second was designed to dissolve the membrane and hydrophobic proteins that were assumed to be abundant in SC tissue.
Sample Preparation and Conventional 2-DE
In order to reduce the presence of lipids and other interfering substances, samples were sonicated, filtered with a micro spin-filter (SIGMA) and cleaned with the Clean-up Kit (GE Healthcare). We tested different pH ranges (pH 4–7; pH 3–11 NL) in order to select that which was optimal to detect the maximal number of spots with the greatest resolution. Spinal Cord protein extracts were quantified and approximately 300 μg was loaded onto each 2-DE gel. After analysis with the PD-Quest software (Bio-Rad), around 300 spots were detected by 2-DE in the 4–7 pH range (Fig. 3A). However, these gels did not present an homogeneous spot distribution due to the fact that most of them co-localized in the same area.
2-DE gel images. 2-DE was performed with IPG strips at different pH ranges: A) pH 4–7 (left) and B) pH 3–11 NL (right). C) 2-DE gel performed with 3–11 NL IPG strip and 9%–16% acrylamide/bisacrylamide.
For this reason, we performed 2-DE gels with 24 cm pH 3–11 NL IPG strips. We obtained a good distribution, definition and a large number of spots under these conditions, although some streaking in the 53–96 kDa molecular weight region could be due to the high concentration of these abundant proteins. This problem did not arise in the same region of the pH 4–7 2 D gels. Hence, the use of the two types of gels with complementary pH ranges (pH 4–7 and 3–11 NL) helped improve the overall spot resolution, as reported previously. 35
Thus, more than 1000 spots were detected after PD-Quest software analysis, improving the resolution and permitting the subsequent identification of the spots (Fig. 3B). Reproducibility was tested by comparing the variation within the different gels in the same group using the PD Quest 8.0 software. An analysis of 1126 spots revealed a coefficient of variation (CV) < 50% for 90.4% of the spots in same group of gels. Among these, a CV < 30% was obtained for 67.1% of the spots. These data confirmed the high reproducibility of the gels obtained with the method used.
Protein Identification (MALDI-TOF/TOF)
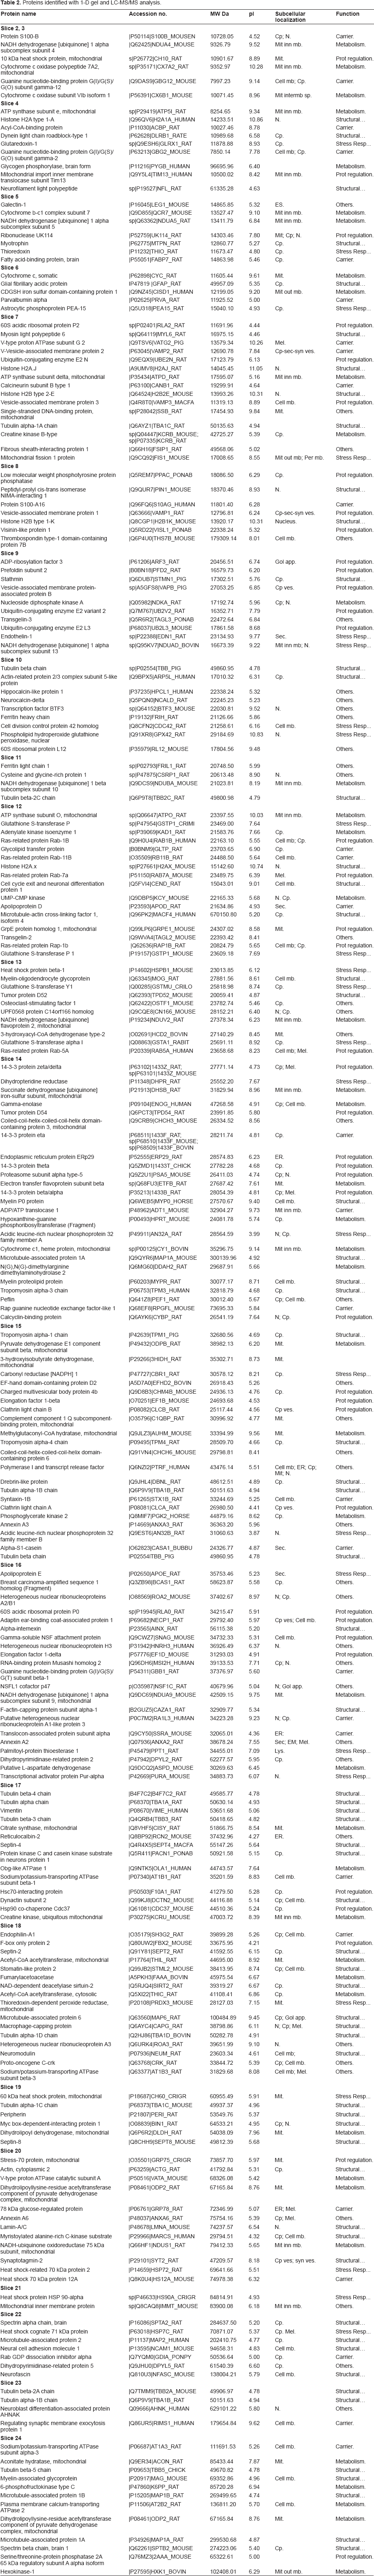
Spots identified with 2-DE gel (pH: 3–11 NL). The data indicates accession number, the isoelectric point (theoretical and experimental), molecular weight (theoretical and experimental), subcellular localization and recognised function.


Preparative 2-DE gel (700 μg). Spot Map of the proteins identified. The characterization of the spots identified is shown in Table 1.
Our data show the broad range of proteins identified by 2-DE from Macrophage migration inhibitory factor 12.5 kDa up to the Neurofilament heavy polypeptide with a molecular weight of 115.31 kDa. Furthermore we identified the Myelin basic protein, as the most basic protein (pI 11.25) and Calreticulin as the most acidic (pI 4.33).
Liquid-Chromatography Mass Spectrometry (LC-MS/MS)
To improve the number of proteins identified by MALDI, a LC-MS analysis was carried out. Total rat SC protein (50 μg) was resolved by SDS-PAGE and after Coomassie staining (PageBlue™ Protein Staining Solution, Fermentas), the gel was divided and cut into 24 pieces, each of which was subjected to in-gel tryptic digestion. After digestion, the peptide samples were analyzed by HPLC (TEMPO, Applied Biosystem) and the peptides eluted were analyzed on a Q-TRAP ion trap MS workstation (Applied Biosystem).
Proteins identified with 1-D gel and LC-MS/MS analysis.
Characterization and Classification of the Proteins Identified
The proteins identified by MALDI-TOF/TOF and LC-MS/MS were characterized according to their molecular weight (MW), isoelectric point (pI), subcellular localization and recognized function. In total 367 unique proteins were identified with the different techniques employed. On the basis of Swiss-Prot and NCBI database information, the proteins were classified into six functional groups (Fig. 5A): Structural and Cell Cycle Proteins; Metabolic Proteins; Stress Response, Redox State and Apoptosis Proteins; Regulation proteins; Carriers and Other proteins. The different types of protein functions assigned to the proteins identified and the relative proportion of each group were represented (Fig. 5A represents), and a graph of the distribution of pI's and cellular localization was generated (Fig. 5B). In addition, similar graphs were generated to represent the same features of those proteins recognized to be active in the nervous system.
Characterization of the spinal cord proteins identified. A) The functional grouping of all the proteins identified using 2-DE and MALDI-TOF/TOF together with LC-MS/MS are presented. B) Isoelectric point distribution and subcellular localization of the proteins identified. C) Additional classification of the proteins with recognized function in spinal cord.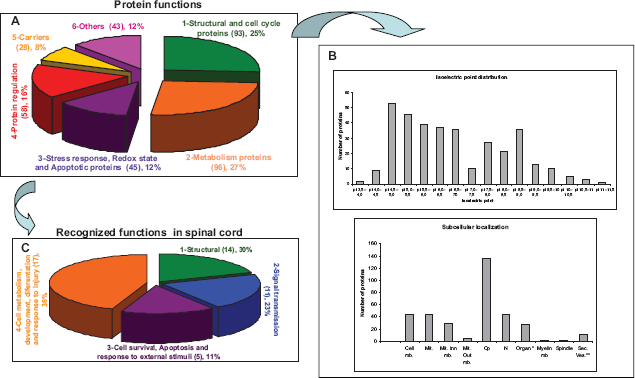
Discussion
To understand the complex biological processes at play in the central nervous system the key proteins involved must be identified. The exploration of the proteome has attracted increasing interest in recent years, particularly to establish reference maps designed to assist in biomarker discovery. In this regard, defining the complete spinal cord proteome is still an important challenge. This proteome may represent a fundamental key to better understand normal spinal cord physiology, as well as providing important clues to discover the molecular basis of neurodegeneration after spinal cord injury.
In the present study, we have described the proteins present in the rat spinal cord by employing different proteomic tools. Accordingly, we have defined a fast, easy and reproducible protein extraction protocol for the spinal cord. Efficient protein extraction is an essential step in proteomic studies, and the development of this specific sequential extraction augmented the number of proteins isolated, focusing mainly on membrane and hydrophobic proteins. As expected, we identified many mitochondrial and membrane proteins, as well as many soluble proteins, further supporting the efficiency of this methodology.
One of the major problems associated with proteomic analyses are the contaminants in the sample that could interfere with the isoelectrofocusing of spinal proteins (salts, DNA, lipids …). To diminish the effect of this interference, a filter step was included before initiating the 2-DE gel protocol. We employed conventional 2-DE over different pH ranges (e.g. 4–7 and 3–11 NL) to generate different maps that could help search for potential biomarkers. Furthermore, the high degree of 2-DE gel reproducibility and the resolution obtained is necessary to generate good quality maps from the rat spinal cord and for future differential expression analyses. The gels focused with 17 cm pH 4–7 IPG strips did not resolve a large number of spots, and some proteins with a high isoelectric point were not focused correctly with a line of precipitated proteins appearing at the basic extreme of the gel. This distribution in 2-DE gels pH 4–7 could present problems for posterior spot identification, and even for future differential expression analyses between healthy individuals and patients. Accordingly, better resolution was obtained with 2-DE gels with non-linear pH3–11 24 cm IPG strips, avoiding the precipitation of basic proteins. These quality of these gels was relatively high and with a good protein spot distribution, leading to the identification of 200 different spots by MALDI-TOF/TOF.
It is important to note that 2-DE gels cannot resolve proteins below 10 kDa and above 100 kDa, including the more acidic or basic proteins. To maximize the number of proteins identified and to complement the results obtained for 2-DE MALDI-MS/MS, MS, LC-MS/MS analyses identified a further 367 unique proteins. Interestingly both proteomic tools could detect proteins with a broad range of molecular weights and isoelectric points, reflecting the efficiency of the methods employed. We found many proteins in the rat spinal cord with theoretical isoelectric points between 4.0–6.0 and 8.0–9.5, although less were obtained between 6.5 and 7.5.
The spinal proteins were classified into 6 different functional groups: Structural and Cell Cycle Proteins (25%), Metabolic Proteins (30%), Stress Response, Redox State and Apoptosis Proteins (16%), Regulation proteins (8%), Carriers and Other proteins Structural Proteins 12%. Structural and cell cycle proteins constituted a complex and heterogeneous group of cytoskeleton proteins, such as Microtubule-associated protein 1A, myelin sheet, or extracellular matrix and attachment proteins. In addition, DNA scaffold proteins and other structural proteins implicated in mitotic division and cell cycle regulation were characterized, making up around 25% of the total proteins identified. The second category, metabolic proteins, was also very broad and it reached nearly 30% of the total protein content, mainly containing hydrolytic and glucolytic enzymes. The third group, Stress Response, Redox State and Apoptosis proteins, was also a complex group made up of different proteins implicated in stress and injury response (Heat Shock Proteins). Furthermore, we included other proteins here associated with reducing oxidative damage and apoptosis. This group contained around 12% of the total proteins identified. Regulatory proteins related to protein synthesis, including transcription and translation, protein folding and degradation, made up about 16% of the proteins identified. Protein carriers were comprised of transporters and other metabolite binding molecules that represented approximately 8% of the total. Finally, a category of proteins that could not be classified into any of the above groups was denominated as “other” and contributed up to 12% to the complete proteome described here.
The proteins identified with a recognized function in the SC were organized into four functional groups. The numerous proteins in each functional group suggests that the technique developed in this report will be extremely useful to identify possible therapeutic targets for spinal cord injury, and pathways that may arrest the development of associated pathologies such as neuropathic pain and spasticity. Furthermore this technique will be important to develop future regenerative strategies.
Structural proteins were defined that included many common neuronal and glial proteins normally present in central nervous system tissue such as: Neurofilament (NF), Glial fibrillary acidic protein (GFAP), Myelin basic protein (MBP), Myelin-associated glycoprotein (MAG), Neural cell adhesion molecule (NCAM) and Macrophage migration inhibitory factor (MIF). Several of these proteins have a clear role during acute SCI such as GFAP in gliogenesis 41 or MIF in astrocyte proliferation, 42 while an increase in MAG would suggest the presence of a spinal environment that is inhibitory to nerve growth. 43
The second group of proteins were related to neurotransmission. Several Vesicle-associated membrane proteins (VAMPs) were identified but only some of these are thought to be upregulated in the pathological state following SCI, although similar changes may have been identified following peripheral nerve injury axotomy. 44 Many others were related to glutamatergic communication such as Glutamine synthetase (GS) and Glutamate dehydrogenase (GDH). These two proteins are known to be therapeutic targets for the successful treatment of spinal cord ischemia. 45
Among the proteins responsible for cell survival and combating apoptosis, the presence of Gamma-enolase, Glucose-6-phosphate isomerase, Peroxiredoxin-2 (possible anti-oxidant protein) and Protein DJ-1 in the normal spinal cord should be highlighted, as opposed to only one protein (Glyceraldehyde-3-phosphate dehydrogenase) associated with a pro-apoptotic profile. The upregulation of neuron-specific enolase has been previously described as a potential biomarker of acute SCI. 46 An increase in glyceraldehyde-3-phosphate dehydrogenase in spinal cord tissue has been demonstrated after contusion injury, 47 while previous proteomic analysis has highlighted the upregulation of peroxiredoxin 2 protein after experimental SCI. 48
Lastly, numerous proteins associated with cell metabolism, development, and response to injury were identified, including those associated with neuron-neuron interactions (Neural cell adhesion molecule 1) and neuron-glial cell interactions (Neurofascin), neurogenesis (Lyssencephaly-1 homologue A, Alpha-Internexin, Stathmin, Dihydropyrimidinase-related protein), neurite outgrowth (Neural cell adhesion molecule 1, Neurofascin), neuronal precursor proliferation (Lyssencephaly-1 homologue A), synaptogenesis and synaptic plasticity (Neurofascin and 14–3–3 protein gamma), axonal guidance (Neurofascin), axonal regeneration (Macrophage migration inhibitory factor) and myelination (Neurofascin). Significantly, the induction of a serine-threonine kinase stathmin after SCI has already been demonstrated and it was associated with an increase in glial proliferation. 49
In addition, several proteins with no known spinal function were identified (following a NCBI bibliographic database search), as well as Protein S100-B that has been proposed as a marker of SCI severity 46 and Ubiquitin carboxyl-terminal hydrolase isozyme L1 that may be related to axon degradation. 50 An upregulation of Gamma-synuclein has been described in the SC 51 and the spinal dorsal horn 45 although its precise role during acute SCI is not known. Moreover, both Thioredoxin-dependent peroxide reductase and Palmitoyl-protein thioesterase 1 have been linked to the negative regulation of neuron apoptosis (Swiss-prot Database). Finally, the Platelet-activating factor acetylhydrolase IB subunit alpha may promote the proliferation of neuronal precursors (Swiss-prot Database).
Taken together these data help highlight the change in the spinal cord proteome during acute and chronic SCI, as well helping to define the different profiles associated with symptoms such as neuropathic pain, spasticity, they will serve to benchmark future neuro-regenerative therapies. Despite the promising results obtained in these studies, it will be necessary to define more of the proteins present in the spinal cord proteome. We hope that by continuing these studies and complementing them, the characterization of the complete protein profile of the rat spinal cord will be possible, and differential expression analyses can be carried out in human and/or other animal models.
Disclosures
The authors report no conflicts of interest.
Footnotes
Acknowledgements
We thank Carmen Bermudez and Ana Isabel Carrasco for their technical support.
This work was supported by grants from the Instituto de Salud Carlos III (FIS PI070537), Fondo de Investigación Sanitaria de Castilla la Mancha (FISCAM PI2008/08), Fondo de Investigación Sanitaria de Castilla la Mancha (FISCAM, PI2008/28), REDES TEMATICAS DE INVESTIGACION COOPERATTVA (RD06/0014/1015).