
Abstract
High-content screening (HCS) technology provides a powerful vantage point to approach biological problems; it allows analysis of cell parameters, including changes in cell or protein movement, shape, or texture. As part of a collaborative pilot research project to improve bioscience research data integration, we identified HCS data management as an area ripe for advancement. A primary goal was to develop an integrated data management and analysis system suitable for small- to medium-size HCS programs that would improve research productivity and increase work satisfaction. A system was developed that uses Labmatrix, a Web-based research data management platform, to integrate and query data derived from a Cellomics STORE database. Focusing on user expectations, several barriers to HCS productivity were identified and reduced or eliminated. The impact of the project on HCS research productivity was tested through a series of 18 lab-requested integrated data queries, 7 of which were fully enabled, 7 partially enabled, and 4 enabled through data export to standalone data analysis tools. The results are limited to one laboratory, but this pilot suggests that through an “implementation research” approach, a network of small- to medium-size laboratories involved in HCS projects could achieve greater productivity and satisfaction in drug discovery research.
Keywords
Introduction
Cell-based, particularly image-based, assays have been essential tools over the years for understanding aspects of such general processes as signal transduction, gene expression, protein trafficking and localization, cell differentiation, and cell division. The automation of image acquisition and analysis and the advancement of fluorescent markers and dyes, coupled with the improved capabilities for data storage and management, have led to the development of technologies that allow cell-based high-content screens (HCS) of libraries of various samples, including small molecules, small interfering RNA (siRNA), and proteins. 1 HCS differs from high-throughput screens (HTS) in that HTS typically measures only one or a few biochemical parameters, whereas HCS can measure multiple complex phenotypic outputs and combinations of these outputs. HCS has the advantage that it allows analysis of important cell biological parameters, including subtle changes in cell or protein movement. In addition, HCS is well suited for phenotypic screens in which the specific molecular target involved in a particular biological process is not yet known.
The large amount of data generated by HCS, which can involve multiple terabytes of image data and often hundreds of measured cellular parameters per assay, can present deep computational challenges, ranging from mundane but important issues, such as data storage and backup, to deeper issues related to mining the immense data sets for biologically important findings and patterns. In pharmaceutical companies, where HCS has been performed to characterize compounds in preclinical drug development, the large-scale data problem presented by HCS has been challenging but not insurmountable since they tend to have large and well-funded information technology (IT) infrastructures. For example, Jackson et al. 2 recently reported an elegant and powerful integrated HCS database system, “HCS Road,” developed for Bristol-Myers Squibb.
The application of HCS research technology in academic research centers is now expanding beyond the initial development of the technology in pioneering academic laboratories.3–5 One driving force in this expansion is the National Institutes of Health (NIH) Molecular Libraries and Imaging roadmap program (http://commonfund.nih.gov/molecularlibraries/), initiated in 2003, which makes significant use of HCS technology and has helped introduce academic scientists in small- and medium-sized biology-oriented laboratories to the potential advantages of HCS-based experimentation. Such small- to medium-sized laboratories often have deep biological expertise that leads to innovation in the development and application of HCS technology to interesting and important biological problems. However, data management and integration associated with HCS technology in smaller laboratory settings are an even greater challenge as access to software programmers and systems integrators is often limited or nonexistent.
The current HCS informatics options available for smaller academic research groups are limited. There are commercial systems available, such as the Pipeline Pilot Platform for HCS Informatics (Acclerys, San Diego, CA) and HCSDiscover (Thermo Fisher and Genedata AG, Basel, Switzerland), but they have technical limitations, and their relatively high direct or implementation costs tend to be beyond the budgets of many small labs. Some groups have developed powerful public domain microscopy 6 and HCS workflow systems, 7 but although such systems are free to the user, they still require considerable IT support and maintenance.
A primary goal of the study described here was to determine if a simpler and more cost-effective HCS integration system suitable for small- to medium-sized labs could be developed and to propose a method to assess its efficacy for improving laboratory productivity and researcher satisfaction. A key difference between this study and other studies is that it focuses iteratively on users’ specified needs and tested ability of the final system to meet those needs, a method that could be called “implementation research.” The system we developed is built upon the Web-based research integration database platform Labmatrix (BioFortis, Columbia, MD). Labmatrix is a commercial Web-based application that supports the integration of multiple data sources, stores data in a central location, and allows researchers to answer specific research questions using an intuitive visual query interface. The software implementation research project itself is part of a National Cancer Institute–funded collaborative research endeavor that is aimed at improving bioscience research data integration and productivity in academic laboratories.
Materials and Methods
Primary Retinal Ganglion Cell HCS Assay
The project focused on data management for an established HCS assay being performed in the Zack Laboratory, an academic research laboratory in the Wilmer Eye Institute at the Johns Hopkins University School of Medicine, focused on retinal pathobiology. The Zack Laboratory has 10 to 15 personnel, 3 to 5 of whom are involved with HCS activities based on a screen to discover compounds that promote the viability and neurite outgrowth of cultured primary retinal ganglion cells (RGCs). 8 Full details of the assay will be reported elsewhere. Briefly, the assay involves the purification and culture of RGCs from rodent retina. All procedures are performed under an approved Johns Hopkins Animal Care and Use Committee protocol. RGCs from perinatal mice and/or rats are purified from dissociated retina tissue using an antibody against the surface protein Thy-1, whose expression in the retina is largely restricted to RGCs. The RGCs are then cultured under conditions that were developed to maximize neuroprotective and neurite-promoting activity of positive control molecules such as brain-derived neurotrophic factor (BDNF) and forskolin—namely, conditions that are not too “rich” (i.e., background level of cell growth and neuritogenesis not too high) and not too “poor” (i.e., cells too sick to respond to exogenous factors). RGCs are cultured under these conditions in 96-well plates using positive and negative controls in the two end columns, leaving 80 wells per plate for experimentation. After 3 days in these culture conditions, the RGCs are stained with a combination of fluorescent dyes (calcein-AM, a whole live-cell stain; Hoechst, a cell permeant DNA stain; and ethidium homodimer-1, a DNA stain that can only enter cells with damaged membranes) ( Fig. 1 ), which enable simultaneous assessment of nuclei, cell bodies and neurites, and cell viability. Then, using an automated fluorescence-based imaging system (Cellomics ArrayScan VTi; Thermo Scientific, Pittsburgh, PA), images are automatically acquired from up to 40 fields per well. These images are stored as C01 (a proprietary image format) files on a Dell Xeon-based 6-terabyte server hosting a Cellomics STORE SQL database provided by Thermo Fisher Cellomics that is based on a Microsoft SQL server. Each image is about 250 KB and stored within a folder for its particular plate along with a Microsoft Access .mdb file containing the quantitative data from the set of analyzed images, which are then spooled to the SQL database. Images are analyzed with custom algorithms created by the Zack Laboratory using the Cellomics Neuronal Profiling image analysis software package. With these algorithms, neurons and associated neuritic processes are quantified. A total of 671 parameters are obtained, including well-by-well quantification of live and dead cell number and multiple morphological characteristics of the RGCs, such as total, average, and maximum neurite length and number, as well as total, average, and maximum number of neurite branch points.
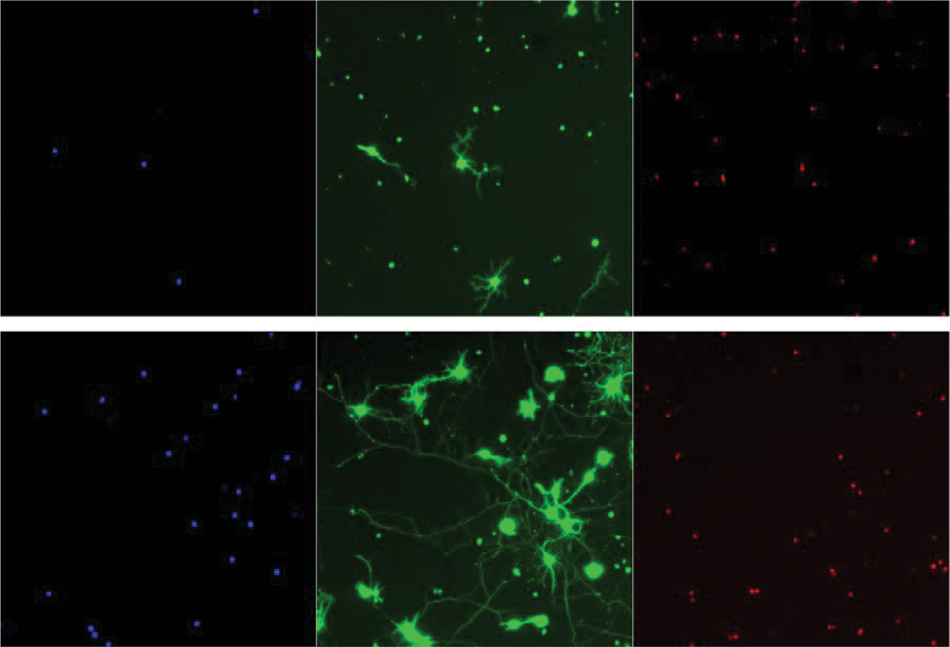
Primary retinal ganglion cell high content screening assay control images. Upper panel shows vehicle-only negative control–treated cells, and lower panel shows positive control–treated cells, stained with (a) Hoechst DNA stain, (b) calcein-AM whole live-cell stain, and (c) ethidium homodimer-1, a stain identifying dead cells. The image analysis algorithm in use defines live cells as those meeting three requirements: (1) having a nucleus by Hoechst DNA stain, (2) staining with calcein-AM, and (3) not staining with ethidium homodimer.
Labmatrix
Labmatrix is a Web-based data storage and exploration system based on the Enterprise Java (J2EE) model framework. The Labmatrix server system consists of five core software components (Labmatrix codebase, Apache Tomcat, SQL Server 2005+, Windows Server 2003+ OS, and Java JDK). Current implementations of Labmatrix servers range anywhere from using a single machine with a 2-GHz dual-core processor and 4 GB RAM, up to multiple machines with 2 × 2.53-GHz quad-core processors and 40 GB RAM. For end-users, a consumer-level machine can be used to access Labmatrix (e.g., 1.0-GHz laptop with 2 GB RAM). The footprint of Labmatrix is minimal for end-users because the system can be accessed via any modern Web browser—all queries and data computations are executed on the Labmatrix server machine.
Results
Bioscience Research Integration Software Platform
The goal of the Bioscience Research Integration Software Platform (BRISP) project is to identify and reduce barriers to scientific productivity and satisfaction in specific translational research-oriented biomedical research laboratories through direct involvement in evaluating and improving data management in research laboratories. Recruitment and selection of the laboratory of Dr. Don Zack for this Johns Hopkins Medicine institutional review board (IRB)–approved study was completed in a three-phase process (details in supplementary information). An evaluation of the initial phase of the project from an information management perspective has been previously reported.9,10 Here we report the BRISP process in relation to HCS data management in the Zack Laboratory and provide before BRISP/after BRISP comparisons in key areas.
Establishing an Integrated Queryable Database for HCS Data
A key data management issue that the Zack Laboratory frequently encountered with its HCS screening, one that is common to most HCS labs, was not having the capability to easily and comprehensively assess what compounds and/or conditions had been evaluated in the various HCS screening assays that were being done in the lab, as well as what the results of these various assays were. Although most of these data were contained within the Cellomics STORE database and associated library compound files and could be assessed relatively easily with the Cellomics software in terms of individual pieces of data, there was neither the means to obtain data across different experiments nor a way to broadly mine the available information. The BRISP project evaluated the ongoing HCS data workflow and then worked to develop a means to efficiently integrate the various HCS data types (discussed in more detail below) into a single dynamically updatable queryable repository in Labmatrix.
Before the project, the investigators in the Zack Laboratory faced a number of barriers to productivity stemming from a daunting set of nonintegrated steps that were required to obtain interpretable results. Data analysis was dependent on the individual efforts of the investigators and not aided by an integrated information management system. As a result of the project, some of the barriers have been eliminated or reduced, and the investigators now have the capability to perform a series of routine data qualification steps (e.g., checking to compare positive and negative control results vs previous values) and aggregation steps culminating in a dynamically updated queryable HCS data repository contained in Labmatrix. However, certain limitations remain and are documented below.
HCS Data Types
During an HCS screening assay, cells are imaged, these images are analyzed using sophisticated algorithms, and a set of quantitative measures for each cell is calculated as described in Materials and Methods. We will refer to these data as the “Raw Image Data” and the cumulative well-based quantification of cell-based measurements as “Raw Numeric Data,” respectively. The other two critical types of HCS data are “Experiment Information” (parameters describing a specific HCS assay run) and “Plate Layout,” which describes what samples are located where on a particular assay plate and data related to these samples.
Importing Raw Numeric HCS Data to Labmatrix
HCS Raw Image Data and Raw Numeric Data that are captured during the screening are stored in the Zack Laboratory Cellomics STORE database. Before the BRISP project, a barrier to productivity was the fact that Zack Laboratory investigators had no convenient way to query and process (i.e., normalize, average, etc.) the Raw Numeric Data from the STORE database beyond exporting results for multiple parameters from a single plate to an Excel file or a single parameter from up to nine plates to an Excel spreadsheet. There are software tools available through Thermo Fisher that enable third-party software developers to directly access all the data stored on STORE, but for a small/medium-size lab (small-medium loosely defined as personnel count in a range from 1–18 people), such software implementation was not a practical solution. Thermo Fisher/Cellomics also has auxiliary software that does support annotating and querying assay results (HCS Explorer and HCS Discover), but these solutions were also considered not ideal because HCS Discover is relatively expensive for a small lab, and they both have associated issues such as limitation on the number of plates that can be simultaneously analyzed. The BRISP team therefore decided to investigate alternative, more flexible solutions, based on use of the BioFortis Labmatrix system as a platform to integrate and manage Raw Numeric Data, Experiment Information, and Plate Layout data.
To establish a standard way of importing the Raw Numeric Data from Cellomics STORE into Labmatrix, the BRISP team wrote an SQL query capable of extracting all Raw Numeric Data for named HCS assay plate(s). The most convenient way to make this query was to define an Excel database query (DQY) wrapper, which the investigator clicks to obtain a single spreadsheet containing a complete set of Raw Numeric Data from STORE for the specified plate(s) (
Fig. 2
). This Java-based tool is particularly useful because the Zack Laboratory can execute it from Windows or Mac platform computers located in the laboratory. The user uploads the Raw Numeric Data spreadsheets directly to Labmatrix via its import module (
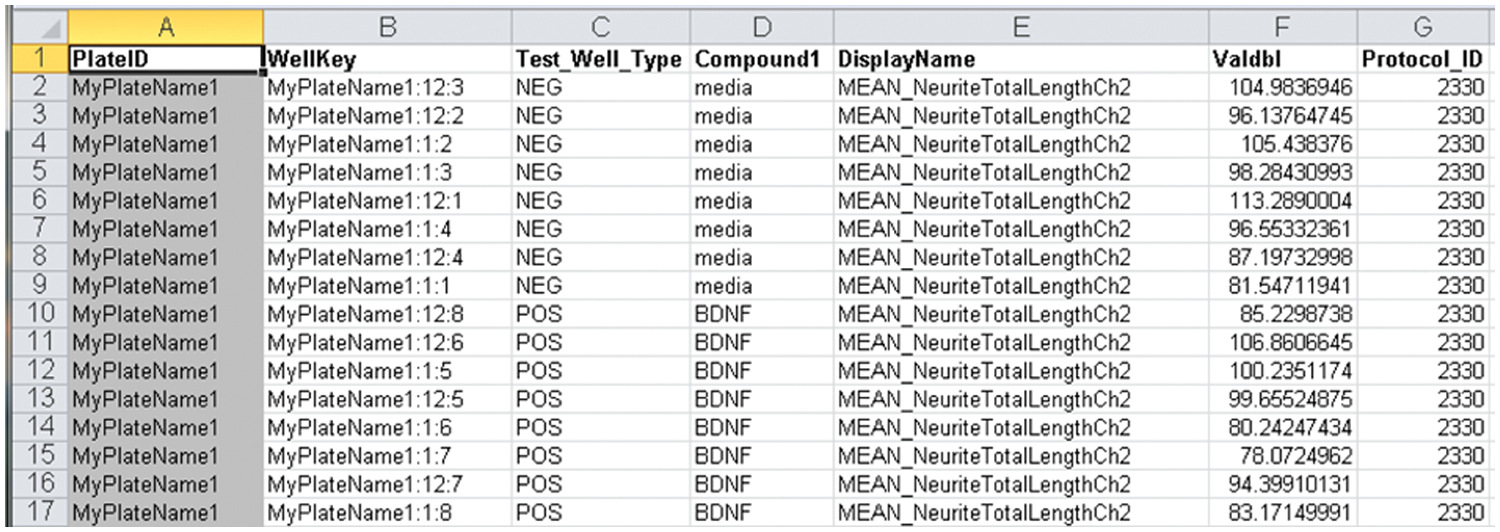
High-content screening assay plate-specific output from the Cellomics STORE database of Raw Numeric Data generated using .DQY executed from within a Java wrapper. The spreadsheet is saved and then uploaded directly to Labmatrix in .txt or .xls formats.
It is not uncommon for specific wells in an individual HCS assay plate to fail because of bubbles, precipitated material in the well, lack of viable cells in the well, contamination, and so on. Prior to the project, each of these wells had to be identified and eliminated each time an analysis was performed on plate data. During the project, the integration of HCS data via Labmatrix provided a convenient means for “bad wells” to be identified and recorded in an easy to use Query Filter in Labmatrix, which is automatically applied to any downstream query on HCS plate data.
Importing Experiment Information and Plate Layout Data
Before the BRISP project, a major barrier to HCS productivity was the fact that Experiment Information and Plate Layout data did not have an explicit standard format, and the Plate Layout and Experiment Information were managed separately from the Raw Numeric Data. To query combined data, labor-intensive and error-prone “data joins” using Excel spreadsheets were necessary. This work required understanding of the complex underlying data organization and was limited to people in the lab who were capable of carrying out the full process, which was an impediment to productive analysis of the available data. One of the fundamental advances of the BRISP project was to eliminate this barrier and create a method for defining and recording experiment information and plate layout data with sufficient specificity, flexibility, and simplicity to make this portion of the experimental workflow routine. This enables the laboratory scientist to focus more on discovery in the aggregated data set rather than on assembly of aggregated data spreadsheets typically usable for only a single narrow research question.
Experiment Information, which contains information specific to each HCS experiment run (specifics of dissection and cell purification procedure, number of animals used, antibodies and other reagents used, etc.), is specified by the researcher in a standard form contained in Labmatrix (
A plate layout for each assayed plate is uploaded to Labmatrix using a standard plate layout spreadsheet ( Fig. 3 ). Plate layout data include the test condition for each well of the plate (negative control or positive control, compound(s), and concentration). Additional columns included are company and catalogue number of the primary test compound, as well as structure, formula, molecular weight, and SMILES (Simplified Molecular Input Line Entry Specification) for the primary and up to four additional compounds, if a given well contains a mixture of compounds. There are also available columns for the class and action of the primary compound, the solvent used, three notes columns, and a plate barcode column. Plate layouts are stored in Labmatrix and are reused when experimental conditions are repeated in new experiments.
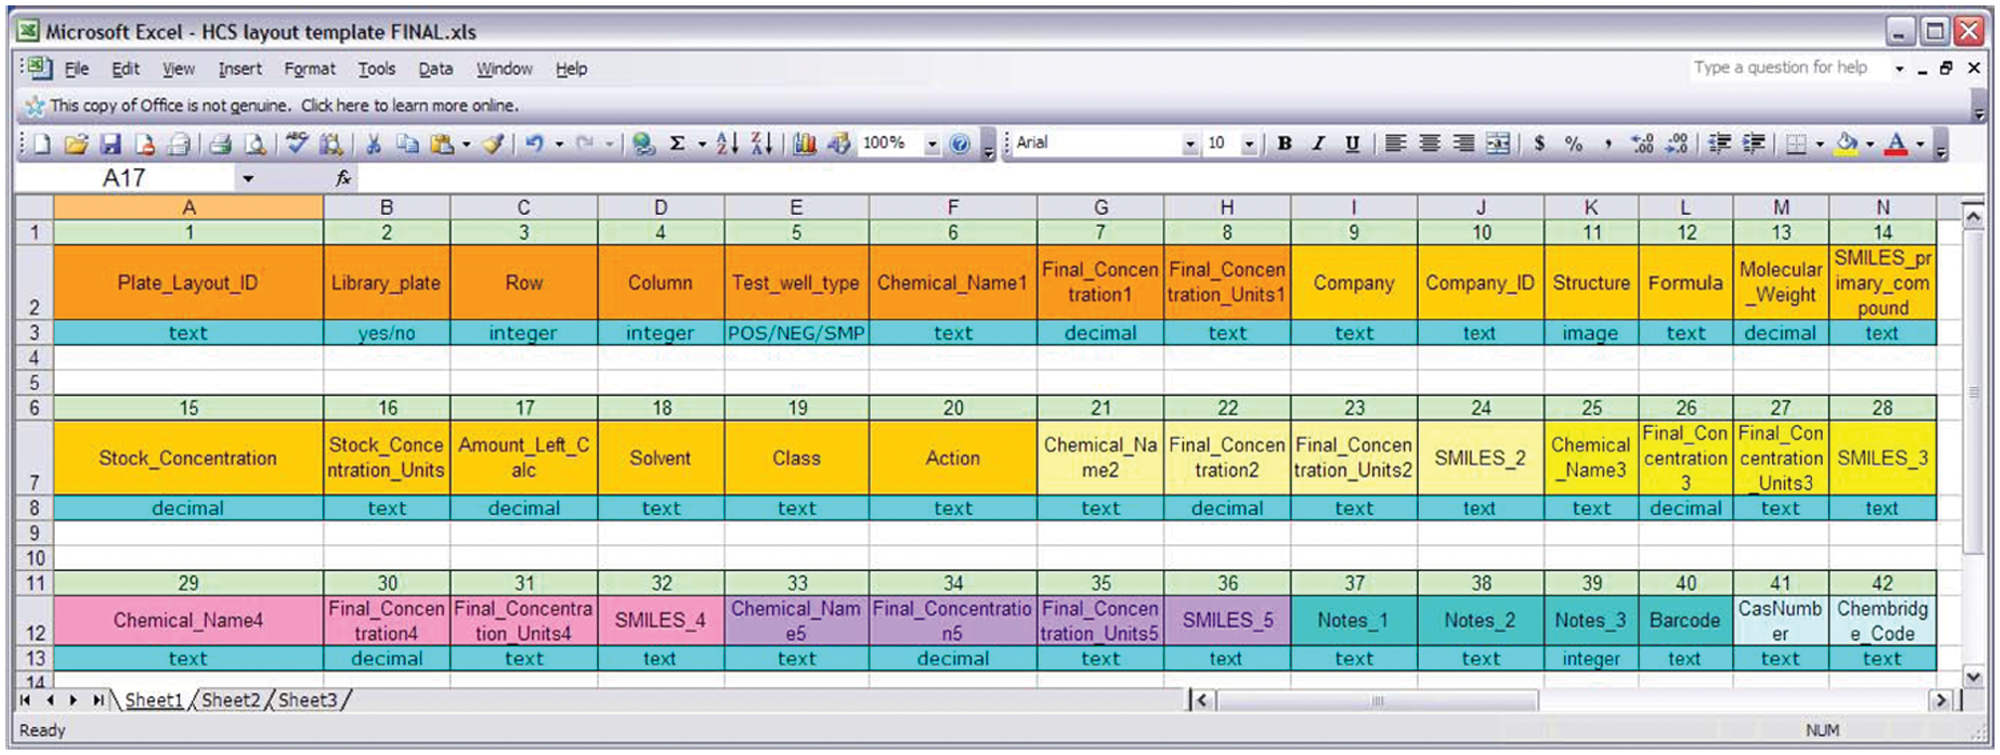
Plate layout data spreadsheet used for upload to Labmatrix. Prior to the current project, the investigators had no convenient way of linking high-content screening Raw Numeric Data with plate layout data. Using this standard spreadsheet, the investigators provide data for each well of the assay plate, which are then uploaded to Labmatrix. Column identifiers (light green boxes) and names are redistributed in this figure to allow data elements to be viewed.
HCS Data Normalization
To support data quality analysis and comparison of HCS data across multiple assay plates, Raw Numeric Data must be normalized to positive and negative control results for each plate, and a Z-score statistic must be calculated to define the quality of a given HCS assay. Prior to this project, such normalization and Z-score statistic analysis was generated within individual spreadsheets for each plate. There was also no convenient means to archive normalized results for general lab use over time. To eliminate these barriers, the project team defined a set of four Raw Numeric Data normalization formulas and a Z-score calculation formula and implemented them as automated scripts in C# within Labmatrix. These scripts are run automatically on a periodic basis for all new uploaded Raw Numeric Data. Resulting normalized data and Z-score statistics are automatically populated as clearly named data volumes in Labmatrix. The automatic normalization and Z-score calculations are as follows:
Media-only normalization = (raw value)/(average of raw values of all negative control wells in plate).
Media and drug normalization = (raw value)/(average of all well values in plate EXCEPT positive control wells). This normalization can be useful when screening molecules not known to be biologically active, as it is assumed that most factors will have no effect on the cultured cells, and thus all data available for normalization can be used.
Scaled media-only normalization = [(normalized value from 1 above)/(average of all normalized positive control wells in plate)] × 100.
Scaled media and drug normalization = [(normalized value from 2 above)/(average of all normalized positive control wells in plate)] × 100.
Z-score = 1 – [3(SD of positive control + SD of negative control)/ABS (mean of positive control – mean of negative control)]. 11
Query Canvas for HCS Data
After the HCS Experimental Information, Plate Layout, and Raw Numeric Data are imported into Labmatrix and automatically normalized, laboratory investigators are ready to query these data from the Labmatrix query interface. This is a dynamic graphical interface whereby the user drags curated information bins (“data volumes”) of interest (spreadsheets, query results, database tables, etc.) onto a query canvas and then connects these data volumes via join, union, filter, statistical manipulation, and so on within the interface ( Fig. 4a ). In our project experience, this interface was relatively easy for investigators to learn and use routinely. The major advantage of the visual query interface is that it eliminates a major barrier to productivity—it allows the investigators to build and run complex data queries without having to learn SQL syntax or wait for programmers to develop specific queries. The visual queries are largely self-documenting and leave a record not only of the results of the analysis but also the full structure of the query itself, for later revision as needed. In addition to enabling routine investigator-directed query of complex data, the visual interface provides a visual summary of the data underlying a particular result set. Furthermore, the ability to save or copy and modify existing queries allows investigators to conveniently use data sets repeatedly as the research project proceeds. The investigator simply reruns already created queries after new data are added to the database. The visual query interface also provides a convenient means for new users to learn how to build new queries by cloning and modifying old queries. At any time, the investigator can obtain query results in spreadsheet format as shown in Figure 4b . The results can then be immediately visualized within Labmatrix or exported to other systems in a variety of formats, and the queries themselves can be saved and securely shared. Prior to the BRISP project, investigators had no ability to create, record, view, or meaningfully store complex SQL queries of their large existing HCS data repository. Thus, productivity increased through the introduction of the visual query interface because the analyst can analyze the data in less time by reusing and modifying existing queries. Satisfaction increased because the visual query interface is user-friendly and allows the analyst to analyze data in completely new ways.
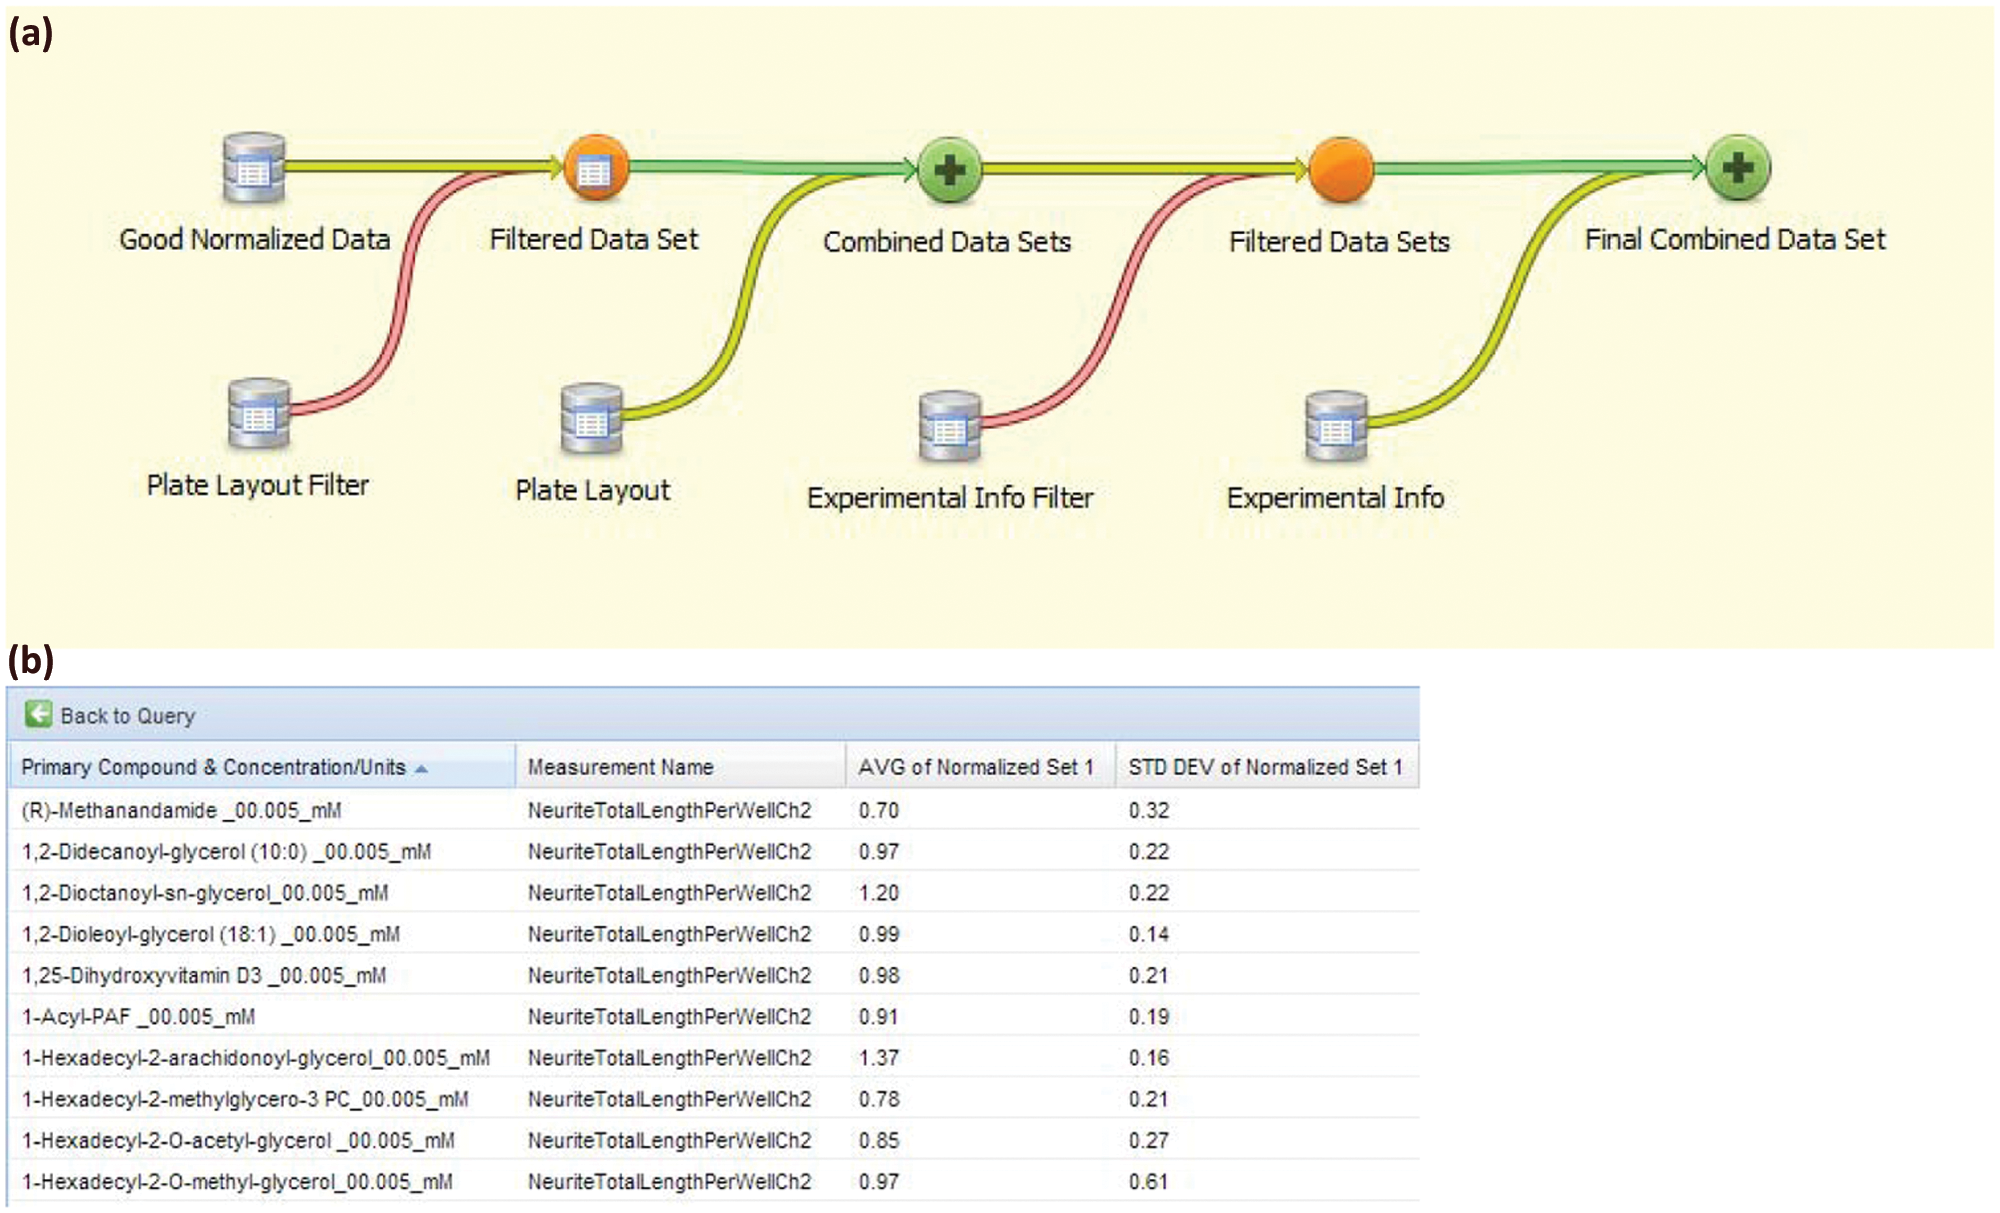
(a) Example use of the visual query tool in Labmatrix. To obtain results for a specific high-content screening research question, the investigator drags pertinent data stores into a visual query interface and implements joins, unions, filters, calculations, and other operations using visual query tools. For example, the two “red” operations associate only corresponding data rows from the joining sets, whereas the two “green” combinations add the actual data columns from those sets; different data sets are merged via keyed columns (plate name + well location) present in joining sets. Queries are automatically updated based on currently available data and can be saved or cloned and edited to address new questions. Export to Excel or other formats is available at each step. Prior to the project, the investigators had no means to conveniently query their raw or normalized data sets together with experiment information data and plate layout data. (b) Data output from example query. Results can be directly visualized within Labmatrix or exported for visualization and analysis using other tools.
Visual Display of HCS Data and Statistical Analysis
A general barrier for productivity in any research laboratory is the time it takes to visualize data. For any query result, investigators can now simply and directly visualize results in Labmatrix using a series of basic display options ( Fig. 5a ), including scatter plots, bar charts, and other options. This viewer allows the user to select sort order and choose the number of data points to show, number of data series to display, and other options to perform a quick review of the data landscape. Example bar charts and line charts are illustrated in Figure 5b , c . For more advanced visual display and for statistical analysis, the user can export any desired data set in a variety of formats suitable for current standalone data analysis software packages.
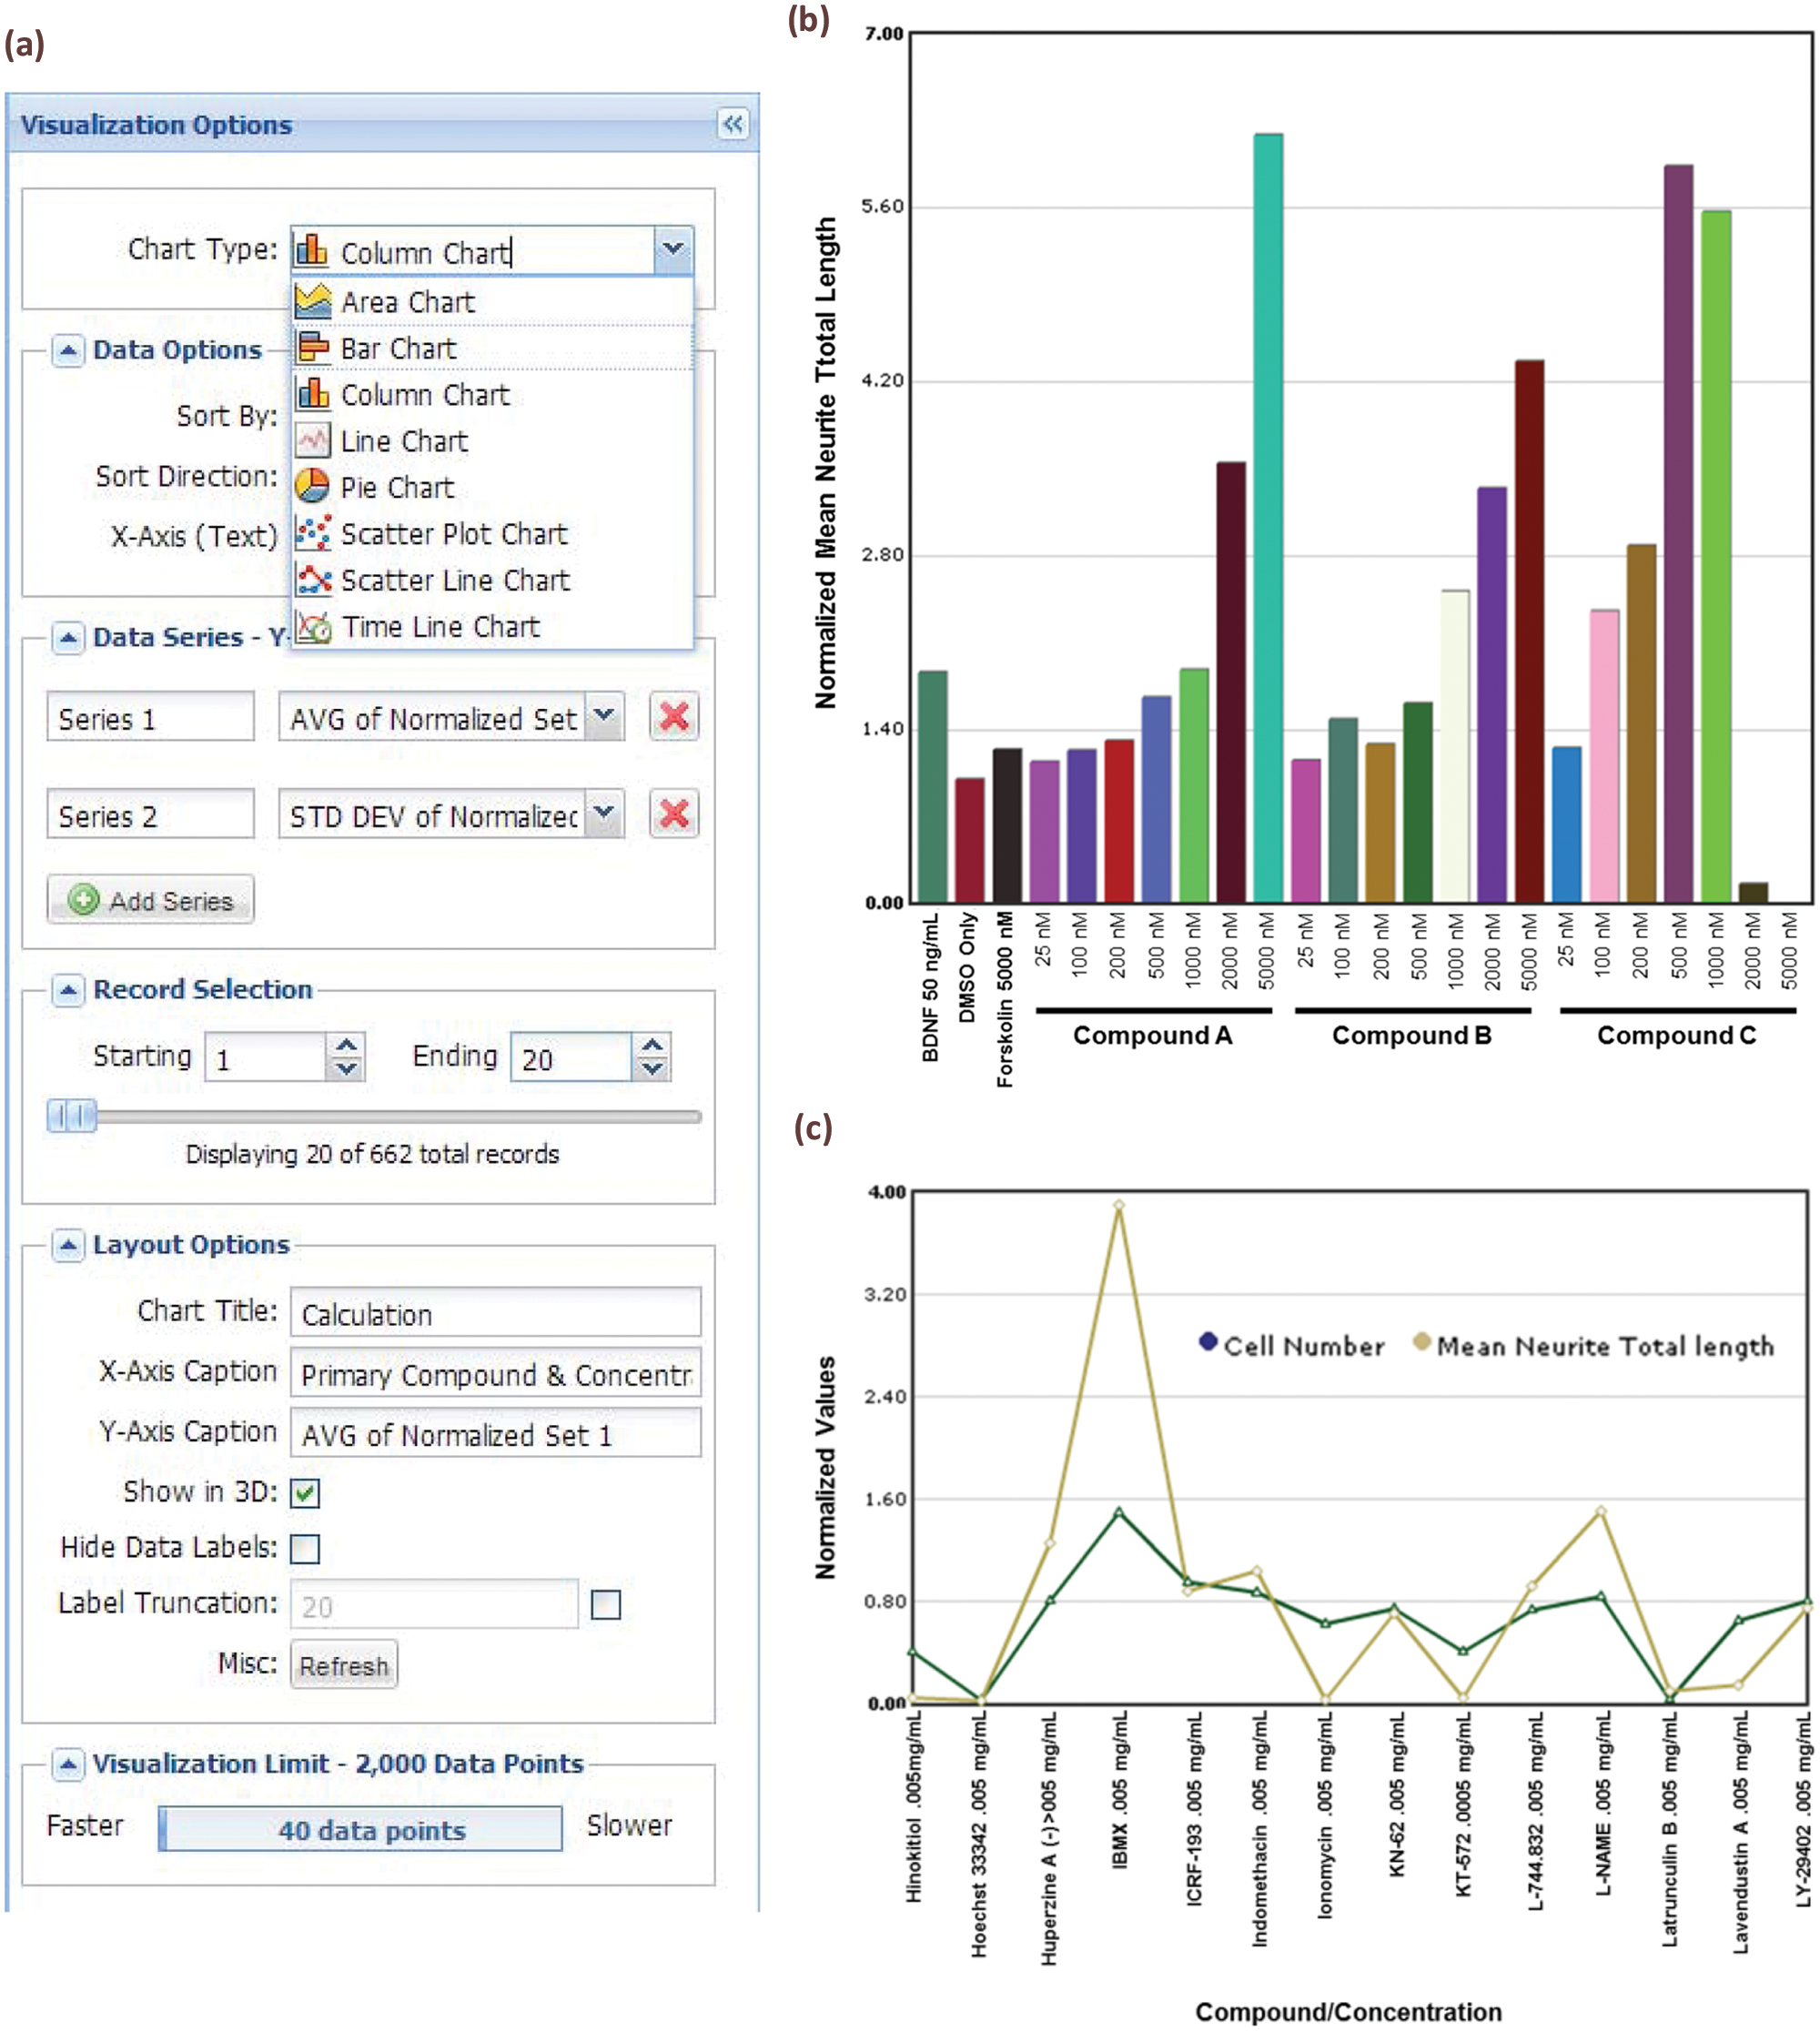
(a) Configuration dialog for the Labmatrix visualization. The researcher can select a chart type, specify sorting of data points, and select specific records using a slider. (b) Example dose-response bar chart produced by Labmatrix visualization tools. High-content screening (HCS)–based normalized mean neurite length is displayed for positive and negative control compounds and for three compounds of interest at increasing concentrations. (c) Example line chart created by native Labmatrix visualization tools. Normalized HCS values for retinal ganglion cell number and mean neurite total length are shown for screening compounds of interest. The concentration of the tested compound is also shown.
Summary Evaluation of BRISP HCS Data Management Project
Comparison of pre- and postproject HCS data management status is provided in
Table 1
and
Discussion
Recent articles have highlighted unaddressed barriers to good data management plaguing bioscience research laboratories.12–15 The findings reported here pertain to a study aimed at improving scientific productivity and satisfaction as it relates to HCS data management in one biological research-oriented laboratory. The advantage of the interdisciplinary team-based BRISP process (see supplementary information) used is that it provides regular but relatively inexpensive access to expert-level data integration guidance to research scientists who otherwise have little or no access to such expertise. Whether this approach to improved laboratory data management is broadly useful will require additional studies, but there is no evident reason that it could not be packaged and implemented on a large scale.
To our knowledge, this is one of the first reported outcomes-based studies of changes in data management practices in a bioscience research laboratory. We point this out because we believe that significant benefits could be obtained by developing a field of bioinformatics research devoted to practical bioinformatic outcomes oriented toward productivity and satisfaction of scientific investigators, as suggested in recent publications.16,17 Future studies of this kind should focus on how to simplify and reduce the time required for project stakeholders to identify problems whose solutions are not only feasible but most highly desirable.
Pre- and Postproject Data Management Status in Key Areas
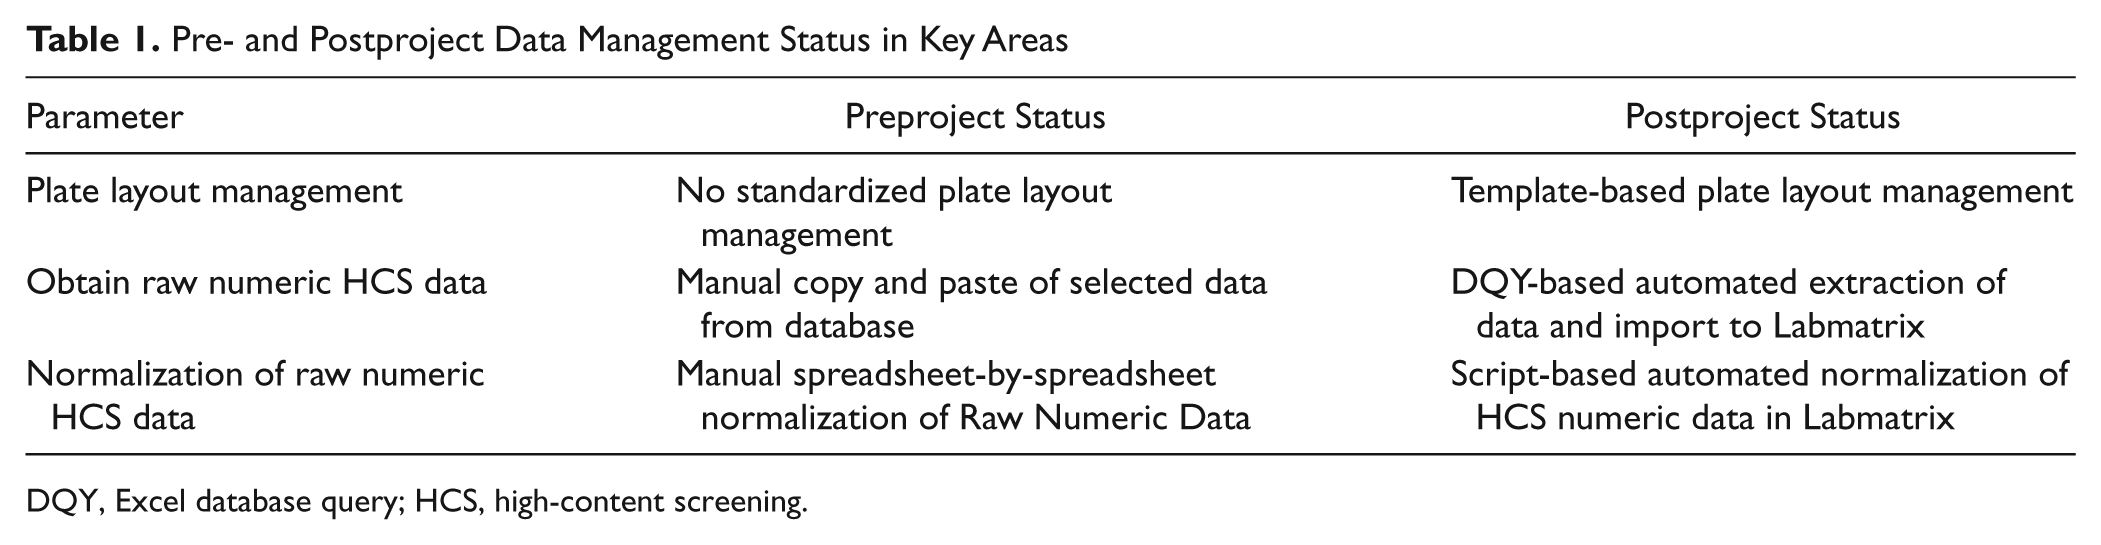
DQY, Excel database query; HCS, high-content screening.
Impact on High-Content Screening (HCS) Scientific Productivity as Measured by Specific Lab-Requested Queries
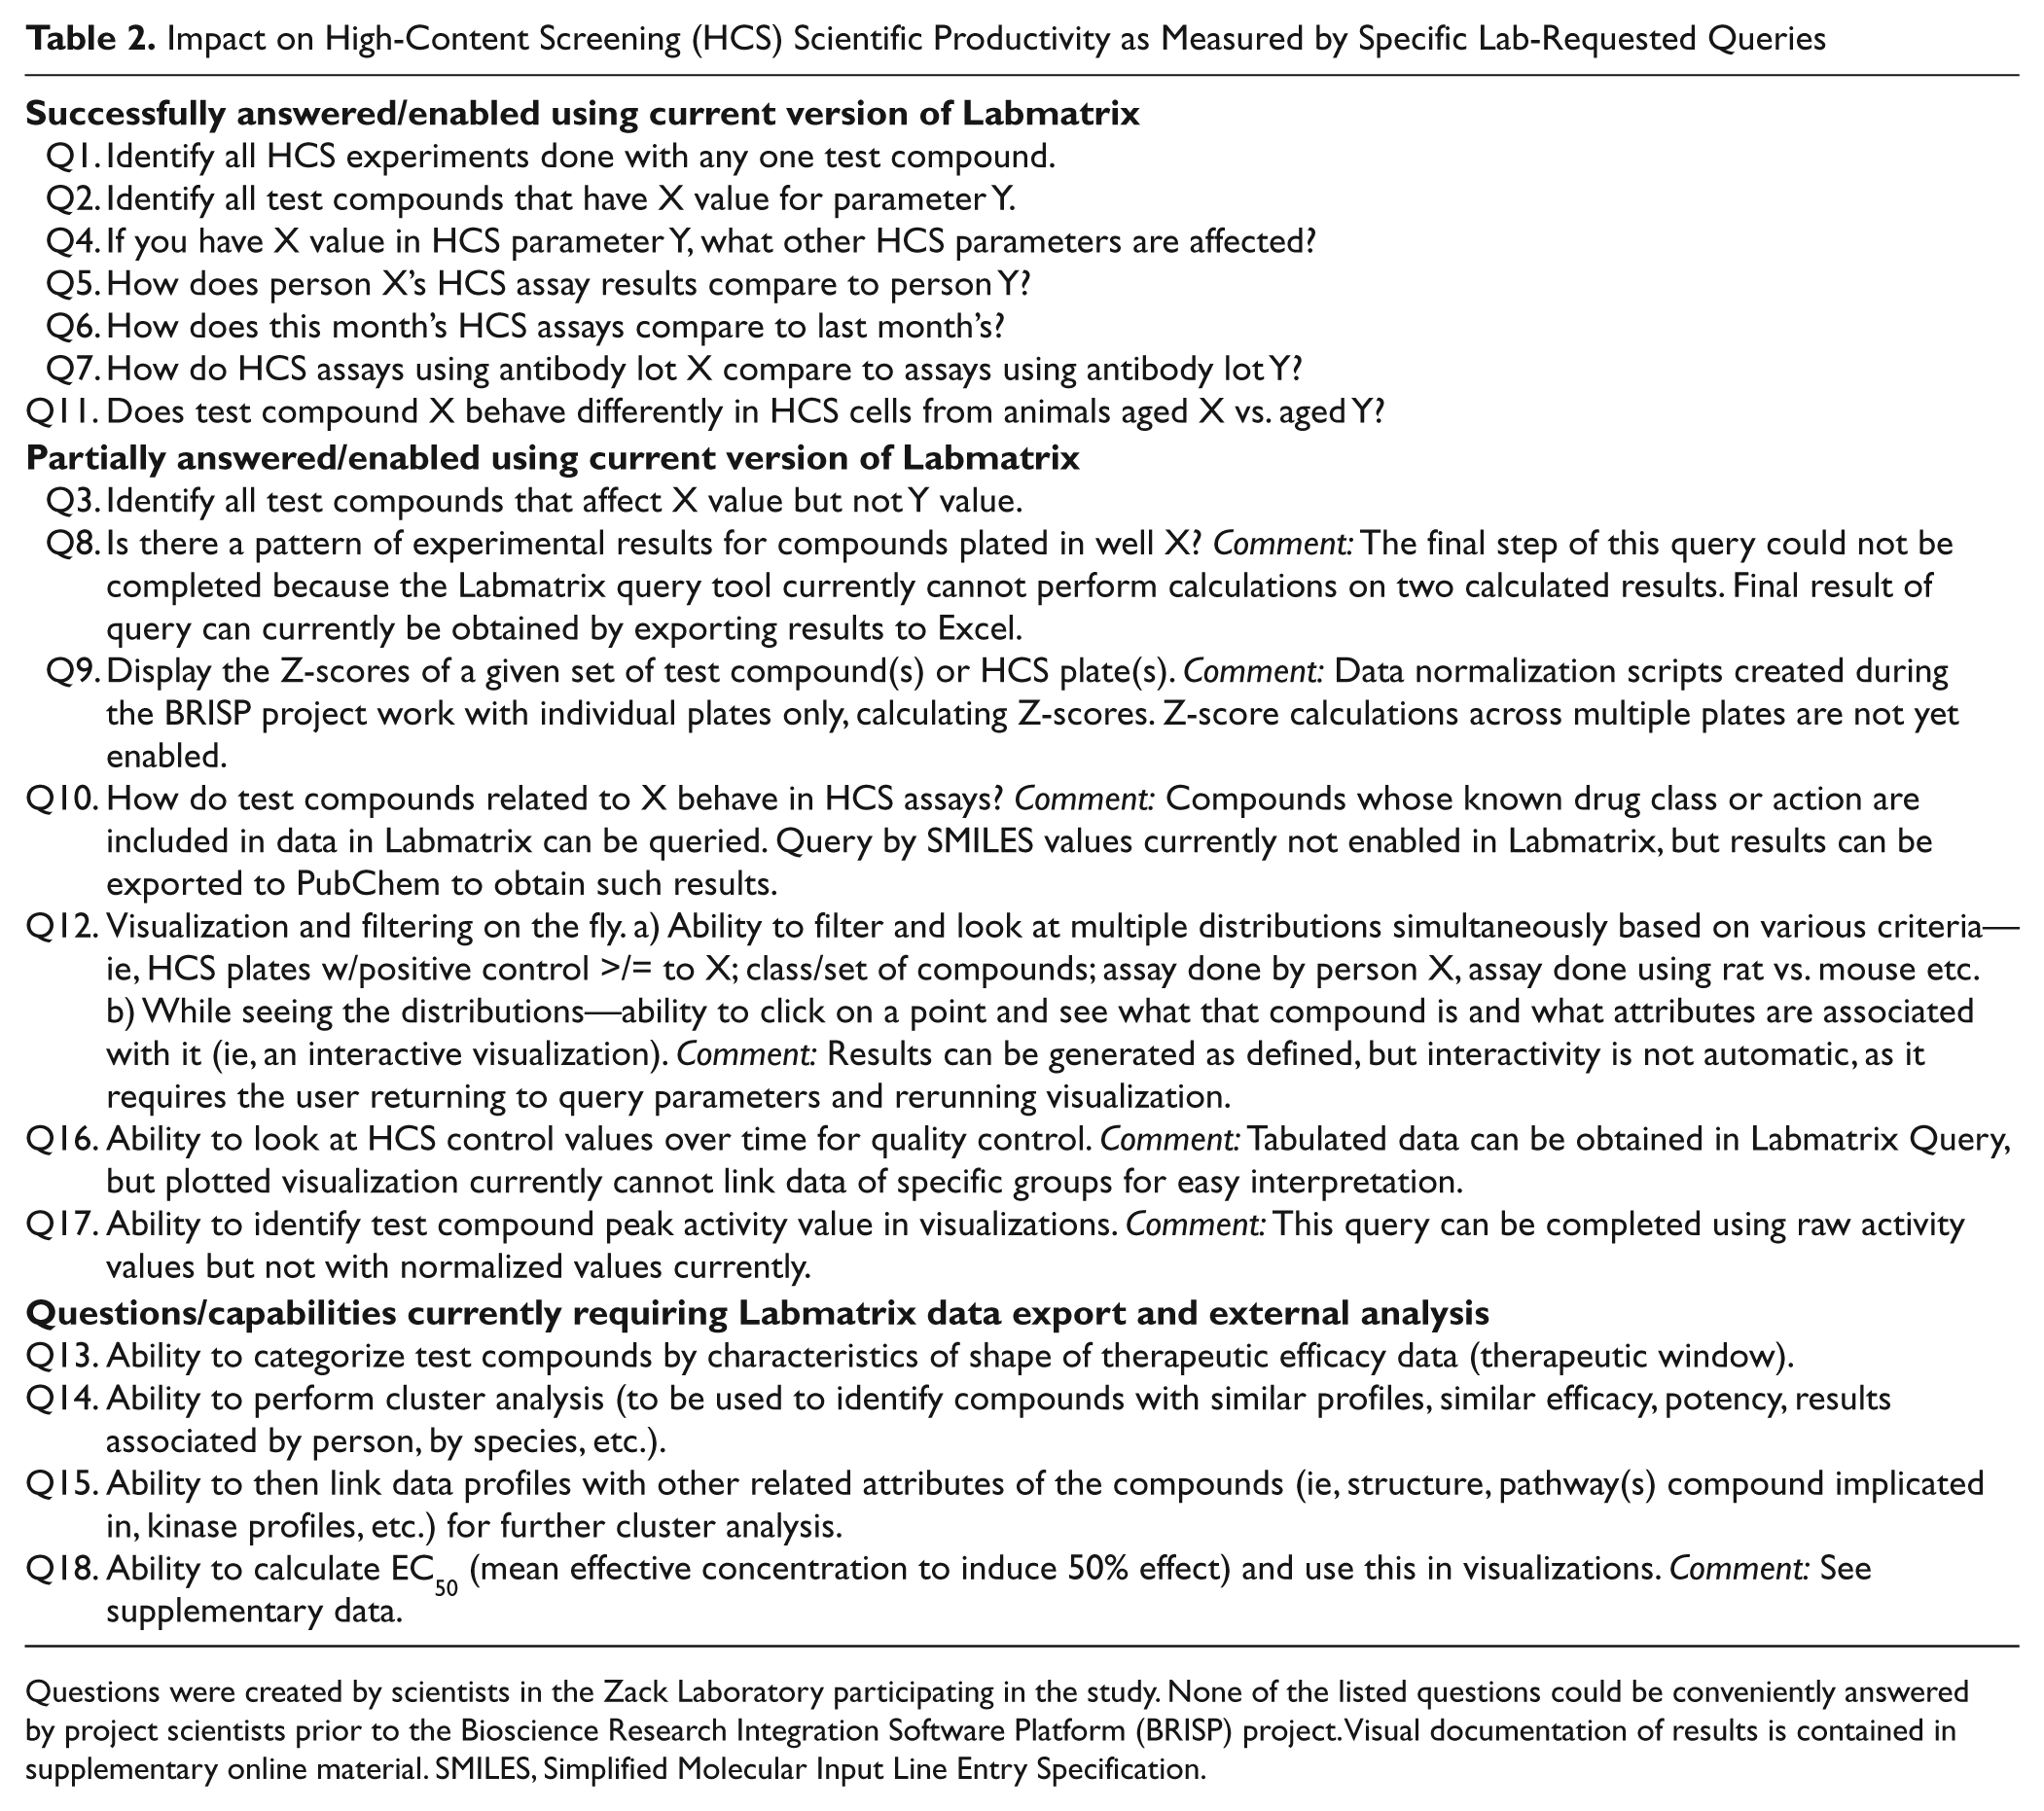
Questions were created by scientists in the Zack Laboratory participating in the study. None of the listed questions could be conveniently answered by project scientists prior to the Bioscience Research Integration Software Platform (BRISP) project. Visual documentation of results is contained in supplementary online material. SMILES, Simplified Molecular Input Line Entry Specification.
In terms of data management, the most important lessons learned from the study can be summarized as (a) critical importance of investigator control over raw and processed data, (b) facilitation of the establishment of workflow by focused custom programming, (c) requirement for recording of experiment context, and (d) high added value of a Web-based HCS data management workflow, especially regarding visual query construction. It is obvious that laboratory researchers need to maintain control over their raw data sufficient to support good science, but the software available to the laboratory prior to the project did not support sufficiently convenient Raw Numeric Data workflows to be established and maintained. We overcame this problem by developing a simple database access routine for the laboratory to obtain all pertinent data for given HCS assay plates. Inability to easily access these data was a longstanding issue in the lab, and the ability of the BRISP team to solve this problem was a critical confidence-building step. Once this was done, it became apparent that the existing HCS SQL database did not adequately support management of experiment information (
The final substantial project advance was enabled by the creation of a list of data queries necessary for adequate HCS data analysis ( Table 2 ). The research laboratory investigators benefited from this process by learning that they could conveniently construct, execute, annotate, save, and share complex queries to answer a substantial number of the questions. The BioFortis team benefitted from the process because it helped them identify several specific points where Labmatrix is expected to be improved in upcoming software releases, as listed in Table 2 and documented in the supplementary information. The results suggest that Labmatrix, configured as described, will provide a simpler and more cost-effective solution for HCS integration in small- to medium-size laboratories.
In conclusion, the effectiveness of HCS technologies in enabling identification of novel new therapeutic agents is the product of the quality of engineering of the HCS technologies and the quality of biological insight applied in the experiments performed using these technologies. Availability of engineering resources without deep biological expertise will lead to predictable failure, and similarly, availability of deep biological expertise without sufficient engineering resources (engineering used here as shorthand for all of the technology required to do good HCS or HTS) will also lead to predictable failure. The pharmaceutical industry is currently beset by a low number of promising new drugs in the pipeline. 18 The National Institutes of Health (NIH) has recognized the dearth of new therapeutic agents in the pipeline and, in an effort that appears oriented toward bringing engineering and biology closer together, has proposed the creation of a new NIH National Center for Advancing Translational Science (NCATS). 19 A continued reduction in barriers to effective HCS-based research in academic laboratories promises to increase the likelihood that these efforts will result in discovery of effective new drugs.
Footnotes
Declaration of Conflicting Interests
Under a licensing agreement between BioFortis, Inc. and the Johns Hopkins University (JHU), Dr. Bova and JHU own BioFortis, Inc. stock, which is subject to certain restrictions under JHU policy. The terms of this arrangement are being managed by JHU in accordance with its conflict of interest policies. Steve H. Chen, Yakov Shafranovich, and Jian Wang are employees of BioFortis Inc., maker of the Labmatrix software.
Funding
The author(s) disclosed receipt of the following financial support for the research, authorship, and/or publication of this article: The BRISP project was supported by NIH NCI STTR R41 CA105217. The described laboratory work was funded in part by NIH 5R21 EY019737, 5R01EY019305, 5P30EY001765, by generous support from the Guerrieri Family Foundation, and by a research grant from the Investigator Initiated Studies Program of Merck Sharp & Dohme Corp. The opinions expressed in this paper are those of the authors and do not necessarily represent those of Merck Sharp & Dohme Corp. This manuscript is dedicated in memory of Mrs. Patti Guerrieri.
References
Supplementary Material
Please find the following supplemental material available below.
For Open Access articles published under a Creative Commons License, all supplemental material carries the same license as the article it is associated with.
For non-Open Access articles published, all supplemental material carries a non-exclusive license, and permission requests for re-use of supplemental material or any part of supplemental material shall be sent directly to the copyright owner as specified in the copyright notice associated with the article.