
Abstract
Study design
Retrospective cross-sectional study.
Objectives
Paralumbar muscle degeneration is closely linked to adult spinal deformity (ASD). However, assessment methods vary widely, including quality via fat infiltration (FI) and quantity through paraspinal total cross-sectional area (PTCSA), psoas vertebral body index (PVBI), and normalized total psoas area (NTPA). This study aimed to determine which parameter best correlates with spinal alignment in ASD.
Methods
116 ASD patients were analyzed. Spinal alignment was evaluated using standard preoperative spinopelvic parameters. Paralumbar muscle was evaluated by preoperative MRI, using FI for quality, and PTCSA, PVBI, and NTPA for quantity. Correlations between these metrics and spinopelvic alignment were analyzed. Subgroup analyses assessed associations between alignment and FI or PVBI levels. Age-stratified analyses explored these associations in patients under and over 70.
Results
FI and PVBI demonstrated significant correlations with multiple sagittal alignment parameters, including lumbar lordosis (LL), sacral slope (SS), pelvic incidence (PI)-LL, pelvic tilt (PT), L1 pelvic angle (L1PA) deviation from normal, T4 pelvic angle (T4PA), and T4-L1PA mismatch while PTCSA and NTPA only exhibited weak correlations (r < .30) with few alignment measures. Higher FI and lower PVBI were associated with reduced LL and SS, and increased PT, PI-LL, T4PA, and T4-L1PA mismatch. In patients ≥70, FI showed moderate correlations with LL and SS, while PVBI had limited relevance. In those <70, both FI and PVBI were associated with sagittal alignment.
Conclusions
FI and PVBI are the most relevant metrics for evaluating paralumbar muscle in ASD. FI appears more correlated in elderly patients.
Introduction
Adult spinal deformity (ASD) is characterized by a loss of the normal spinal alignment, 1 and can profoundly affect patients’ functional outcomes and quality of life.2-4 Various factors contribute to the development of ASD, including vertebral fractures, neurological dysfunction, postural changes, degenerative intervertebral disc alterations, and genetic predispositions.5,6 Recently, the association between spinal deformity and the paralumbar muscles has been an area of increasing research. While it remains unclear whether muscle degeneration causes or is caused by bony degeneration, several studies have established that increasing spinal malalignment is associated with worse muscle quality and size.7-9 Most likely, there is a reciprocal relationship 10 —as muscles weaken or atrophy, mild deformities could progress unchecked, underscoring the importance of their assessment in ASD patients. 11
Currently, approaches for evaluating paralumbar muscles in ASD patients vary widely, mainly focusing on muscle quality and quantity. When assessing muscle quality, the amount of fatty infiltration (FI) is a key indicator. This is commonly classified by the Goutallier system.12,13 Increased FI of paralumbar muscles has been associated with worsened lumbo-pelvic deformity 14 and severe sagittal imbalance. 15 When assessing muscle quantity, the most frequently utilized metric is cross-sectional area (CSA) of individual muscle bellies. It has been reported that CSA of paralumbar muscle (PTCSA) may closely correlate with coronal 16 and sagittal 15 Imbalance. Another metric utilized by some studies is the psoas vertebral body index (PVBI) by adjusting the CSA of the psoas with the vertebral body area for muscle quantity evaluation. 17 This index serves as an indicator of central sarcopenia, with lower values identified as independent risk factors for complications (eg, proximal junctional kyphosis, wound infection, and dural tear) in ASD patients undergoing pedicle subtraction osteotomy. 18 Similarly, other studies have used patient body height to normalize the CSA, resulting in the calculation of the normalized total psoas area (NTPA). This metric serves as an effective surrogate marker for diminished muscle quantity in studies involving ASD patients.6,19 However, the correlations among these assessment approaches remain unclear, and the optimal approach for evaluating reduced muscle health in ASD patients is undetermined. Until consensus is reached on a universally accepted parameter, clinicians and researchers will not be able to accurately aggregate data and compare interventions related to muscle health.
Thus, the purpose of this study was to identify which paralumbar muscle assessment measure correlates most strongly with sagittal malalignment in ASD patients.
Materials and Methods
Patient Enrollment
This was a single-center, retrospective, cross-sectional study. Inclusion criteria comprised of patients aged 18 years or older who underwent primary ASD surgery for coronal and/or sagittal malalignment between 2014 and 2023. Exclusion was based on 2 criteria: (1) history of previous spinal surgeries that included the paralumbar muscles and/or psoas, such as lateral lumbar interbody fusion or psoas tenotomy; and (2) active infection or malignancy.
Data Collection and Radiographic Analysis
Demographic data including age, sex, body mass index (BMI), and smoking status, diabetes and hypertension, osteoporosis, dyslipidemia, coronary artery disease, peripheral neuropathy, autoimmune disease, and anxiety were retrospectively retrieved from electronic medical records.
Assessment of Spinal Alignment
Preoperative standing lateral and posteroanterior (PA) full-length XRs were evaluated using standard radiographic measurements of spinopelvic parameters: (1) Maximum cobb angle; (2) Thoracic kyphosis (TK; angle between the upper endplate of T4 and the lower endplate of T12); (3) Lumbar lordosis (LL; angle between the upper endplate of L1 and S1); (4) Sacral slope (SS); (5) Pelvic incidence (PI); (6) Pelvic tilt (PT); (7) PI-LL; (8) Sagittal vertical axis (SVA); (9) L1 pelvic angle (L1PA); (10) T4 pelvic angle (T4PA); (11) the L1PA deviation from normal, calculated as L1PA – normal L1PA where normal L1PA was defined as 0.5 × PI–21°, 20 (12) the T4-L1PA mismatch, calculated as T4PA-L1PA.
Assessment of Lumbar Muscles
The quantity and quality of the spinal muscles were assessed using T2-weighted axial MRI images of the lumbar spine, specifically at or near the base of the L4 vertebral body.
Muscle qualitywas evaluated based on FI, classified according to the Goutallier classification system.12,13 T2 weighted axial plane images of L3-4 intervertebral disc level were used to evaluate the psoas. We observed that approximately 34.4% (40/116) of the patients demonstrated significant asymmetry in FI between the left and right sides. To enhance the accuracy of the FI assessment, the Goutallier classification was applied independently to each side of the psoas muscle, and the average score was then used as the final overall Goutallier score for further analysis (Figure 1A). Illustration of Muscle Parameter Measurements. (A) Muscle Quality: Psoas FI was Bilaterally Graded Using the Goutallier Classification, with the Average Score Defining the Final Level. (B) Muscle Quantity: PTCSA is the Sum of Left and Right Paraspinal Muscle CSAs; PVBI is the Sum of Left and Right Psoas CSAs Divided by the Vertebral Body CSA; NTPA is the Sum of Left and Right Psoas CSAs Divided by the Patient’s Height (mm) Squared. FI, Fatty Infiltration; CSA, Cross-Sectional Area; PTCSA, Paraspinal Total CSA; PVBI, Psoas Vertebral Body Index; NTPA, Normalized Total Psoas Area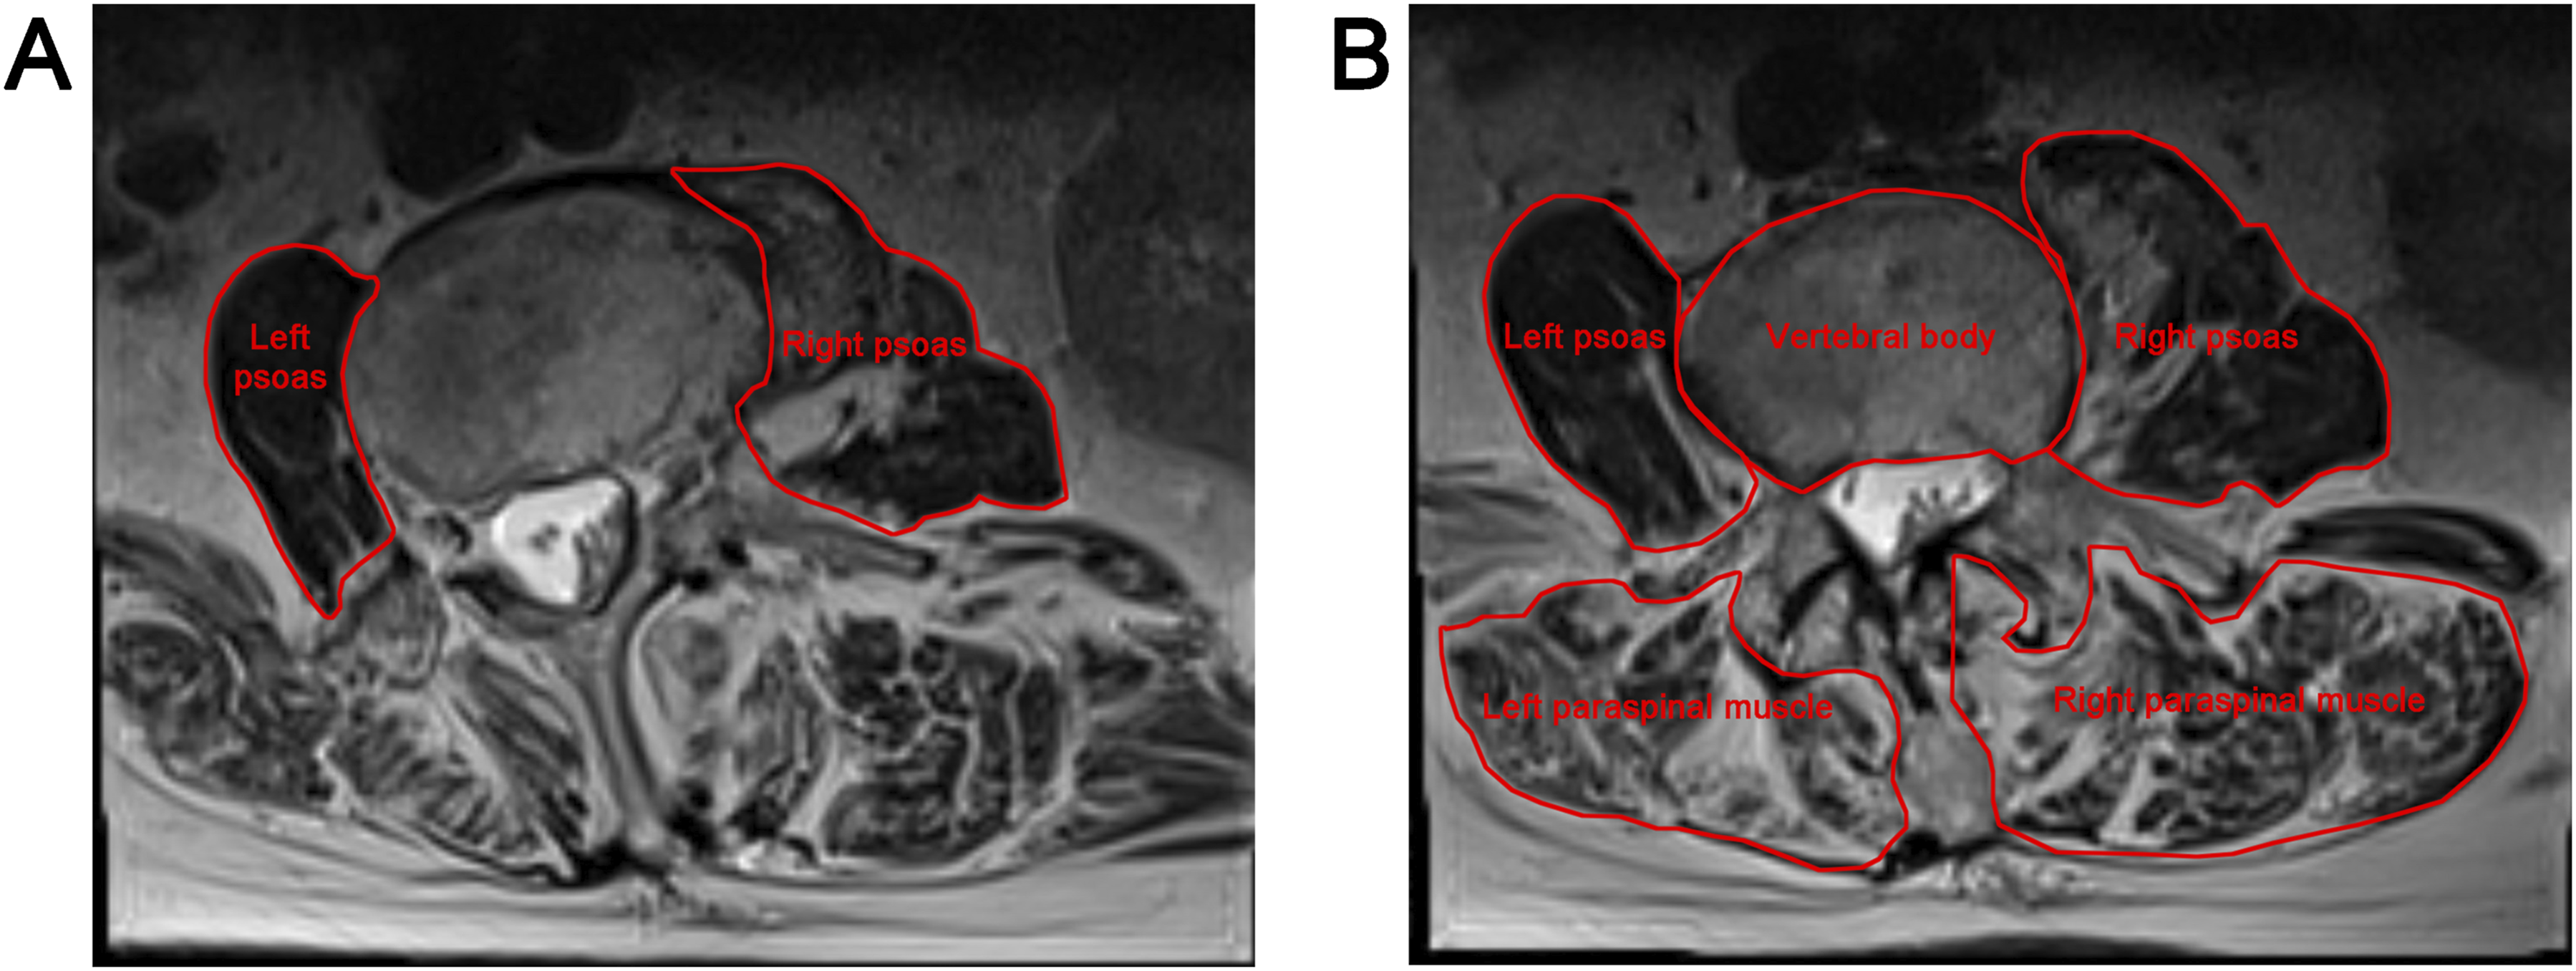
Muscle quantity was evaluated using the PTCSA PVBI, and NTPA parameters, measured on T2-weighted sagittal images in a supine position (Figure 1B). The CSA of the bilateral paralumbar muscles at L4 level was obtained from the first axial slice where both transverse processes were visible in the craniocaudal direction. PVBI was calculated by measuring the psoas muscle and the CSA of the L4 vertebral body, based on a single MRI axial slice at the level of the L4 pedicles,17,21 using the following formula: (Left psoas CSA + Right psoas CSA)/CSA of L4 vertebral body. NTPA at the L4 vertebral level was analyzed as described in our previous studies by measuring the CSA of the bilateral psoas muscles and normalizing it to the patient’s height (mm2/m2) to derive NTPA values. 19
All measurements were obtained using Sectra Workstation software (Model IDS7, Version 24.1, Linköping, Sweden). Two independent reviewers blinded to the clinical data, performed all measurements of spinal alignment and paralumbar muscle quality and quantity for each patient.
Statistical Analysis
The Kolmogorov-Smirnov test was applied to assess normality distribution for samples larger than 50, while the Shapiro-Wilk test was used for samples of 50 or fewer. Mean and standard deviation (SD) or median and interquartile range [IQR] is reported according to the distribution of the continuous data.
Correlation Analysis
The relationship between quality (FI) and quantity (PTCSA PVBI, and NTPA) of paralumbar muscles were evaluated. Furthermore, the relationship between spinal alignment parameters (Max cobb, TK, LL, SVA, SS, PI, and PT) and muscles evaluation methods (FI, PTCSA PVBI, and NTPA) were assessed. Pearson/Spearman’s rank correlation were performed to calculate the correlation coefficient (r) between the parameters depending on the distribution of the data. Correlation was defined as strong (|r| > .7), moderate (.4 < |r| < .7), weak (.1 < |r| < .4) or negligible (|r| < .1).
Subgroup Analysis
Two sub-analyses were conducted, one with regard to FI and the other to the PVBI, to further evaluate the association between changes in spinal alignment parameters with lumbar muscle quality and quantity. Within our cohort, we observed that only a small proportion of patients exhibited Goutallier Grade ≥1 for psoas FI, which is consistent with existing literature.7,22 Therefore, the degree of FI was classified into 3 subgroups: None FI (Goutallier Grade 0), Mild FI (Goutallier Grade 0.5), and Obvious FI (Goutallier Grade 1 or higher). The PVBI were subdivided into 3 groups, as follows: low group (≤mean-1/2 SD), standard group (mean ± 1/2 SD), and high group (≥mean + 1/2 SD). For the comparison among subgroups, either the one-way analysis of variance (ANOVA) or the Kruskal-Wallis test was applied, depending on the distribution characteristics of the data.
Age Stratified Analysis
Given the literature highlighting the advantages of assessing muscle quality in elderly patients, we further analyzed the correlations of spinal alignment with FI and PVBI, stratified by age. 23 Patients were stratified into groups over and under 70 years, and correlations were assessed within each group using Pearson/Spearman’s rank methods.
Statistical Significance and Software
Statistical significance was defined as P-value <.05. All statistical analyses were performed using IBM SPSS Statistics (version 22.0; IBM).
Results
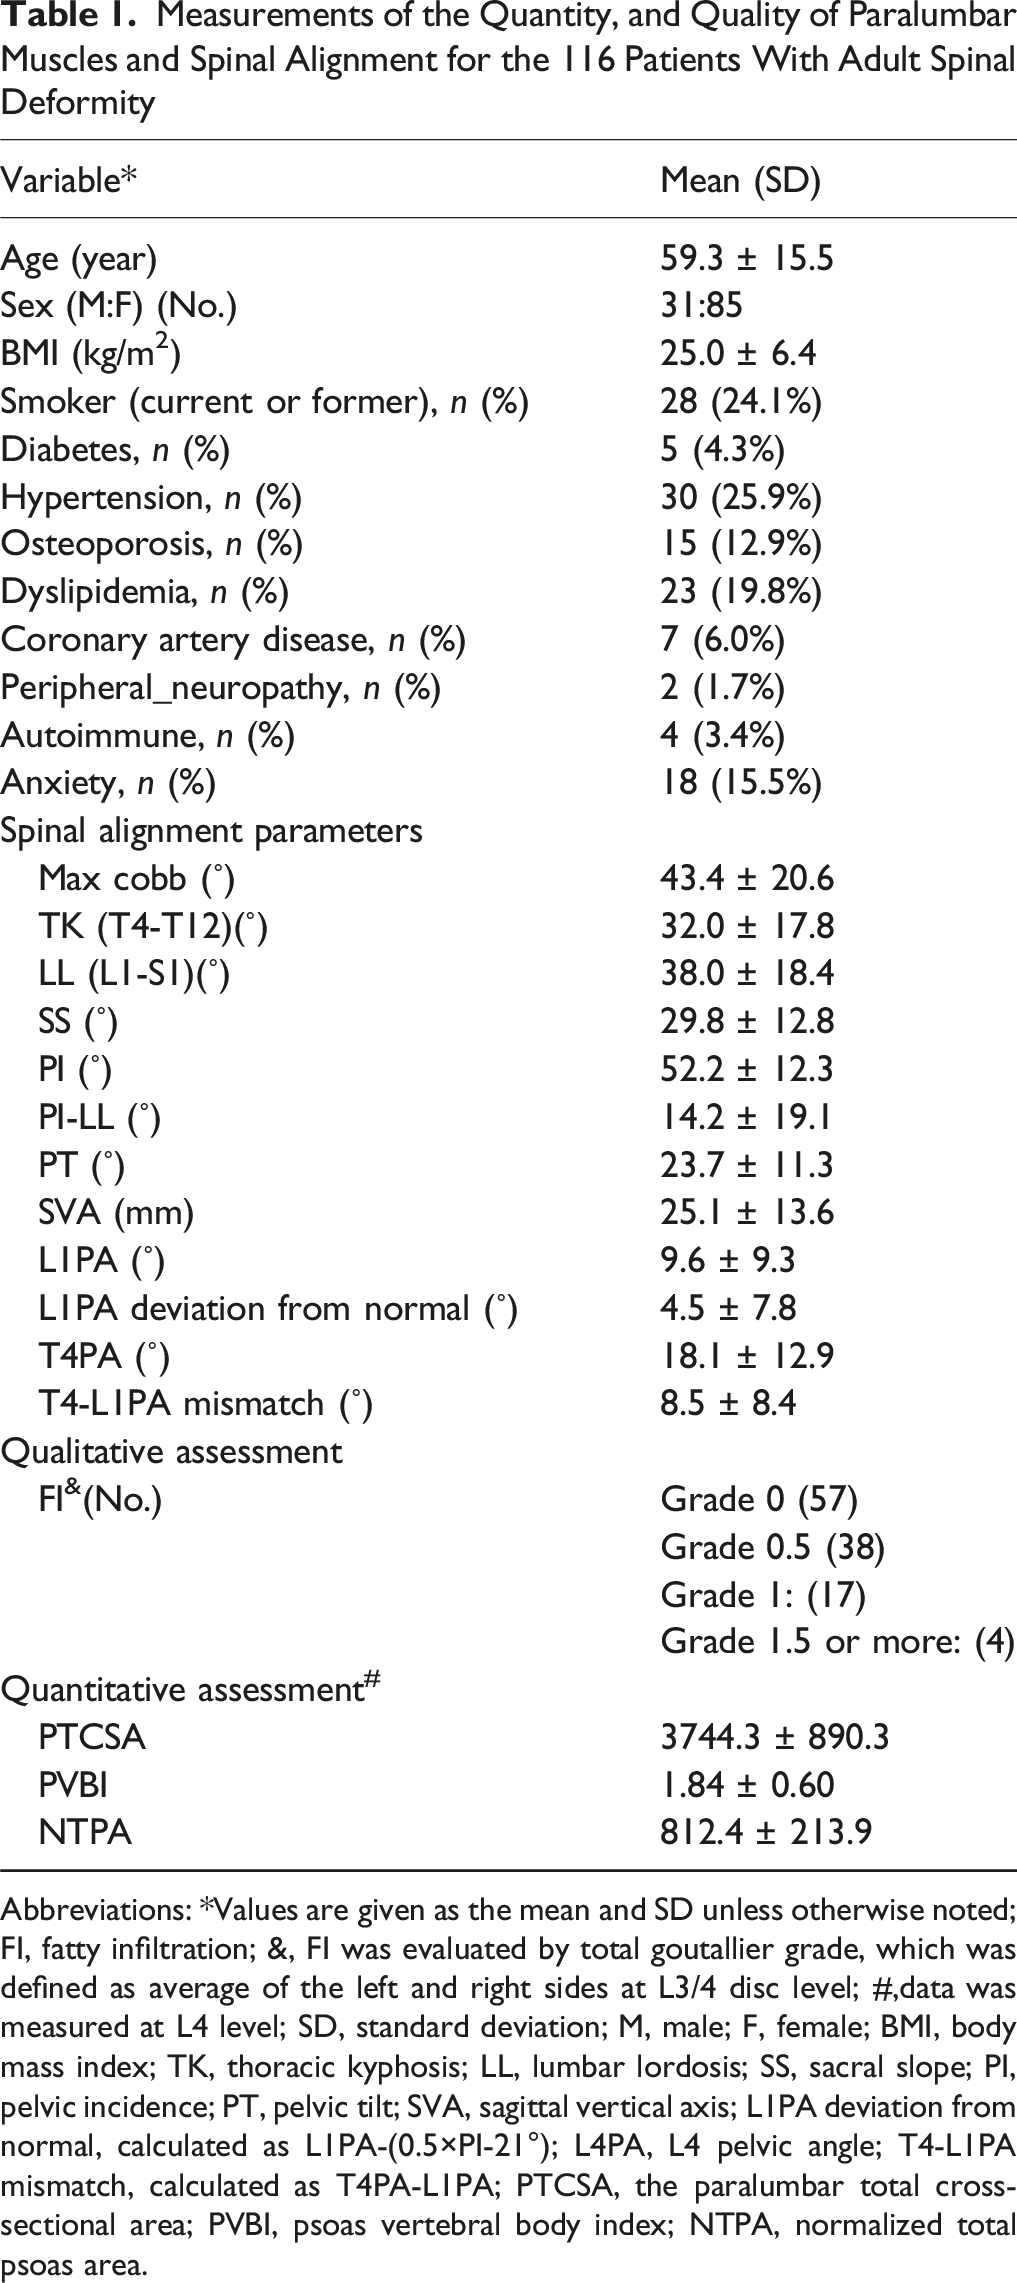
A total of 116 patients (73.3% female) with ASD, averaging 59.3 ± 15.5 years of age and a mean BMI of 25.0 ± 6.4 kg/m2, met the inclusion criteria and were included in the analysis (Figure 2). The patient demographics, radiographic measurements of spinal alignment, and mean quantitative, and qualitative measurements of paravertebral muscles are reported in Table 1. A Flow Diagram Depicting the Processes of Patients’ Inclusion and Exclusion Measurements of the Quantity, and Quality of Paralumbar Muscles and Spinal Alignment for the 116 Patients With Adult Spinal Deformity Abbreviations: *Values are given as the mean and SD unless otherwise noted; FI, fatty infiltration; &, FI was evaluated by total goutallier grade, which was defined as average of the left and right sides at L3/4 disc level; #,data was measured at L4 level; SD, standard deviation; M, male; F, female; BMI, body mass index; TK, thoracic kyphosis; LL, lumbar lordosis; SS, sacral slope; PI, pelvic incidence; PT, pelvic tilt; SVA, sagittal vertical axis; L1PA deviation from normal, calculated as L1PA-(0.5×PI-21°); L4PA, L4 pelvic angle; T4-L1PA mismatch, calculated as T4PA-L1PA; PTCSA, the paralumbar total cross-sectional area; PVBI, psoas vertebral body index; NTPA, normalized total psoas area.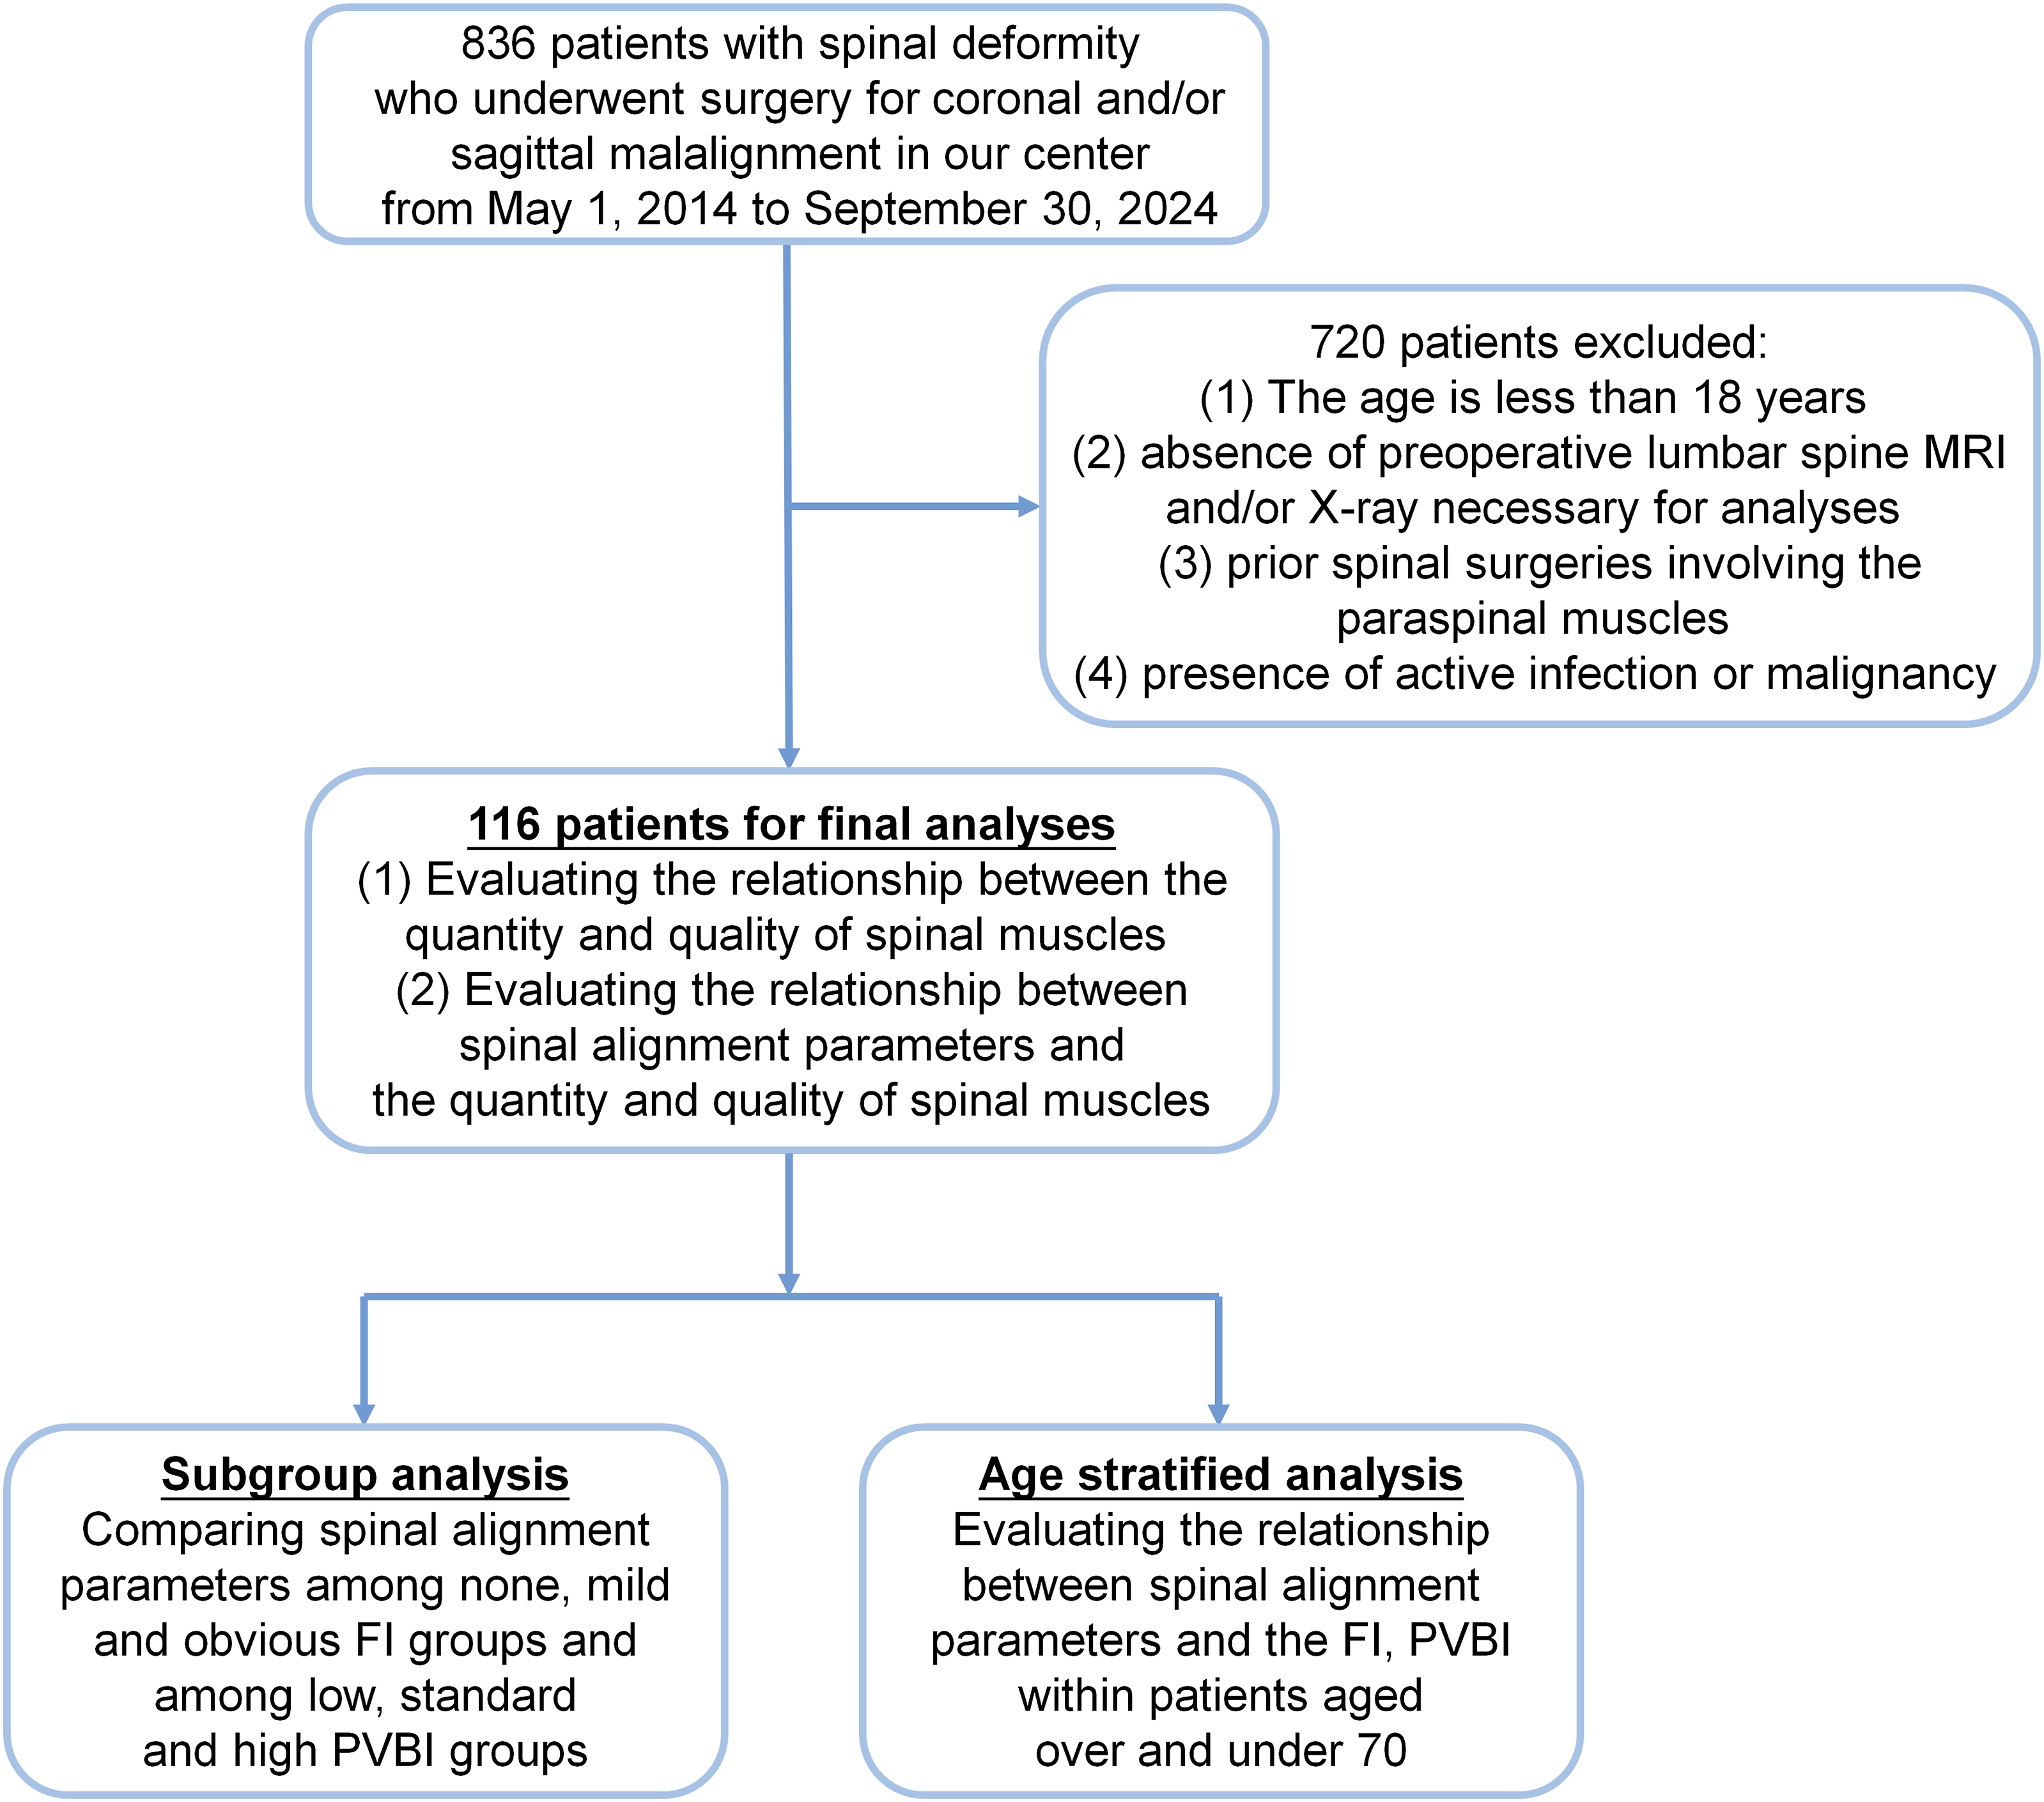
Relationship Between Quantity and Quality of Paralumbar Muscles
Spearman or Pearson Correlation of the Quantity, and Quality of Paralumbar Muscles
Abbreviations: FI, fatty infiltration; &, FI was evaluated by total goutallier grade, which was defined as average of the left and right sides at L3/4 disc level; #,data was measured at L4 level; PTCSA, the paralumbar total cross-sectional area; PVBI, psoas vertebral body index; NTPA, normalized total psoas area; *, Pearson correlation coefficient; $, Spearman’s rank correlation coefficient; The correlations with significance (P < .05) were highlighted with bold.
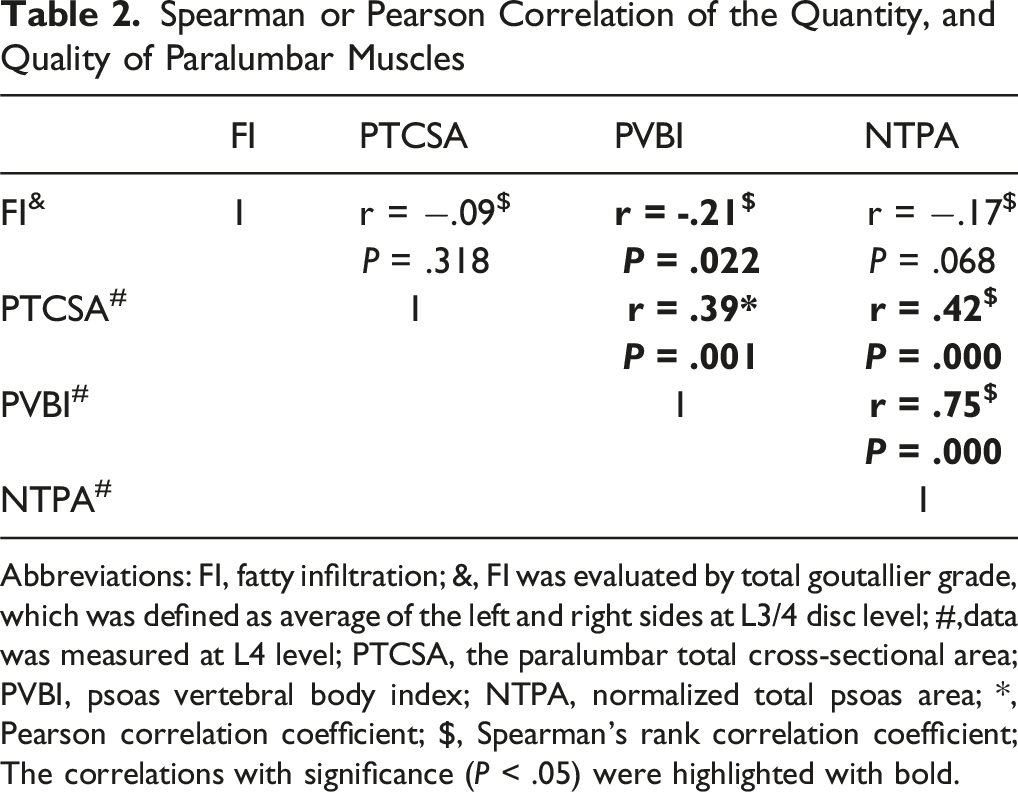
However, a significant positive correlation was identified between each pair of the 3 quantitative muscle assessment measures (Table 2). NTPA was found to have a strongest positive correlation with PVBI (R = .75; P < .001) (Table 2).
Relationship Between Spinal Alignment and Paralumbar Muscles
Spearman or Pearson Correlation of the Quantity, and Quality of Paralumbar Muscles and Radiological Parameters of Spinal Alignment
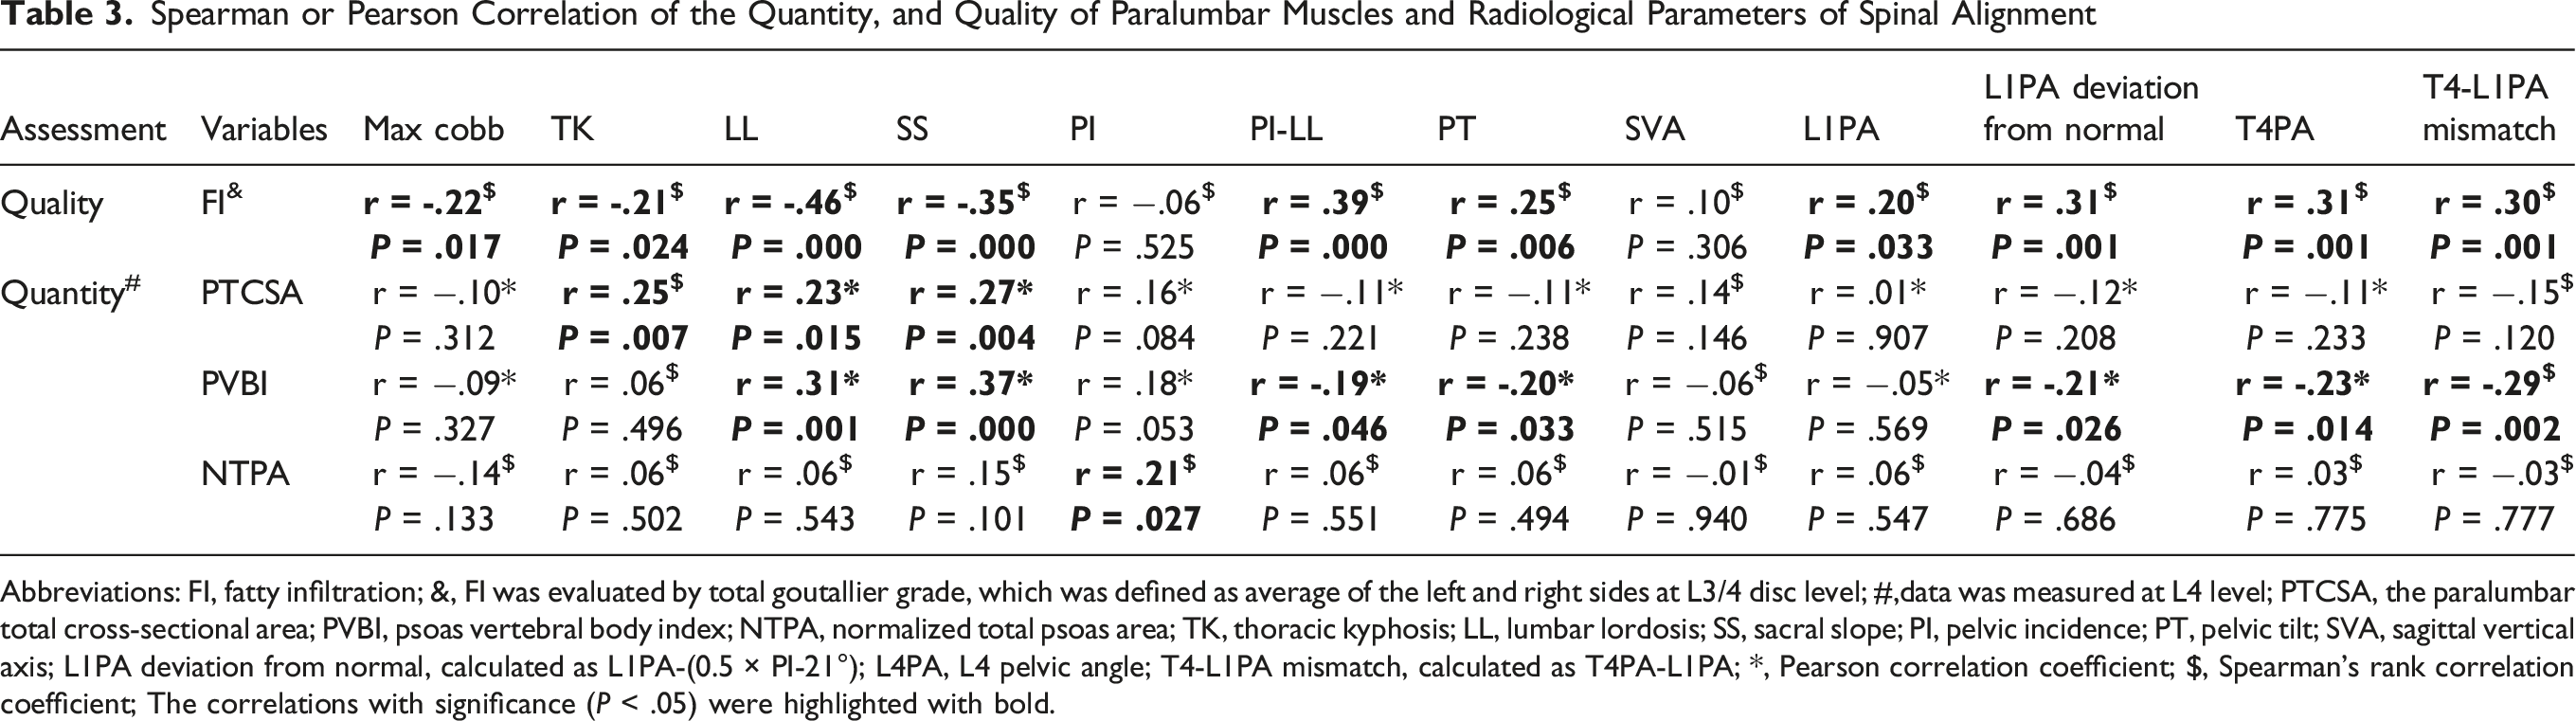
Abbreviations: FI, fatty infiltration; &, FI was evaluated by total goutallier grade, which was defined as average of the left and right sides at L3/4 disc level; #,data was measured at L4 level; PTCSA, the paralumbar total cross-sectional area; PVBI, psoas vertebral body index; NTPA, normalized total psoas area; TK, thoracic kyphosis; LL, lumbar lordosis; SS, sacral slope; PI, pelvic incidence; PT, pelvic tilt; SVA, sagittal vertical axis; L1PA deviation from normal, calculated as L1PA-(0.5 × PI-21°); L4PA, L4 pelvic angle; T4-L1PA mismatch, calculated as T4PA-L1PA; *, Pearson correlation coefficient; $, Spearman’s rank correlation coefficient; The correlations with significance (P < .05) were highlighted with bold.
FI showed a moderate negative correlation with LL (r = −.46, P < .001). It also demonstrated a weak negative correlation with Max Cobb angle (r = −.22, P = .017), TK (r = −.21, P = .024) and SS (r = −.35, P < .001) and a weak positive association with PT (r = .25, P = .006), PI-LL (r = .39, P = .000), L1PA (r = .20, P = .033), L1PA deviation from normal (r = .31, P = .001), T4PA (r = .31, P = .001), and T4-L1PA mismatch (r = .30, P = .001).
For muscle quantity, PVBI was significantly correlated with multiple spinal alignment parameters including LL (r = .31, P = .001), SS (r = .37, P < .001), PT (r = −.20, P = .033), PI-LL (r = −.19, P = .046), L1PA deviation from normal (r = −.21, P = .026), T4PA (r = −.23, P = .014), and T4-L1PA mismatch (r = −.29, P = .002). PTCSA and NTPA demonstrated weaker correlations with a limited number of sagittal alignment (r < .30) (Table 3).
Subgroup Analyses of the Influence of FI and PVBI on Spinal Alignment
Comparisons of Radiological Parameters of Spinal Alignment in Subdividing Three FI Groups
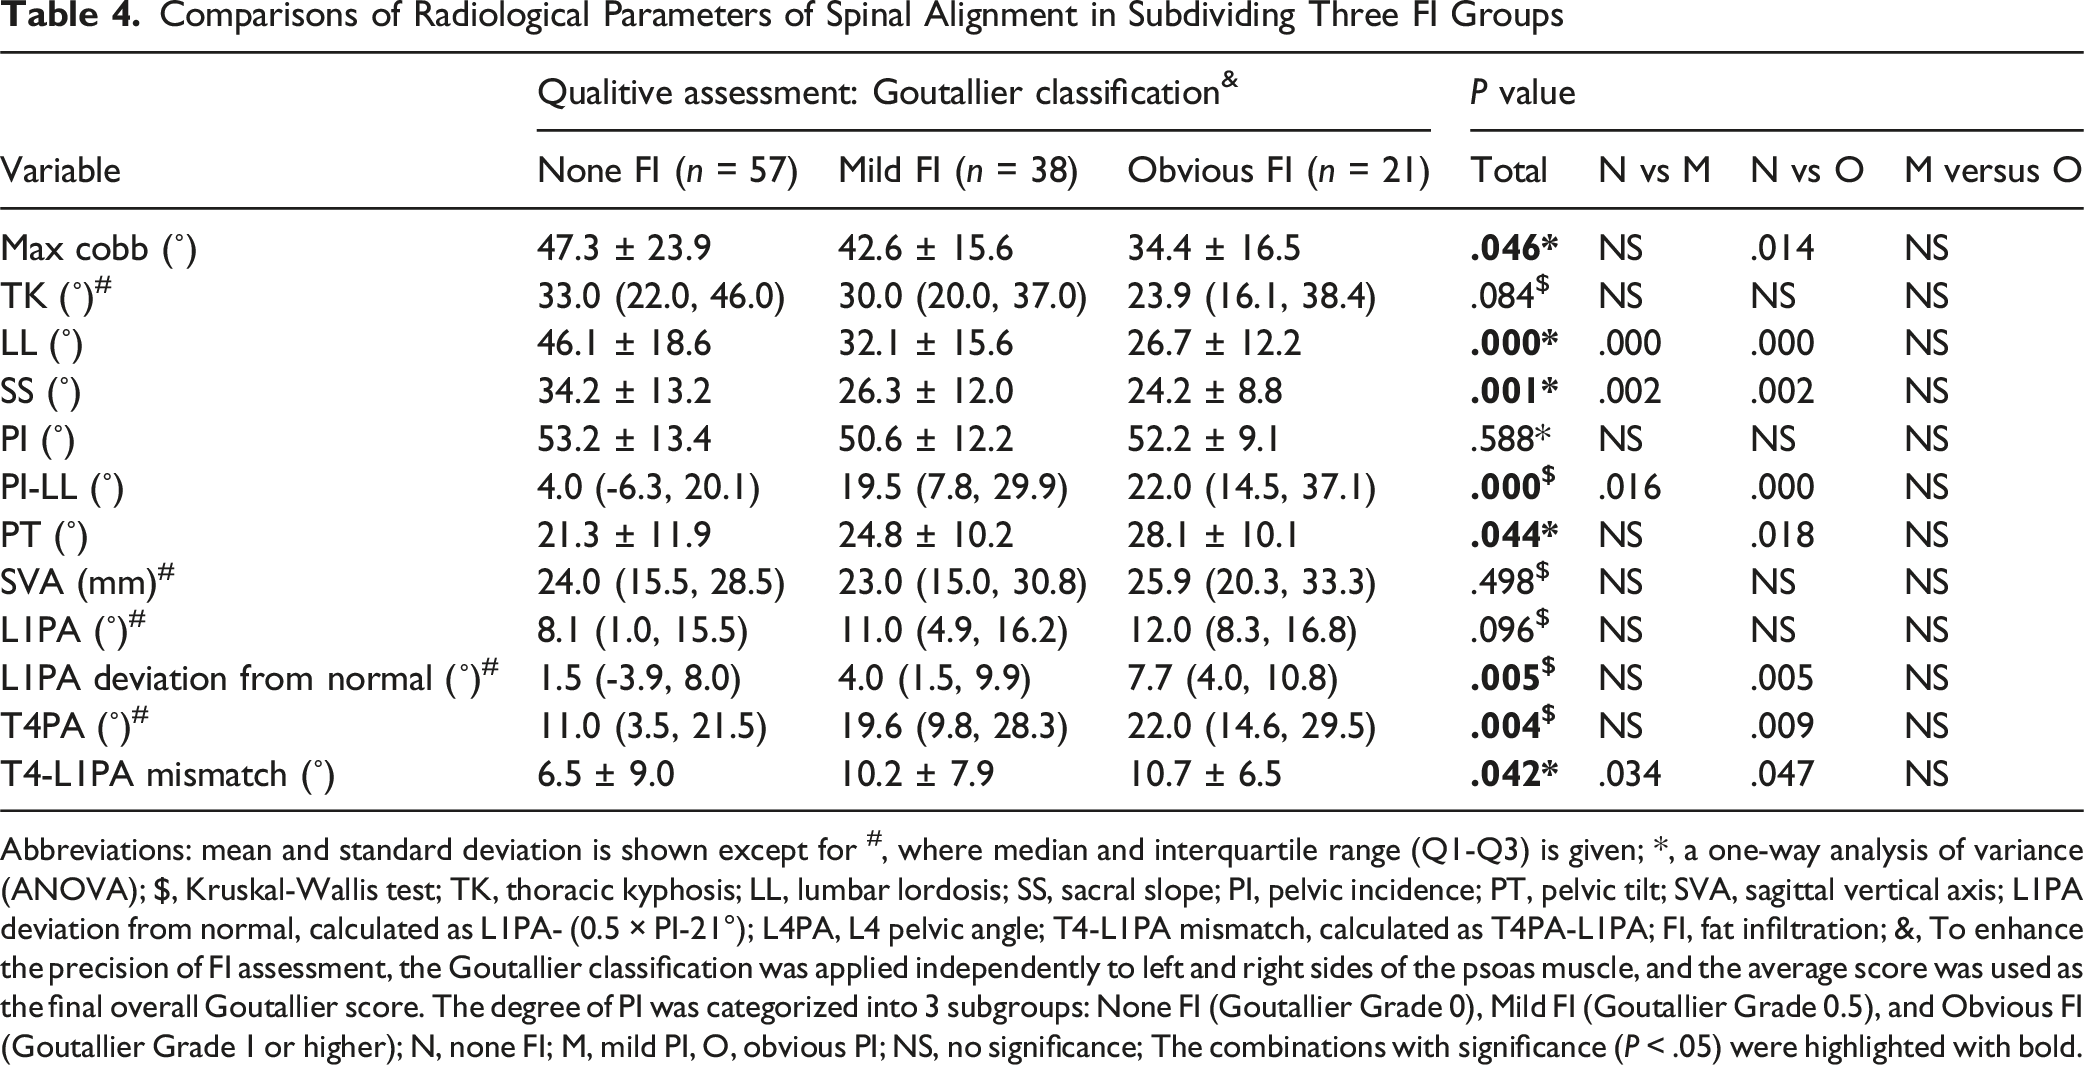
Abbreviations: mean and standard deviation is shown except for #, where median and interquartile range (Q1-Q3) is given; *, a one-way analysis of variance (ANOVA); $, Kruskal-Wallis test; TK, thoracic kyphosis; LL, lumbar lordosis; SS, sacral slope; PI, pelvic incidence; PT, pelvic tilt; SVA, sagittal vertical axis; L1PA deviation from normal, calculated as L1PA- (0.5 × PI-21°); L4PA, L4 pelvic angle; T4-L1PA mismatch, calculated as T4PA-L1PA; FI, fat infiltration; &, To enhance the precision of FI assessment, the Goutallier classification was applied independently to left and right sides of the psoas muscle, and the average score was used as the final overall Goutallier score. The degree of PI was categorized into 3 subgroups: None FI (Goutallier Grade 0), Mild FI (Goutallier Grade 0.5), and Obvious FI (Goutallier Grade 1 or higher); N, none FI; M, mild PI, O, obvious PI; NS, no significance; The combinations with significance (P < .05) were highlighted with bold.
Comparisons of Radiological Parameters of Spinal Alignment in Subdividing Three PVBI Groups
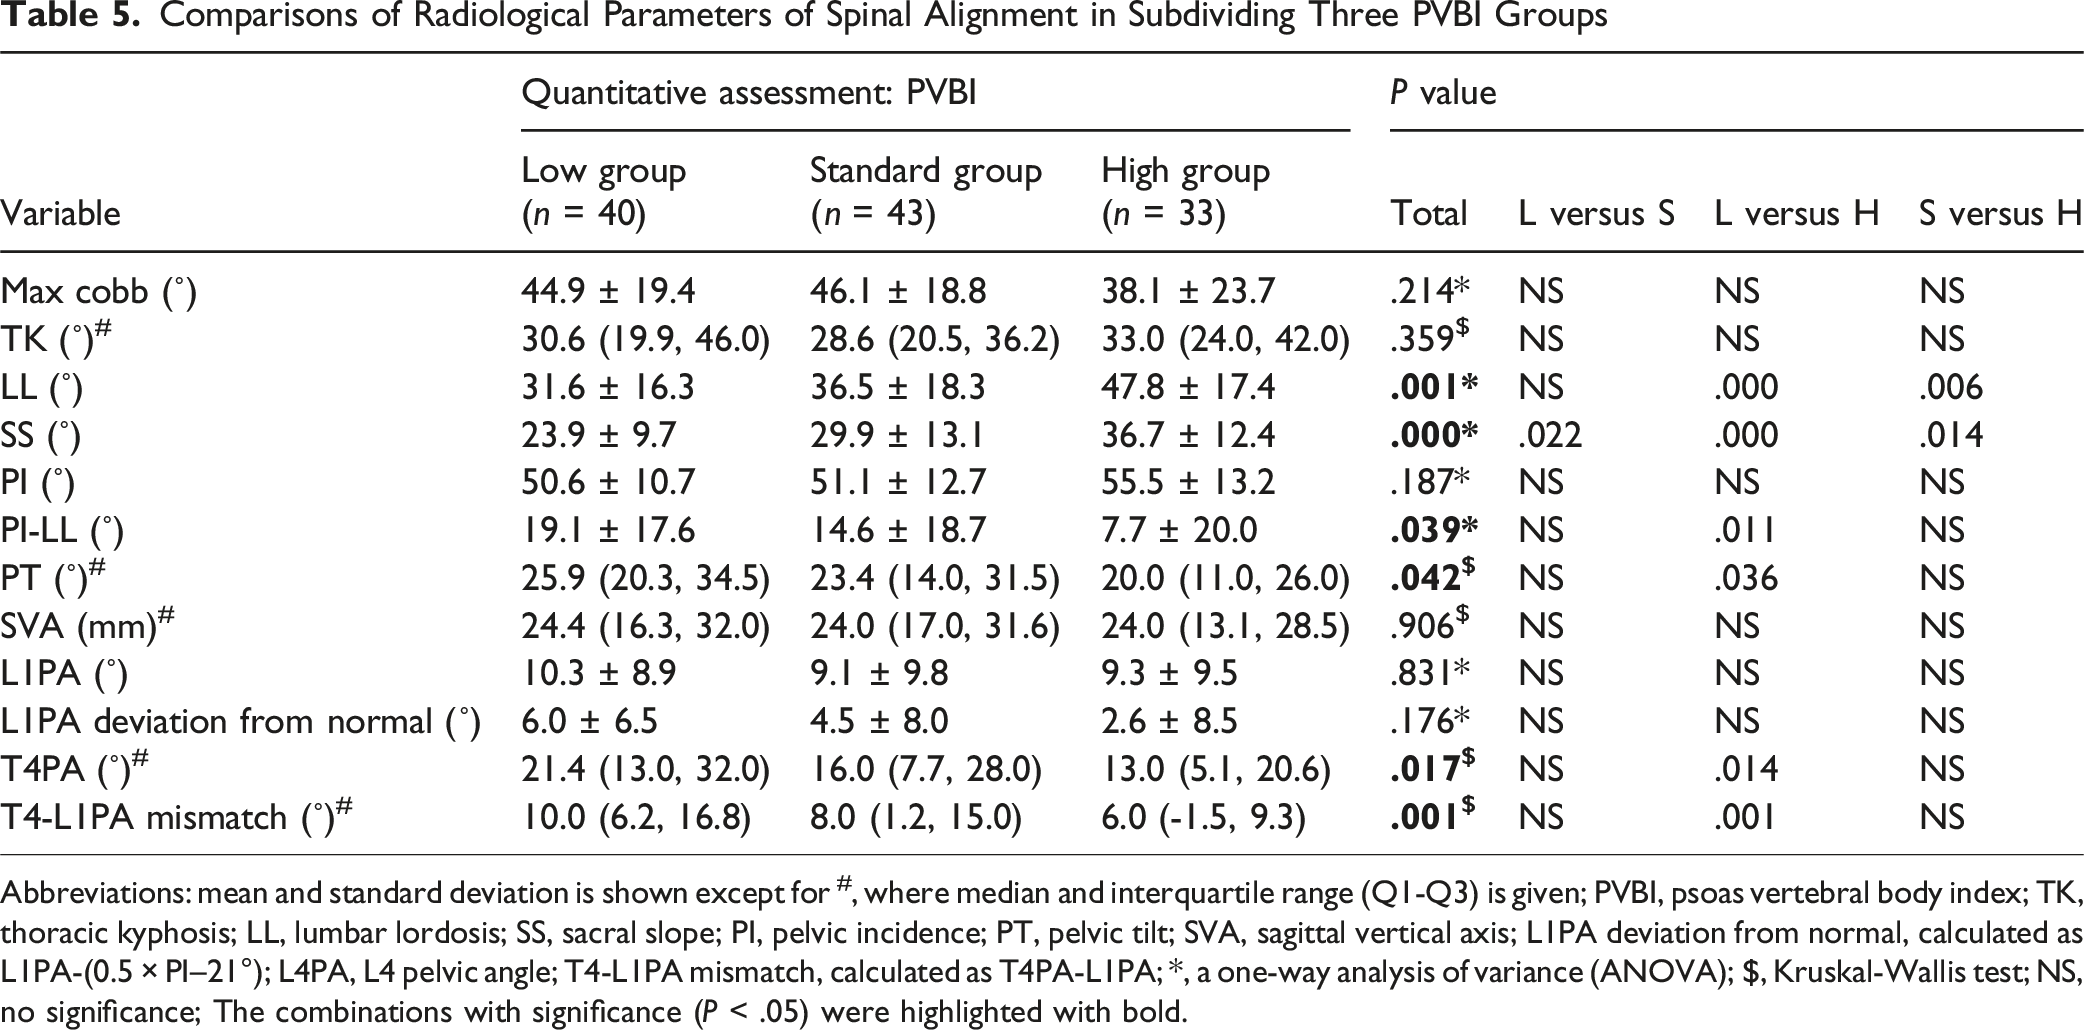
Abbreviations: mean and standard deviation is shown except for #, where median and interquartile range (Q1-Q3) is given; PVBI, psoas vertebral body index; TK, thoracic kyphosis; LL, lumbar lordosis; SS, sacral slope; PI, pelvic incidence; PT, pelvic tilt; SVA, sagittal vertical axis; L1PA deviation from normal, calculated as L1PA-(0.5 × PI–21°); L4PA, L4 pelvic angle; T4-L1PA mismatch, calculated as T4PA-L1PA; *, a one-way analysis of variance (ANOVA); $, Kruskal-Wallis test; NS, no significance; The combinations with significance (P < .05) were highlighted with bold.
Age-Stratified Analysis of the Relationship Between PVBI, FI, and Spinal Alignment
Spearman or Pearson Correlation of the FI, and PVBI of Paralumbar Muscles and Radiological Parameters of Spinal Alignment Stratified by Age
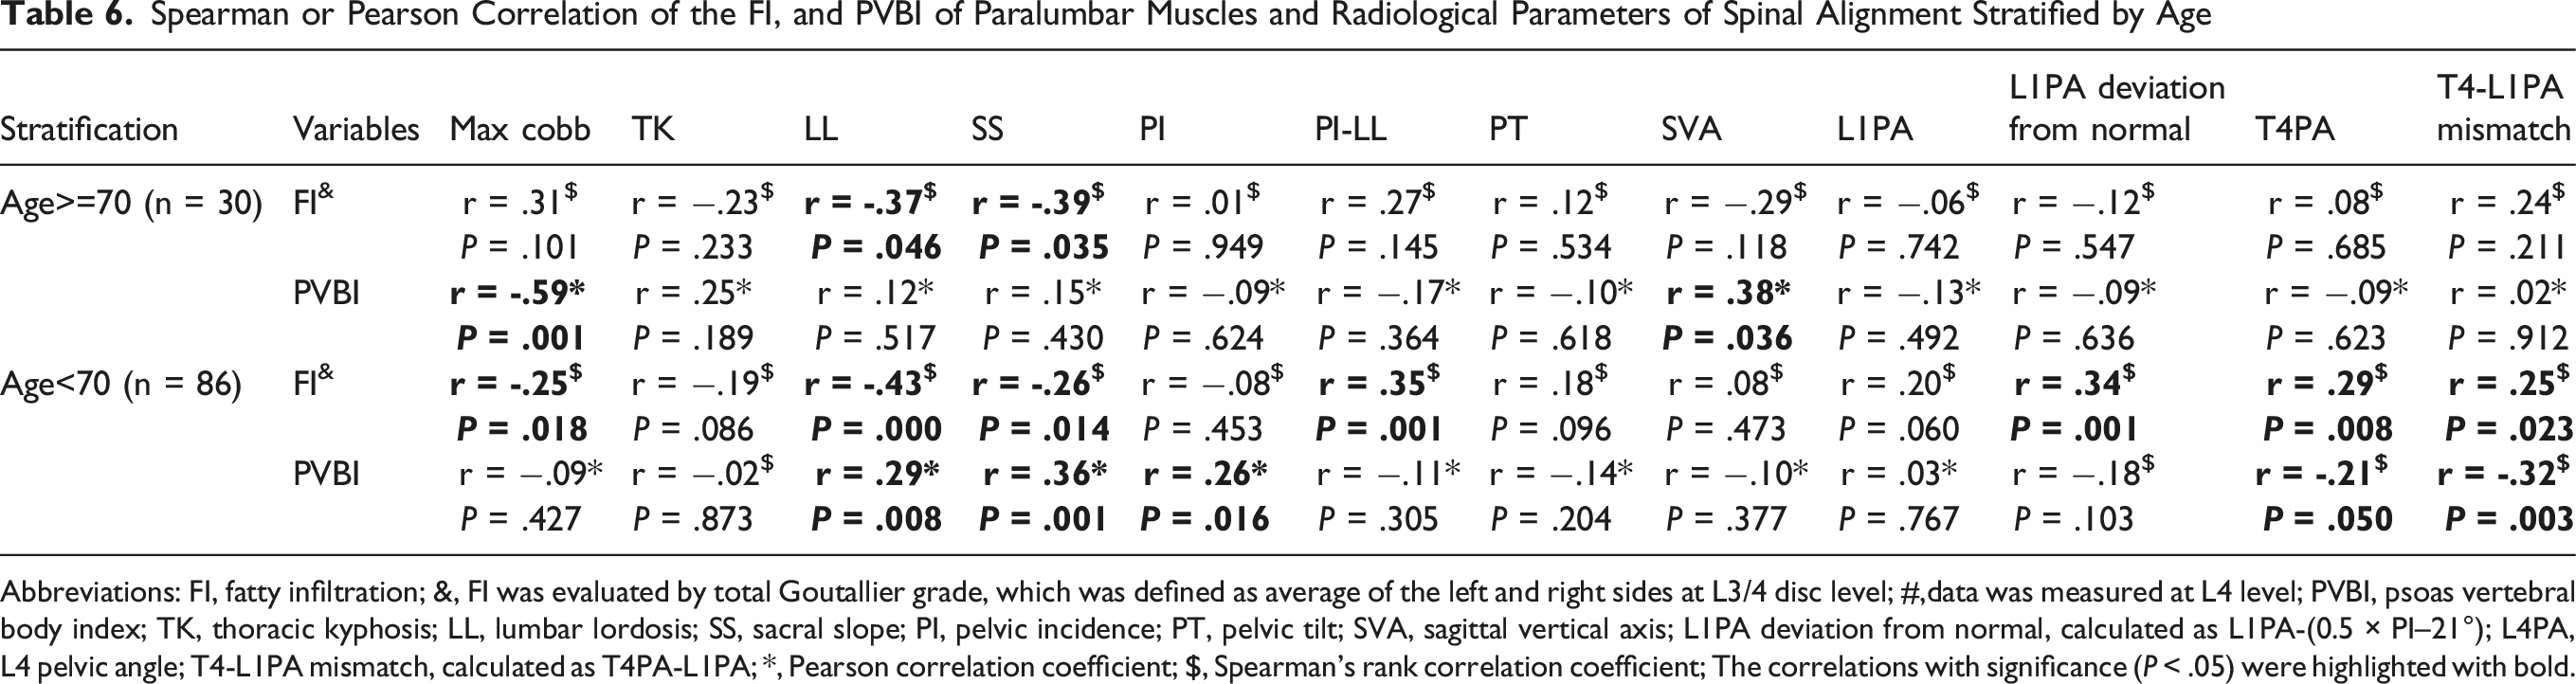
Abbreviations: FI, fatty infiltration; &, FI was evaluated by total Goutallier grade, which was defined as average of the left and right sides at L3/4 disc level; #,data was measured at L4 level; PVBI, psoas vertebral body index; TK, thoracic kyphosis; LL, lumbar lordosis; SS, sacral slope; PI, pelvic incidence; PT, pelvic tilt; SVA, sagittal vertical axis; L1PA deviation from normal, calculated as L1PA-(0.5 × PI–21°); L4PA, L4 pelvic angle; T4-L1PA mismatch, calculated as T4PA-L1PA; *, Pearson correlation coefficient; $, Spearman’s rank correlation coefficient; The correlations with significance (P < .05) were highlighted with bold.
In patients under 70, FI continued to exhibit significantly negative correlations with LL (r = −.43, P < .001) and SS (r = −.26, P = .014). Besides, FI showed a significantly positive associations with PI-LL (r = .35, P = .001), L1PA deviation from normal (r = .34, P = .001), T4PA (r = .29, P = .008), and T4-L1PA mismatch (r = .25, P = .023). Meanwhile, PVBI was positively correlated with multiple sagittal alignment parameters, including LL (r = .29, P = .008), SS (r = .36, P = .001), and PI (r = .26, P = .016), but not with SVA, and negatively correlated with T4PA (r = −.21, P = .050), and T4-L1PA mismatch (r = −.32, P = .003) (Table 6).
Discussion
Paralumbar muscles play a crucial role in maintaining spinal alignment in ASD patients, highlighting the importance of their assessment. 11 However, current studies of ASD use diverse metrics, including evaluations of muscle quality via FI6,14,15 and muscle quantity through various metrics like PTCSA, 24 PVBI, 17 and NTPA.6,19 The heterogeneity in muscle metric definitions confounds our ability to compare findings across studies. In this retrospective cross-sectional study, we explored and compared the relationships between these approaches and spinal alignment in ASD patients. First, we found that muscle quantity and quality did not correlate. Second, we found that FI and PVBI exhibited the strongest correlations with spinal alignment parameters. These correlations were notably stronger than those found for PTCSA and NTPA, suggesting that FI and PVBI serve as superior indicators for assessing muscle deterioration in ASD patients.
Considering that generalized sarcopenia has a variety of definitions,25,26 recent research has focused on local paralumbar musculature, which can be opportunistically measured on standard preoperative imaging.6,27 Given the reliability of measurements at the L4 vertebral level23,28 and known differences in muscularity between degenerative lumbar flatback patients and healthy controls, 29 we focused on evaluating muscle parameters at this level in relation to spinal alignment. We first investigated whether the qualitative assessment of paralumbar muscle by FI was associated with measures of muscle quantity parameters, finding no correlation between the 2 (Table 2). This is consistent with existing literature which has shown no association between FI and volume of paralumbar muscles in elderly patients with diverse spinal degenerative diseases observed.23,30 The findings from this study suggest that muscle quality measurements are not directly linked to the quantity of muscles. This reinforces the notion that any assessment of muscle health must include measures of both quality and quantity.
We used FI, graded using the Goutallier classification, to assess muscle quality, observing that patients with higher FI of the psoas was associated with reduced LL and SS and increased PT, PI-LL, L1PA deviation from normal, T4PA, and T4-L1PA mismatch (Table 4). This is in line with previous literatures showing that increased FI into lumbar paravertebral muscles may contribute to the lumbo-pelvic deformity 14 and significant sagittal imbalance. 15 However, the Goutallier classification is likely an imperfect method to evaluate muscle quality, as this classification uses categorizations rather than continuous metrics, and is not based on lumbar muscle assessment. Thus, while this remains a “quick and dirty” method to assess muscle quality, more specific and detailed measures must be developed. Future research should be directed at improving imaging modalities directed specifically at muscle quality. To this end, quantitative MRI (qMRI) may be a promising imaging modality that can differentiate varying degrees of muscle fiber quality. 31
In terms of evaluating muscle quantity, PVBI, calculated by normalizing CSA by vertebral body area, was shown to have the strongest association with spinal alignment metrics (Table 3). Lower PVBI values were linked to reduced LL and SS, and increased PT, PI-LL, T4PA, and T4-L1PA mismatch (Table 5). Although muscle mass is correlated with body size, it remains unclear whether normalization of paralumbar muscle CSA is necessary.32,33 In this study, non-normalized paralumbar muscle CSA (PTCSA) showed only a weak association with certain spinal alignment parameters (r < .3), and NTPA, calculated by adjusting CSA by height, was not significantly correlated with most spinal alignment parameters (Table 3). These findings are consistent with previously published literature.7,34 Therefore, we propose PVBI as the optimal representative measure for muscle quantity assessment in research on spinal alignment in patients with ASD.
Based on the outcomes, this study emphasizes the clinical relevance of FI and PVBI, which best reflect muscle quality and quantity, respectively, as key targets for preoperative optimization in ASD patients. Interventions to reduce FI or increase PVBI, including resistance training, protein supplementation, or neuromuscular reactivation, may enhance postoperative alignment and recovery. These parameters may also help identify patients who would benefit from a dedicated prehabilitation program before deformity correction. Furthermore, FI and PVBI could be incorporated into preoperative assessment models to stratify surgical candidacy, particularly by identifying patients at higher risk of suboptimal outcomes due to poor muscle health. Such stratification may inform decisions on surgical extent, timing, or the need for adjunctive interventions.
Previous studies have reported that in elderly patients with various degenerative spinal conditions, paralumbar muscle quality, evaluated by FI, is more strongly correlated with sagittal alignment than muscle quantity, measured by PVBI. 23 This led us to further explore age-specific applicability of FI and PVBI. Our findings indicate that in patients over 70, FI shows a significant correlation (r > .3) with sagittal alignment parameters, specifically SS and LL, while PVBI demonstrates only limited associations (Table 6). Conversely, in patients under 70, both FI and PVBI are applicable. These findings might attribute to age-related changes in muscle composition and functionality. In elderly patients, paralumbar muscle tissue often exhibits increased FI and atrophy, thus muscle quality (as assessed by FI) may more accurately reflect the degree of muscle degeneration,14,35 which impacts spinal stability and alignment.16,36 In younger patients, the PVBI, an indicator of muscle quantity, may be able to accurately reflect the muscle’s functional capacity to support spinal alignment, as they typically retain greater muscle mass and experience less FI. 37 This finding may also be interpreted as representative of differing etiologies in spinal deformity in the elderly vs younger patients. Specifically, elderly patients may experience more of a “degenerative sarcopenia”, 38 while younger patients with spinal deformities may be subject to a “relative sarcopenia”, where the muscle mass itself is insufficient. 39 Determining the causal nexus between spinal deformity and muscle degeneration will be the “holy grail” of muscle-directed research.
This study has several limitations. First, its retrospective and cross-sectional nature limits the ability to establish causative relationships between muscle health and spinal alignment. Some studies speculated that back muscle atrophy and spinal deformities may have a mutually reinforcing relationship, where each condition exacerbates the other. 10 Prospective longitudinal studies would be valuable to further determining whether changes in FI and PVBI precede or result from alignment deterioration, but such studies would be exceedingly difficult to conduct, requiring large enrollments and decades of follow up. Second, as a retrospective radiographic study, patient-reported outcome measures (eg, ODI, SF-36, PROMIS) were not included in our analysis due to partially missing data. Although the relationship between lumbar muscle impairment and ASD patient-reported outcomes is well-established in the literature,18,19,40-43 its exclusion from our analysis limits our ability to present a holistic view of the patients’ condition. Third, we observed very little FI in the psoas among most patients, aligning with previous findings.7,22 Due to the lack of type III and IV patients, further research is needed to better understand the relationship between FI and spinal alignment. Fourth, this study relied on univariate analyses to assess the associations between muscle parameters and spinal alignment. Due to partially missing data, we were unable to perform multivariate analyses. As a result, potential confounding factors such as BMI, osteoporosis, and gender could not be adequately controlled, which may limit the interpretability of our findings.
Conclusions
In conclusion, this study highlights FI and PVBI as valuable metrics for assessing muscle impairment and its association with spinal alignment in ASD patients. Importantly, we show that muscle quality and quantity are independent of each other. We recommend utilizing FI for quality assessment and PVBI for quantity assessment as primary metrics for paralumbar muscle evaluations in ASD patients. Future research should be directed at improving imaging modalities that can offer more accurate assessments of muscle degeneration. While these studies would face significant hurdles, there is a need for longitudinal prospective studies to ultimately determine the causal nexus between muscle health and the development of sagittal spinal malalignment. Besides, future research on muscle-targeted therapies should increasingly focus on monitoring and enhancing muscle FI and PVBI.
Footnotes
ORCID iDs
Funding
The authors disclosed receipt of the following financial support for the research, authorship, and/or publication of this article: However, data was collected and managed using REDCap (Research Electronic Data Capture) hosted at Weill Cornell Medicine Clinical and Translational Science Center supported by the National Center For Advancing Translational Science of the National Institute of Health under award number: UL1 TR002384.
Declaration of conflicting interests
The authors declared no potential conflicts of interest with respect to the research, authorship, and/or publication of this article.
IRB Approval
This study protocol was conducted in accordance with the Declaration of Helsinki and received approval from the local institutional review board (Approval No: 2018-1599) with an exemption from requiring informed consent owing to the retrospective observational design of the study.
Disclosures
Han Jo Kim has the following disclosures: Royalties: Acuity Surgical, Aspen Medical, Highridge Medical, K2 Medical, Stryker. Consulting: Alphatec Spine, Aspen Medical, Blackstone, Highridge Medical, Mirus, SI-Bone. Ownership Interest: HS2, Spine Stud. Speakers Bureau: K2 Medical. Stock: Globus. Grant: ISSGF; Fellowship Support: AO Spine.
Francis C. Lovecchio has the following disclosures: Consultant: SeaSpine; Consultant: SI-Bone.