
Abstract
Study design:
Retrospective study at a unique center.
Objective:
The aim of this study is twofold, to develop a virtual patients model for lumbar decompression surgery and to evaluate the precision of an artificial neural network (ANN) model designed to accurately predict the clinical outcomes of lumbar decompression surgery.
Methods:
We performed a retrospective study of complete Electronic Health Records (EHR) to identify potential unfavorable criteria for spine surgery (predictors). A cohort of synthetics EHR was created to classify patients by surgical success (green zone) or partial failure (orange zone) using an Artificial Neural Network which screens all the available predictors.
Results:
In the actual cohort, we included 60 patients, with complete EHR allowing efficient analysis, 26 patients were in the orange zone (43.4%) and 34 were in the green zone (56.6%). The average positive criteria amount for actual patients was 8.62 for the green zone (SD+/- 3.09) and 10.92 for the orange zone (SD 3.38). The classifier (a neural network) was trained using 10,000 virtual patients and 2000 virtual patients were used for test purposes. The 12,000 virtual patients were generated from the 60 EHR, of which half were in the green zone and half in the orange zone. The model showed an accuracy of 72% and a ROC score of 0.78. The sensitivity was 0.885 and the specificity 0.59.
Conclusion:
Our method can be used to predict a favorable patient to have lumbar decompression surgery. However, there is still a need to further develop its ability to analyze patients in the “failure of treatment” zone to offer precise management of patient health before spinal surgery.
Keywords
Introduction
Lumbar spinal disorders are among the most disabling conditions, particularly in developed countries, due to the increase in sedentary lifestyles and aging populations. 1
When conservative treatment is insufficient or pharmaceutical options show too many secondary effects (dependency, misuse), surgery is a valid option to relieve pain and improve function.2-4
However, patient selection remains very complex and the benefits of surgical interventions sometimes uncertain. 5 Indeed, between 2 and 23% of patients having back surgery will present an adverse event or a complication after surgery.6,7
Around 30% to 50% of patients will not be—or only slightly—relieved—by the surgical act, and will maintain their intake of morphine, with the side effects and the costs that this entails 8
Surgery success is well evaluated by validated indicators such as patient-reported outcomes measures (PROMS). 9 This protocol is based on the standardized collection of patient well-being and health status after a surgical procedure. It is used on large cohorts to study a set of factors participating in clinical outcomes after surgical treatment (see Table 1.).
Predictors.
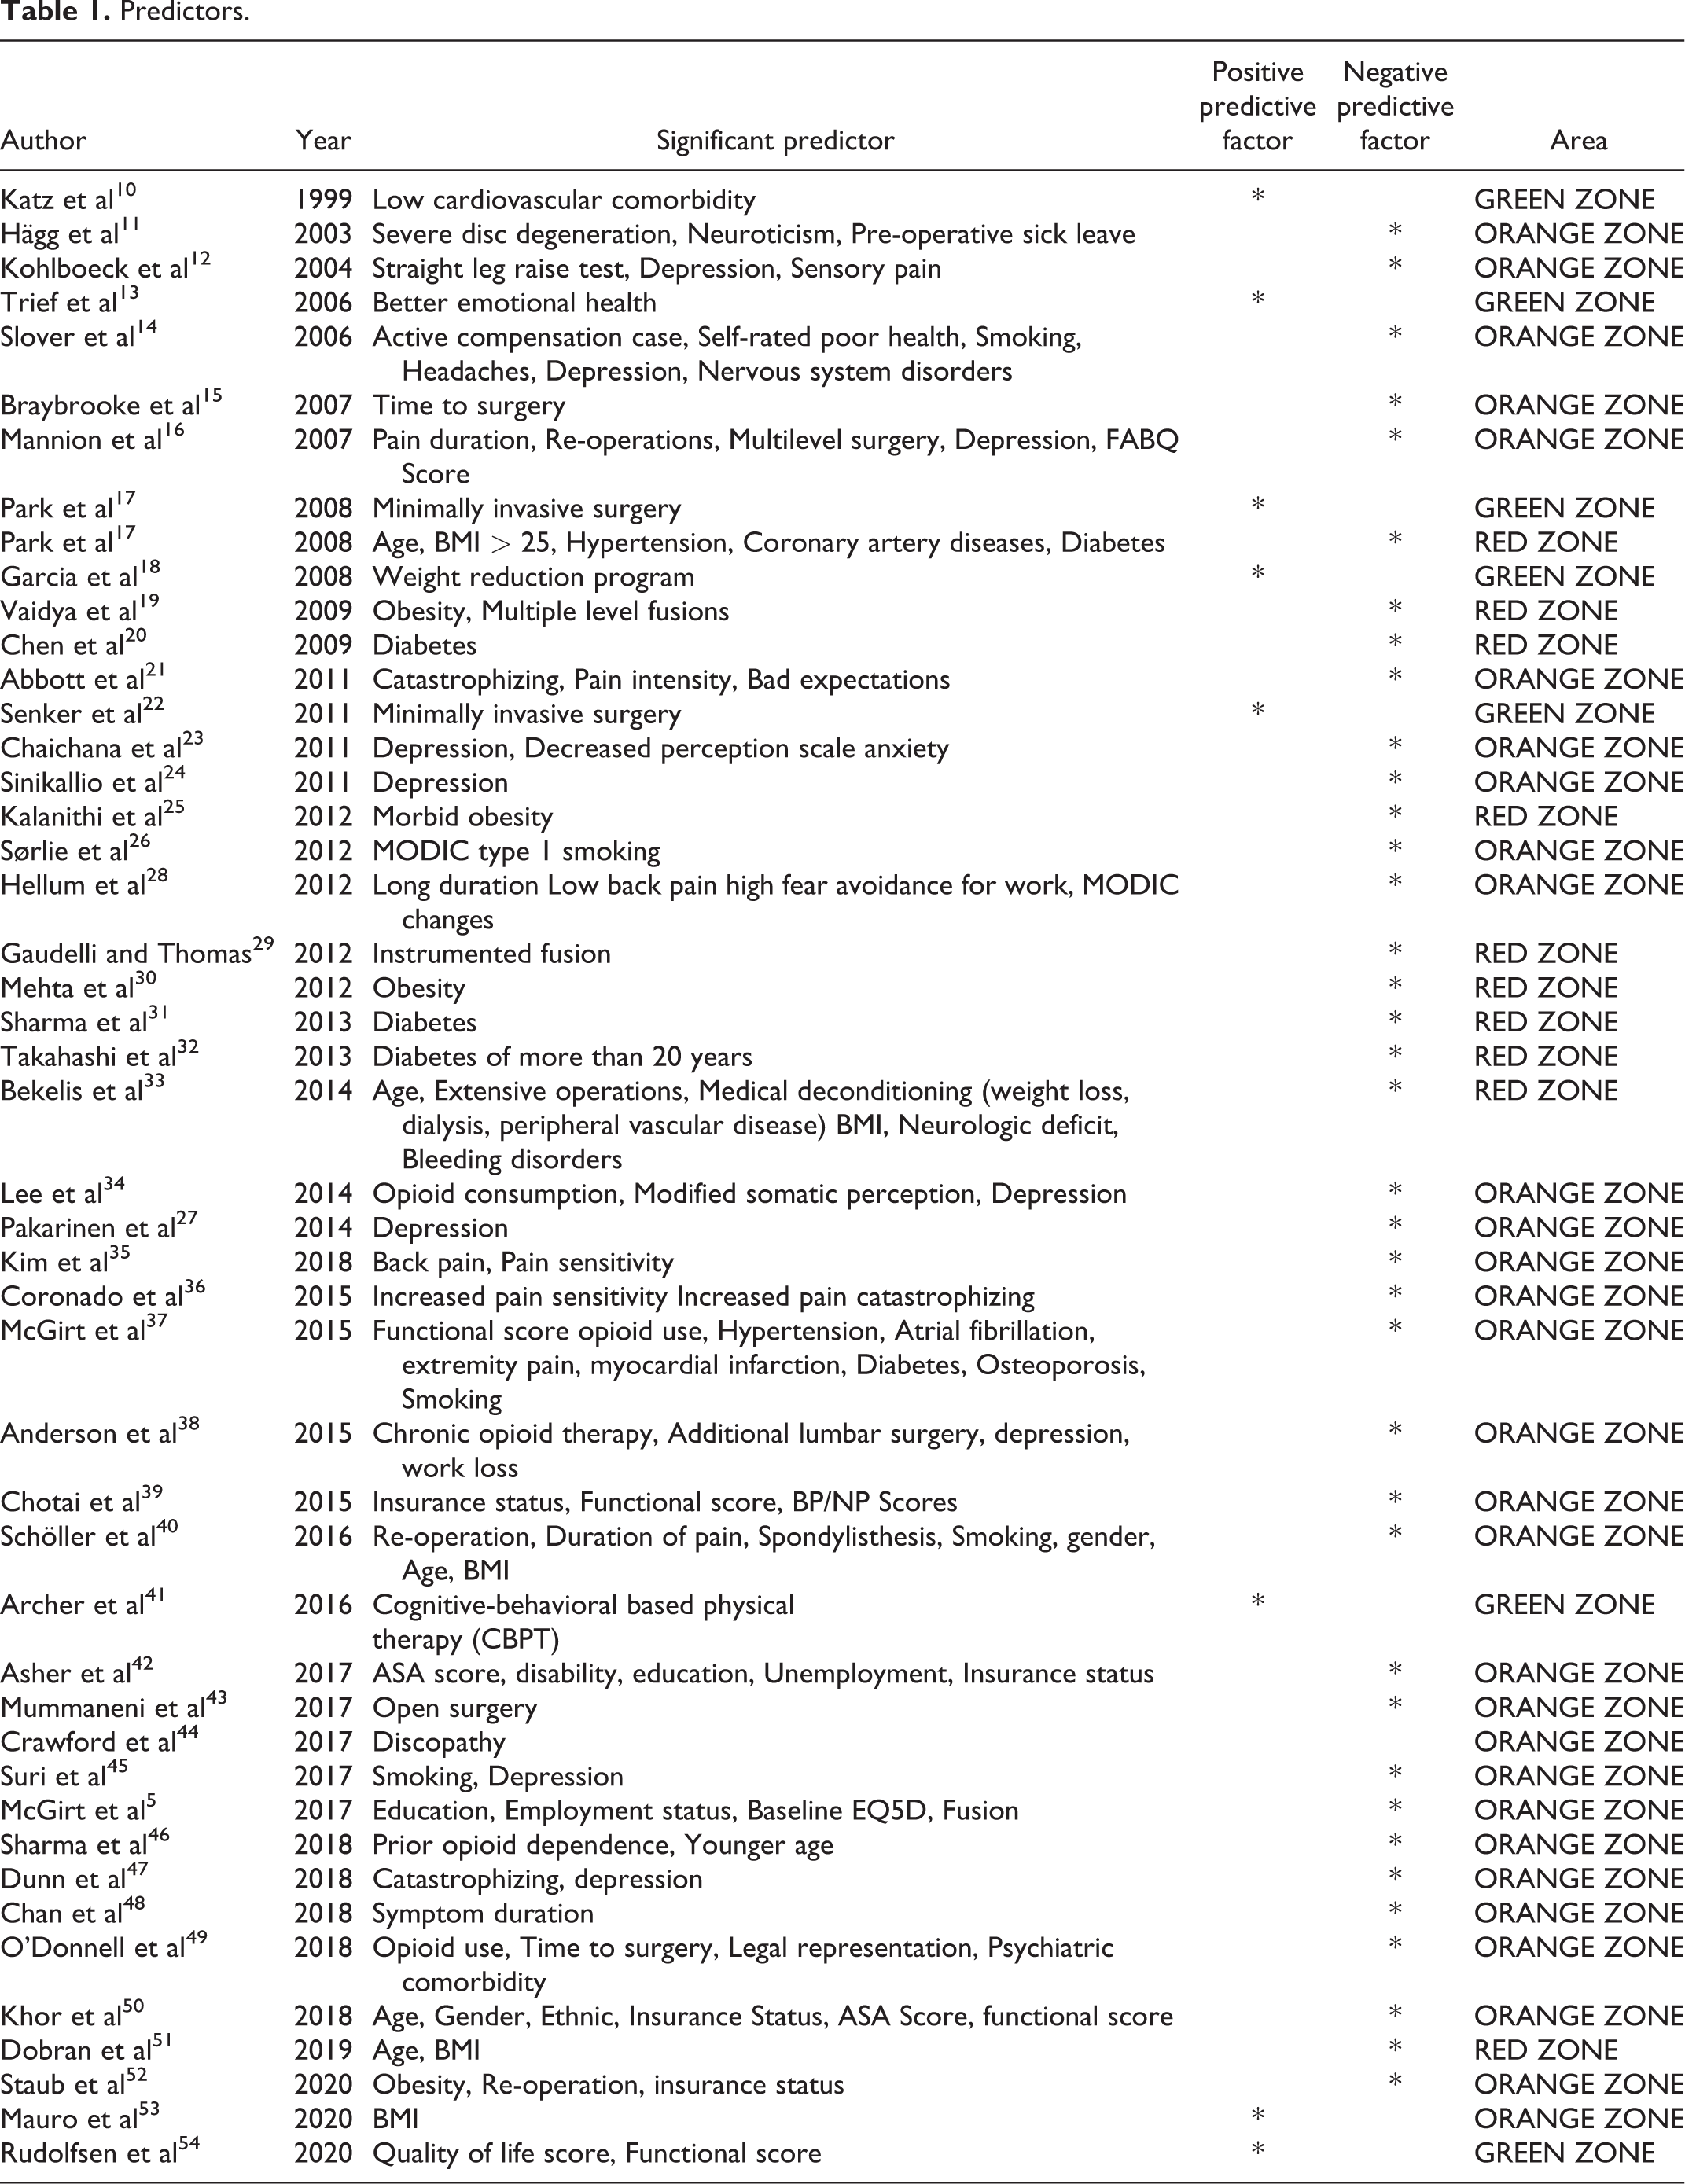
Most of these studies are based on the analysis of electronic medical records (EHR) in single-institution or in large national Database, describing statistically relevant risk factors of adverse event or surgery failure on a population.5,55 There is a growing interest about predictive factors influencing individual response after surgery, especially in terms of individual PROM. Furthermore, some promising predictive models in disk herniation recurrence or fusion50,56,57 exist but there is a lack of practical models for lumbar spine decompression in general.
“4P” (predictive, preventive, personalized and participative) medicine benefits from the support of artificial intelligence 58 (AI) machine learning and synthetic patient models.59,60 Regarding spine surgery, tools are already capable of improving the quality of the spine diagnosis. 61
Some algorithms allow to determine the average duration of sick leave, 62 the risks of opioids dependence for prolonged periods post-operatively 63 and to predict postoperative adverse events up to 30 days after spinal surgery64-66 (see Table 2.).
Predictive Model for Spine Surgery.
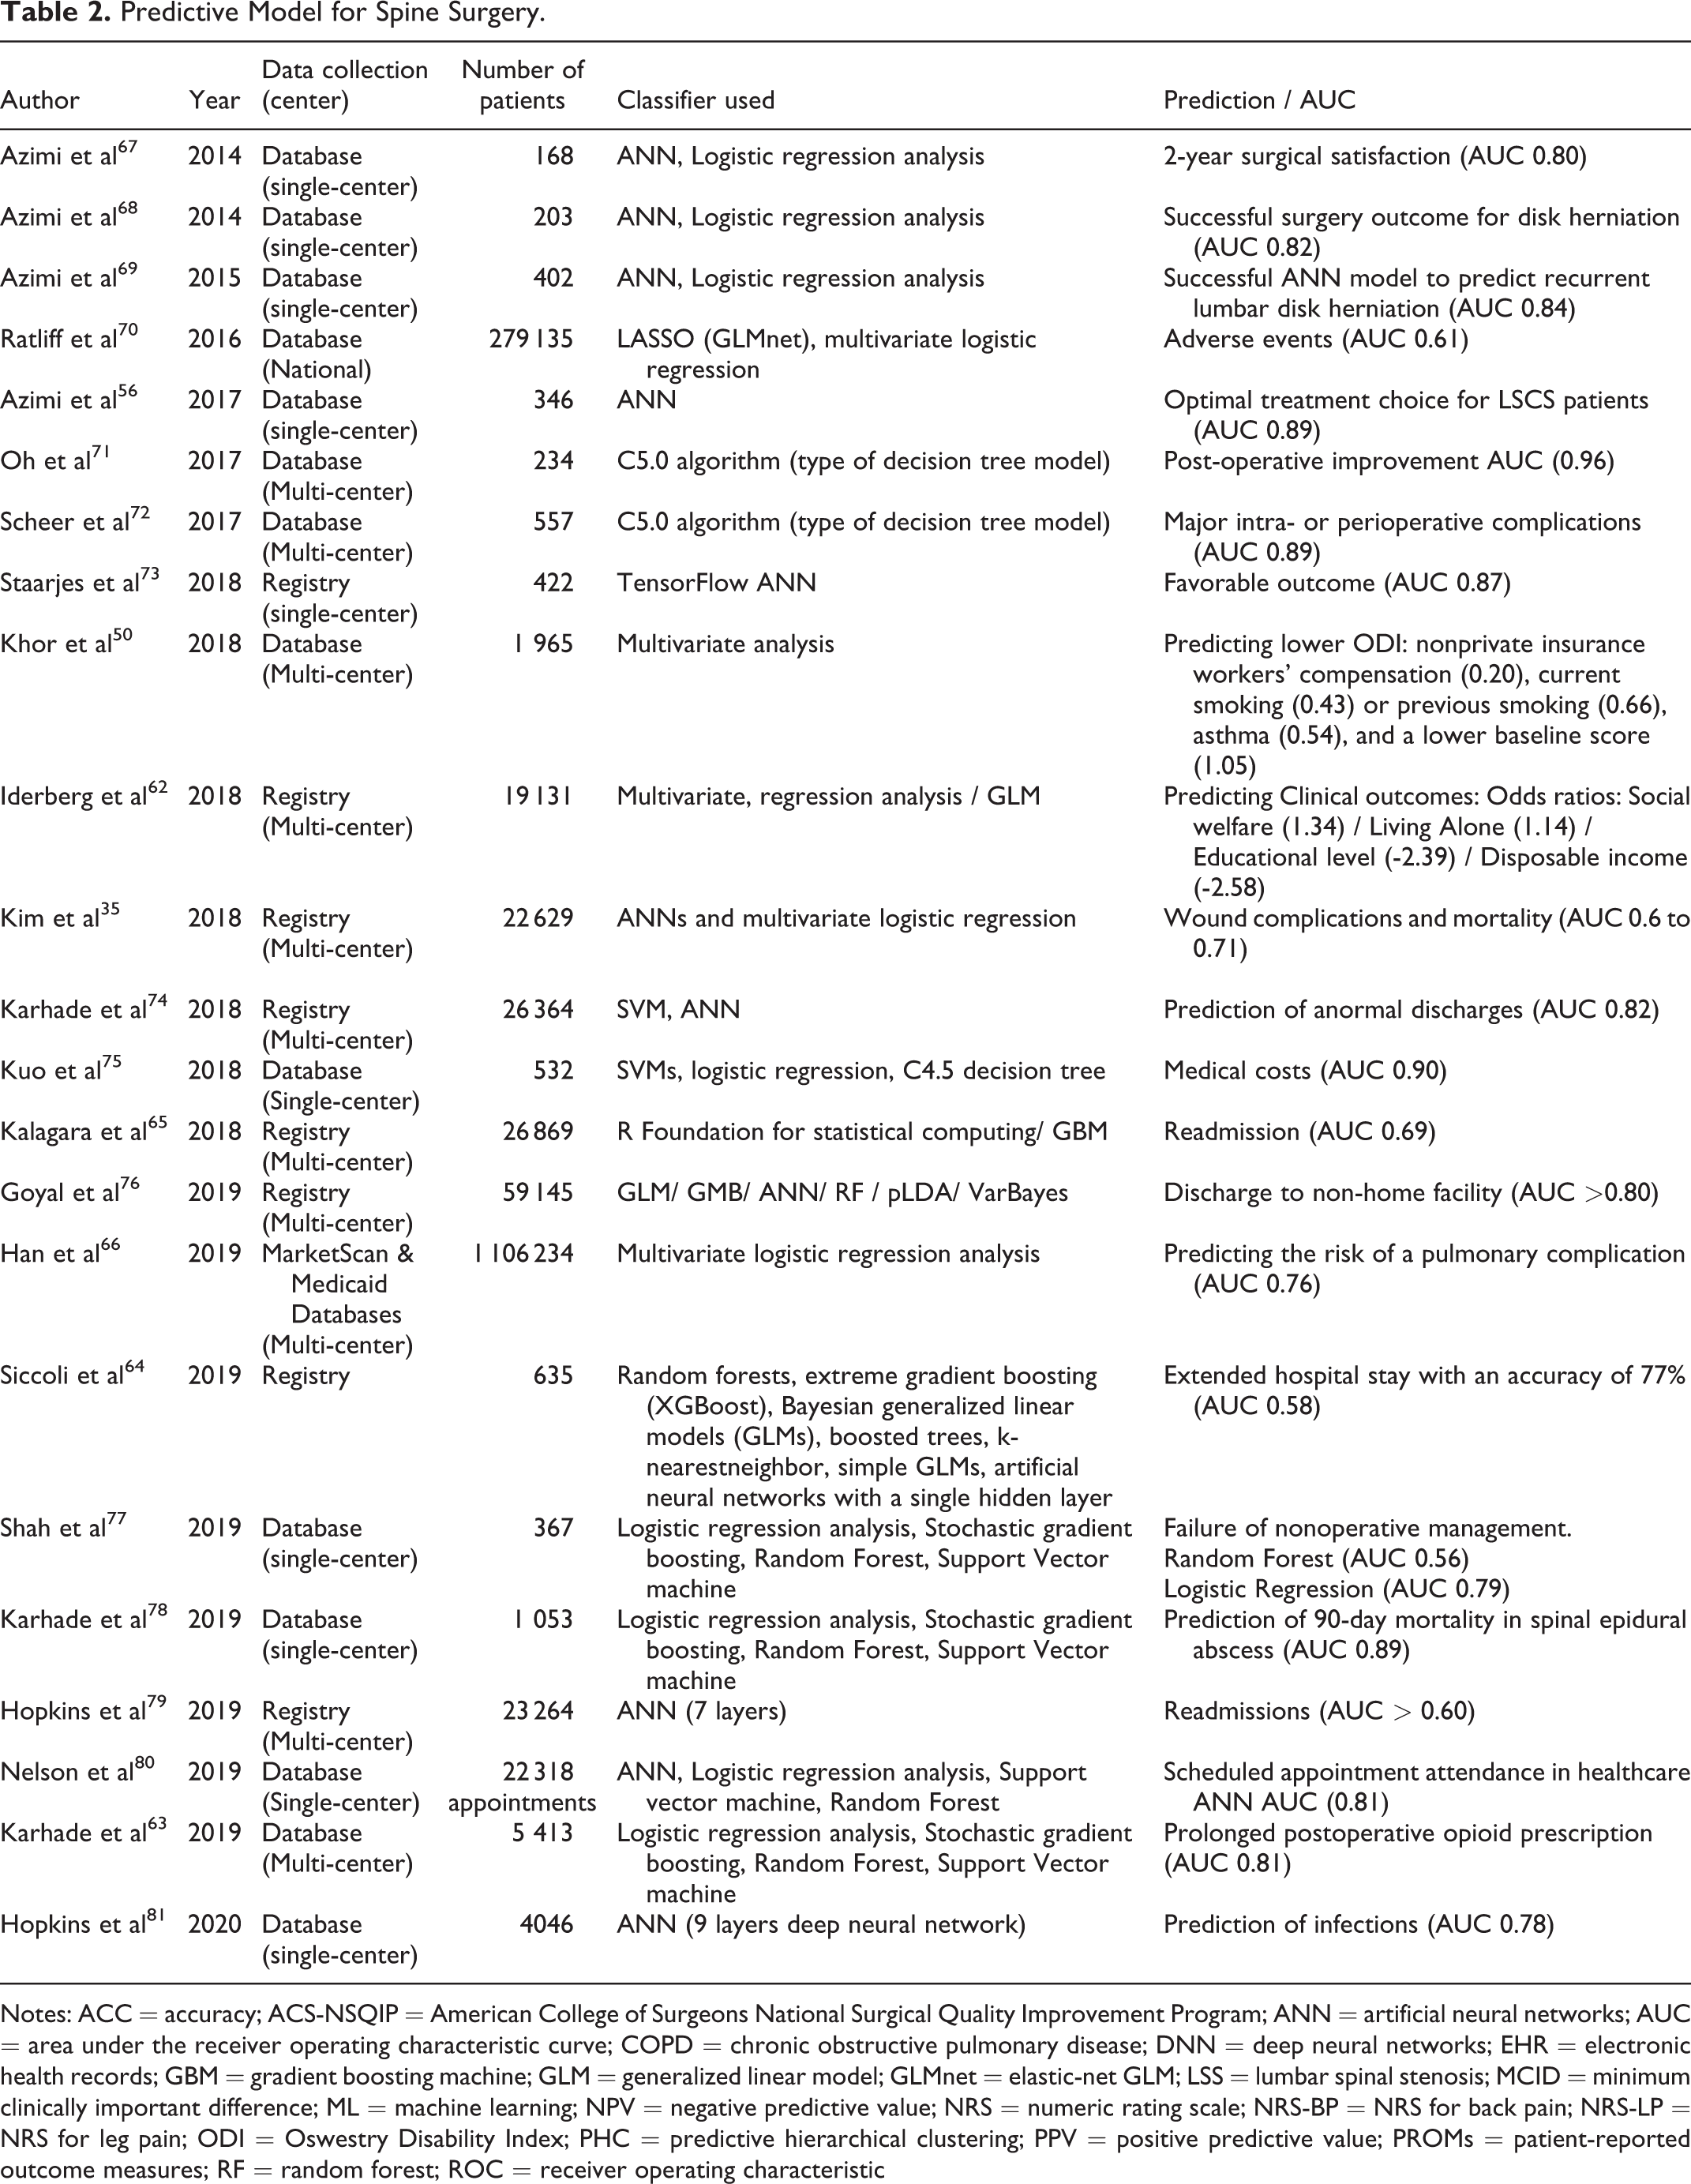
Notes: ACC = accuracy; ACS-NSQIP = American College of Surgeons National Surgical Quality Improvement Program; ANN = artificial neural networks; AUC = area under the receiver operating characteristic curve; COPD = chronic obstructive pulmonary disease; DNN = deep neural networks; EHR = electronic health records; GBM = gradient boosting machine; GLM = generalized linear model; GLMnet = elastic-net GLM; LSS = lumbar spinal stenosis; MCID = minimum clinically important difference; ML = machine learning; NPV = negative predictive value; NRS = numeric rating scale; NRS-BP = NRS for back pain; NRS-LP = NRS for leg pain; ODI = Oswestry Disability Index; PHC = predictive hierarchical clustering; PPV = positive predictive value; PROMs = patient-reported outcome measures; RF = random forest; ROC = receiver operating characteristic
Among these machine learning methods, we found multivariate logistic regression, stochastic gradient boosting or support vector machine methods and recently artificial neural networks and their improvement in deep neural networks60,77 to support decision-making activities.
Despite the current focus using EHR as the standard for development of machine learning algorithms, it can be very difficult to gather all the data needed to train such models. Likewise, for technical reasons (interoperability, data exchange, and ability of the operator to use information technologies) or legal and ethical issues, 82 it is difficult to access the full records in academic and industrial research.
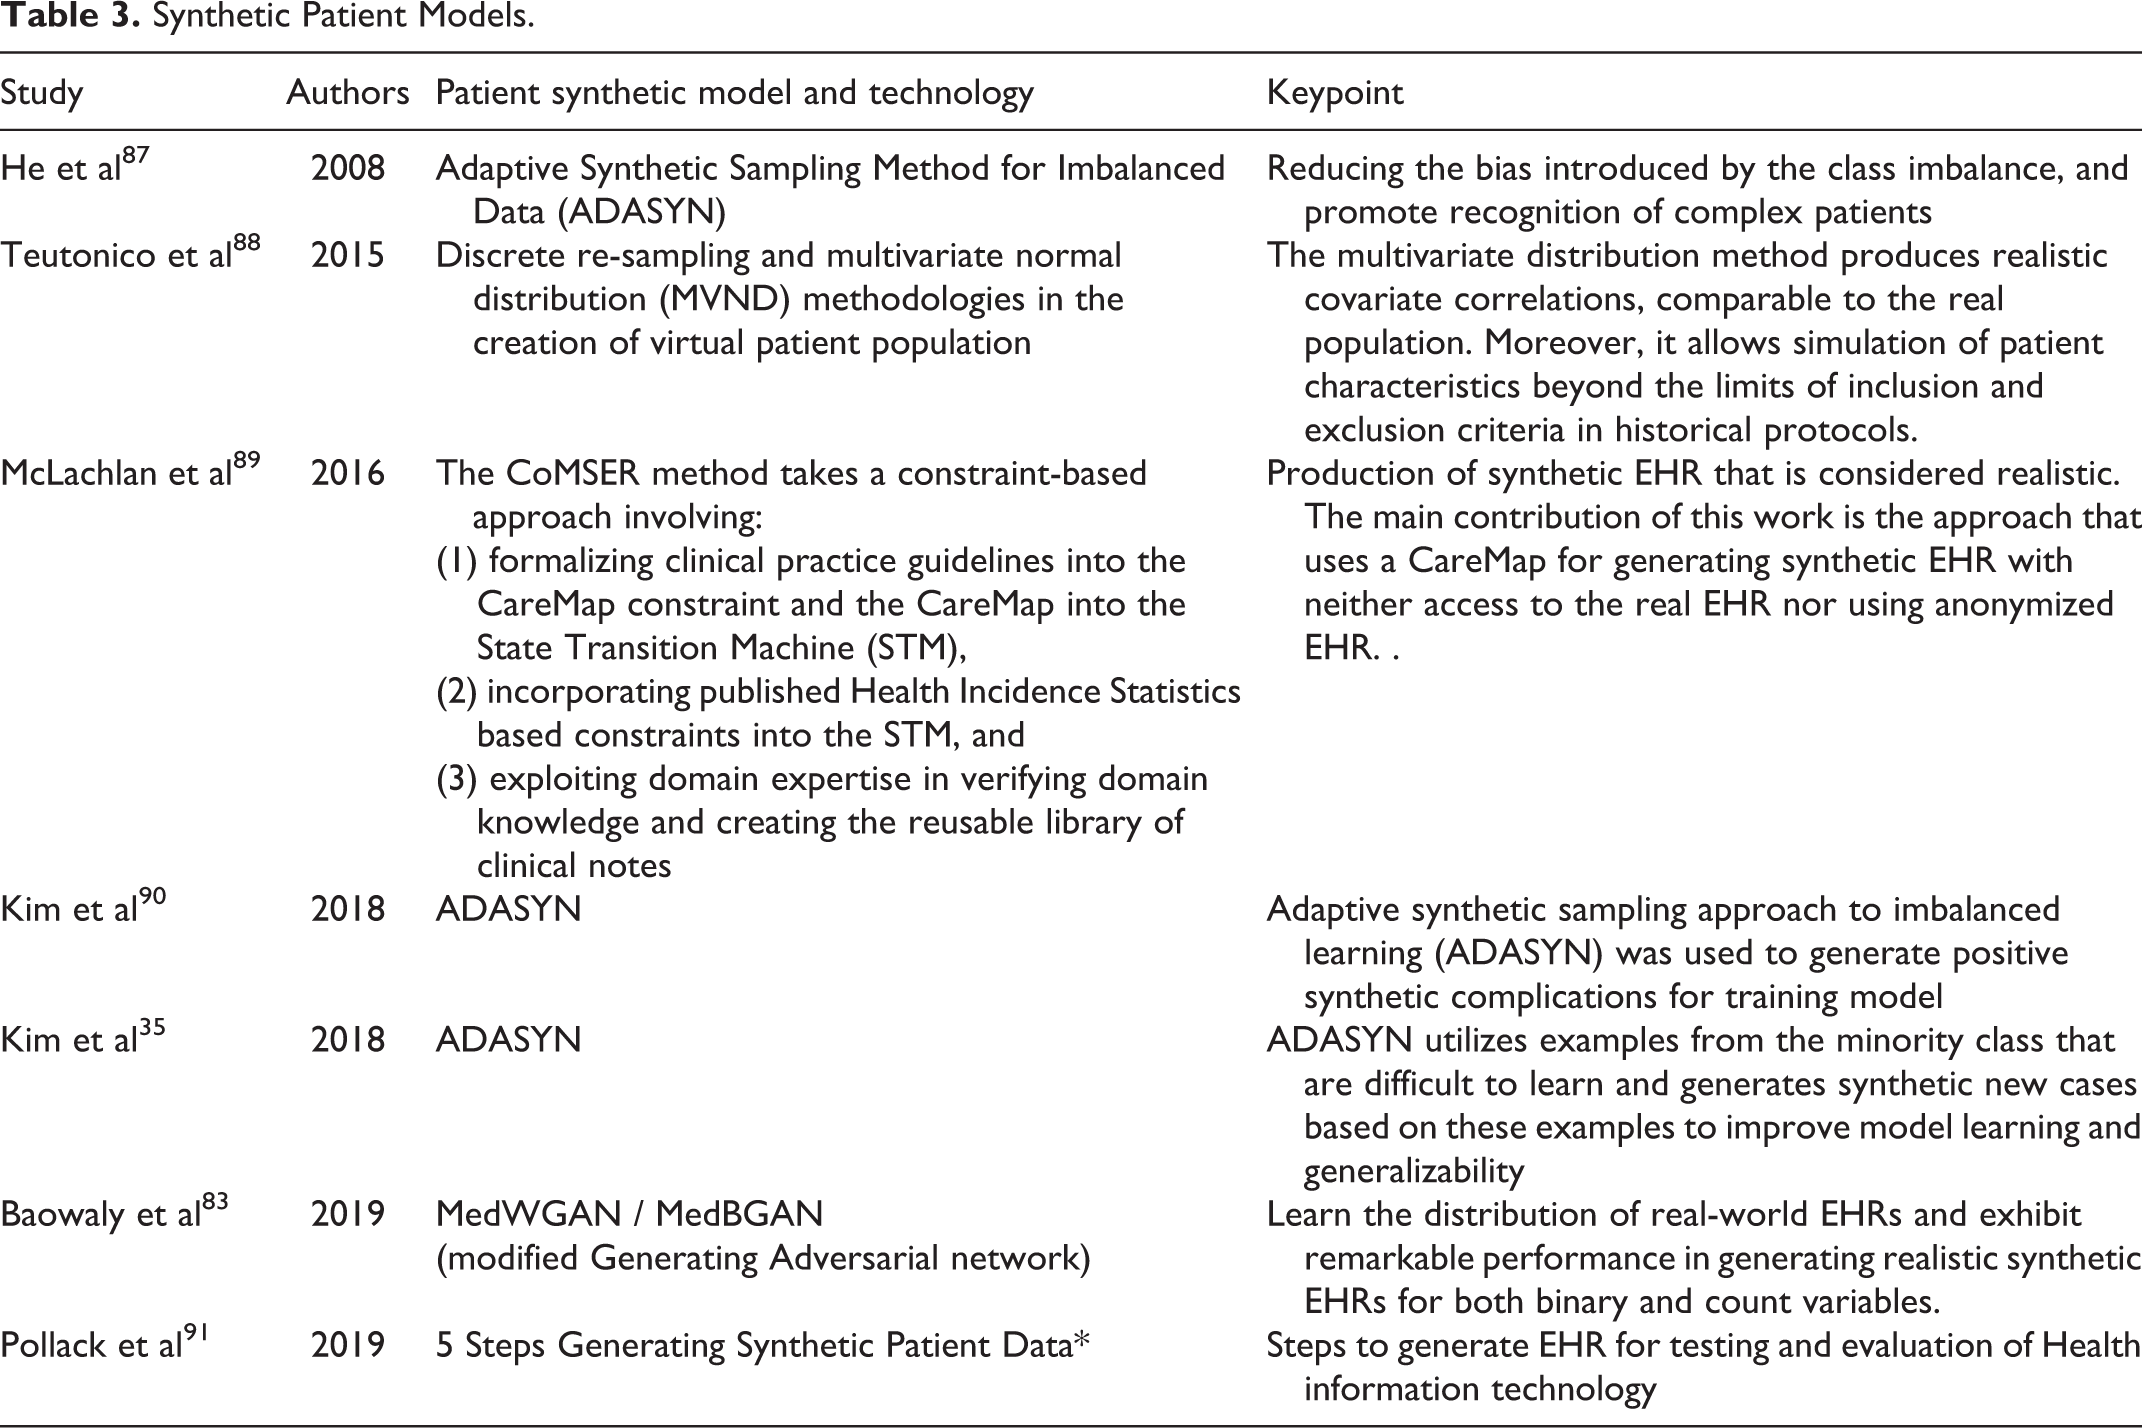
The generation of synthetic patients from the exploitation of EHR solves many problems related to the processing of real patients data. 83 Therefore data-driven methods were developed based on synthetic EHR 84 in 3 different ways: using synthetic health data records to help overcome confidentiality issues,62,85 modeling disease progression and interventions for prospective analysis of large scale virtual cohorts 86 ; and completing EHR data for imbalanced cohorts (cf. Table 3).
Synthetic Patient Models.
Objective
The aim of this study is twofold, to develop a virtual patients model for lumbar decompression surgery and to evaluate the precision of an artificial neural network (ANN) model designed to accurately predict the clinical outcomes of lumbar decompression surgery.
Materials and Methods
A transparent reporting of a multivariable prediction model for individual prognosis was used for reporting our model of machine learning in Biomedical Research.
Institutional Review Board
The EHR screening was approved by the department review board from the Department of Neurosurgery, Pitié-Salpêtrière University Hospital, all other data was anonymously reported and there is no specific approval.
Population
Any patient who underwent lumbar decompression surgery from January 2019 to April 2019 in the Department of Neurosurgery, Pitié-Salpêtrière University Hospital was included. We exploited retrospectively the local EHR.
Data Collection
Data collection was carried out through the automated request of EHR patients from our center (Orbis, Agfa Healthcare).
Pre-operative criteria were collected, including the patient’s age, sex, body mass index (BMI), demographic, radiological criteria, as well as the presence of comorbidities (diabetes, sleep apnea syndrome, kidney disease.), the type of work and the duration of sick leave, socio-professional problems, psychological disorders (anxiety or depressive syndrome) drugs consumption (NSAIDs, opioids), and immediate post-operative criteria such as: radiological criteria, sleep or food improvement, return to work, or rehabilitation inpatients center.
Patients were classified into 3 categories according to their surgery outcome: Green (significant improvement of pain and function without level 2 or 3 analgesics or other symptom) Orange (no significant improvement and/or significant medication intake anxiety-depression and/or persistent lumbar pain) and Red (early adverse event or complication)
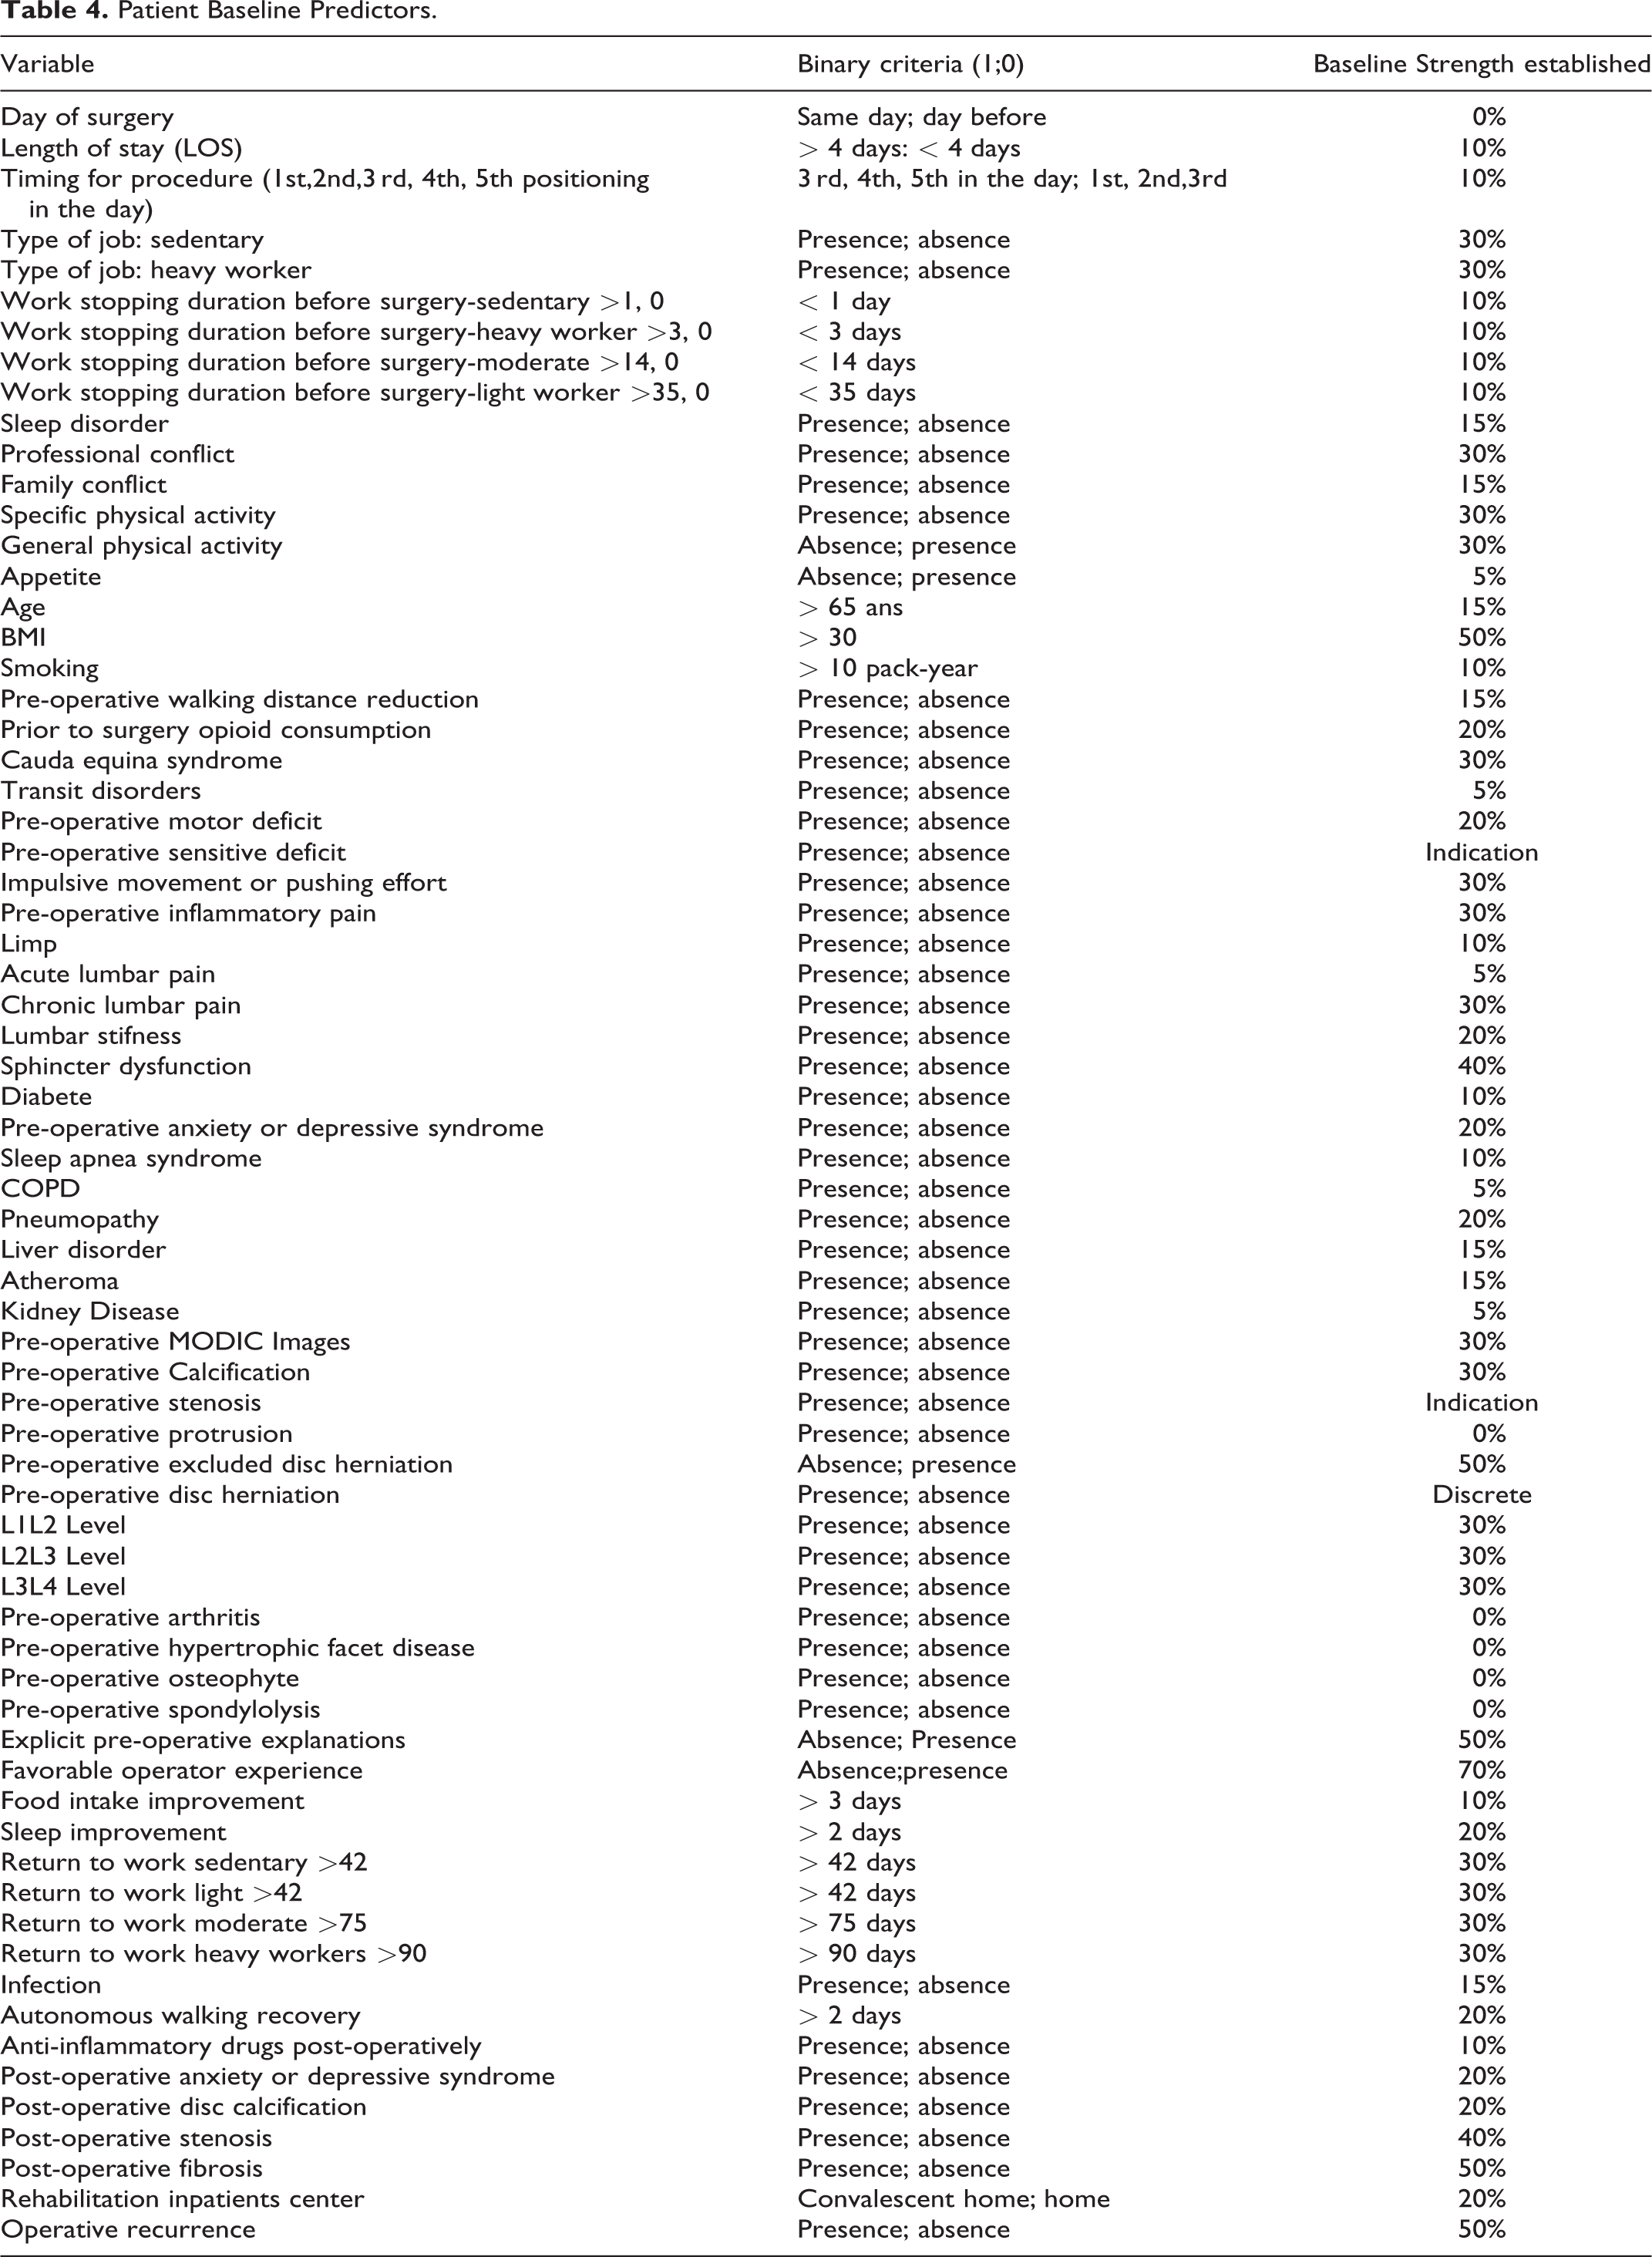
Predictors
Patient Baseline Predictors.
“Machine Learning”[Mesh] OR “Artificial Intelligence”[Mesh] OR “Natural Language Processing”[Mesh] OR “Neural Networks (Computer)”[Mesh] OR “Support Vector Machine”[Mesh] OR Machine learning[Title/Abstract] OR Artificial Intelligence[Title/Abstract] OR Neural network[Title/Abstract] OR Neural networks[Title/Abstract] OR Natural language processing[Title/Abstract] OR deep learning[Title/Abstract] OR machine intelligence[Title/Abstract] OR computational intelligence[Title/Abstract] OR computer reasoning[Title/Abstract]))) AND (((“Neurosurgery”[Mesh] OR “Neurosurgical Procedures”[Mesh] OR “Intervertebral Disc Displacement”[Mesh] OR “Spinal Stenosis”[Mesh] OR neurosurgery[Title/Abstract] OR neurosurgeries[Title/ Abstract] OR neurosurgical[Title/Abstract] OR neurosurgically[Title/Abstract] OR spinal [Title/Abstract] OR lumbar[Title/Abstract] AND (“Surgical Procedures, operative”[Mesh] OR “Postoperative Complications”[Mesh] OR “surgery” [Subheading] OR “Postoperative Period”[Mesh] OR “Perioperative Period”[Mesh] OR “Preoperative Period”[Mesh] OR surgery[Title/Abstract] OR surgeries[Title/Abstract] OR surgical[Title/Abstract] OR postoperative*[Title/Abstract] OR post-operative*[Title/Abstract] OR preoperative*[Title/Abstract] OR preoperative*[Title/Abstract] OR perioperative*[Title/Abstract] OR peri-operative*[Title/Abstract] OR operative procedure*[Title/Abstract])))) NOT (Comment[Publication Type] OR editorial[Publication Type] OR letter[Publication Type] OR case reports[Publication Type]).”
From Predictors to Criteria Tables
The potential predictors had to be usable in a neural network algorithm (see part Training and validation of the model). In the input table each criterion was a binary value (1 or 0) that represents the presence or absence. So, each predictor was transformed into discrete criterium to fill the binary values tables.
Statistical Analysis
Criteria for real and synthetic patients were compared. The mean percentage of presence for each criterion for each zone (green and orange), as well as the mean number of criteria for each category of patients and each zone were reported.
Synthetic Patient Model
Our synthetic patient model allows us to generate as many virtual patients as we desire in order to train the classifier without the need of real patients. The model that we propose can help in bootstrapping a new model without long and costly data collection, it could also be used to boost under represented categories in classification problem. 35
It is a statistical approach designed to create a virtual model, statistically representative of real patients’ population. Our method was to create patients that fall in the 2 zones that we defined (orange or green). To do so, we generated tables of random pre-op symptoms based on the input data defined before. Each input data (criteria) has a probability of presence, either 1 or 0 (present or not) based on a uniform distribution.
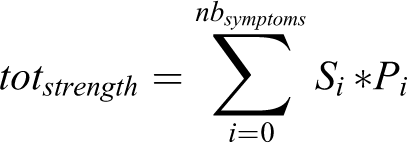
Then, each criterium was associated with a strength. The strength of each criteria was determined by a cross-professional group including spine surgeons, clinical register experts and statisticians.
In the input table, each criterium strength was added to the total strength of the table. This total strength was compared to a threshold, classifying patient in the orange zone (superior to the threshold) or the green zone (inferior)
Tables are generated for 10000 virtual patients, of which 5000 are green and 5000 are orange.
Artificial Neural Network Architecture
Our classifier is an artificial neural network, which architecture is based on our criteria (see Figure 1). Each input neuron represents a pre-operative criterium and the value associated is the presence or the absence of it.
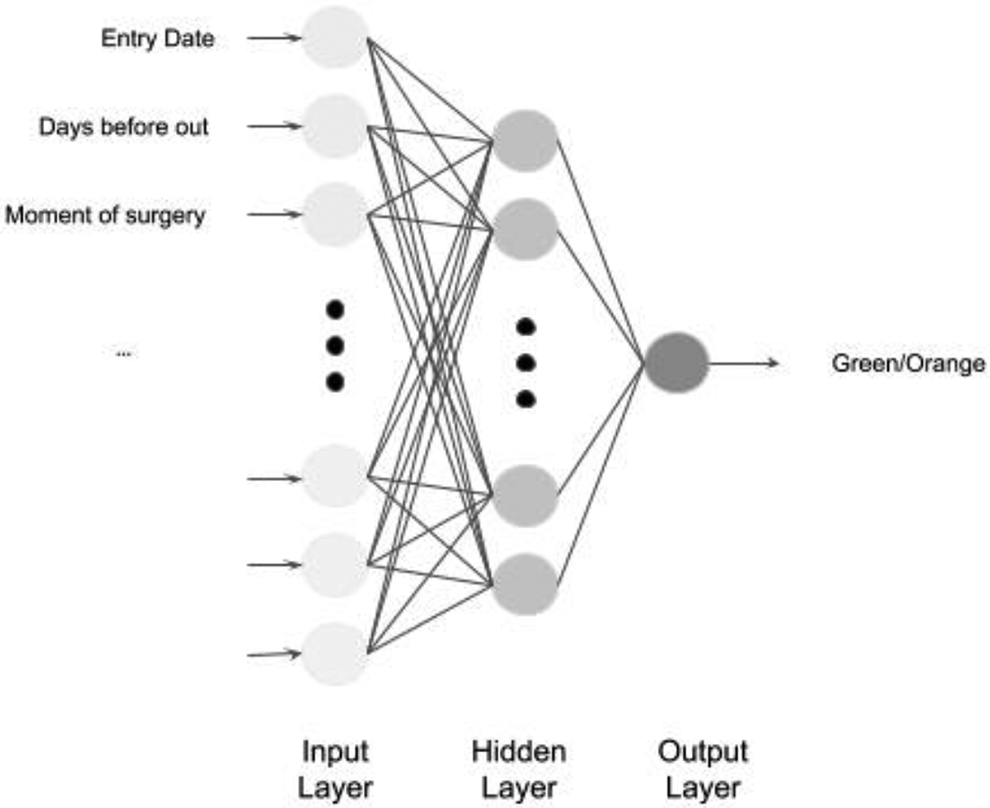
Architecture of our artificial neural network.
Activation functions for input and hidden layers are Rectified Linear Unit (ReLU). The activation function of the output layer is a sigmoid, the output value is then a Boolean: 1 if green, 0 if orange (See Figure 1). We use Keras Tensorflow framework for the construction and training of our model.
Training and Validation of the Model
The training of the classifier is done using 80% of the data set of virtual patients and 20% were used for testing purposes. The sets are randomly chosen in the virtual patient’s dataset, but we keep the 50% green and orange repartition. The algorithm chosen for loss calculation is binary cross entropy and Adam optimizer for back propagation.
The indicator that we use for real data is twofold: accuracy of the model—i.e. classification in either green or orange zone for a given table, and the ROC curve—i.e. the percentage of true positive on false positive at different thresholds. Validation of the ANN is done against real patient tables using the Receiver Operating Characteristic Curve (AUC).
Results
Population and EHR Data Set
In the actual cohort, we included 60 patients, with complete EHR allowing sufficient analysis, 26 patients are in the orange zone constituting (43.4%) and 34 are in the green zone (56.6%) (See Figure 2). The average positive criteria amount for actual patients is 8.5 for the green zone (SD+/- 3.09) and 10.47 for the orange zone (SD 3.38). Results are presented in Figures 2 and 3.
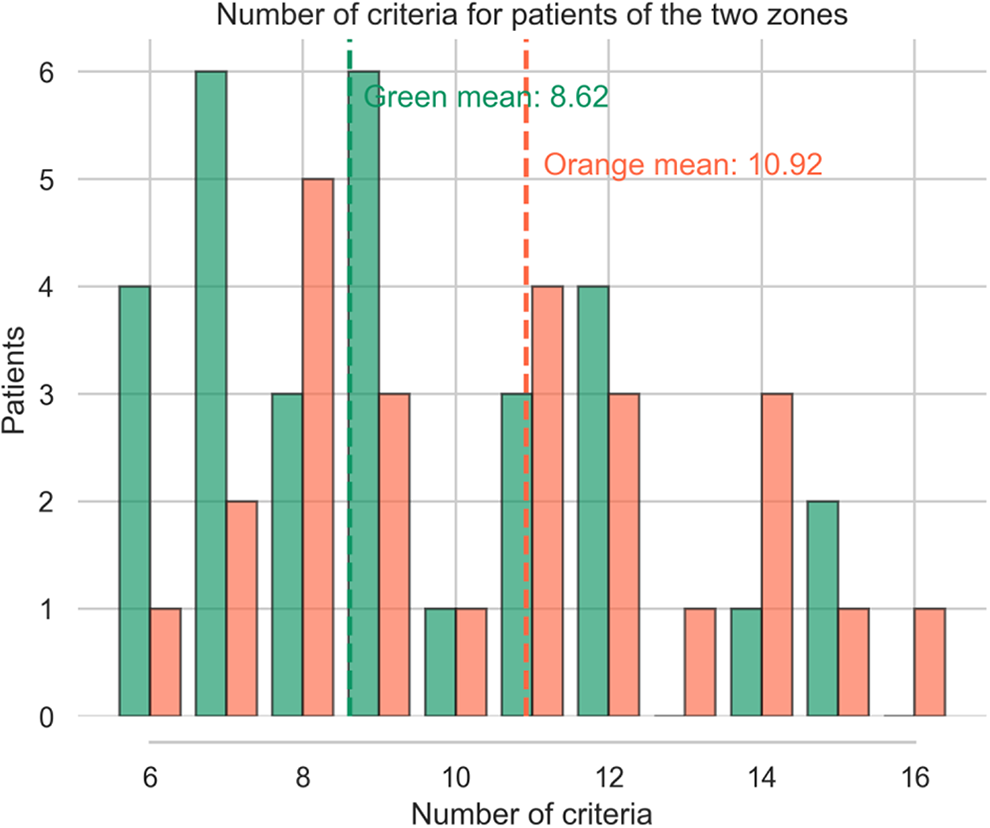
Real patient distribution according the number of pre operative criteria and their outcome (green: success/orange: failure).
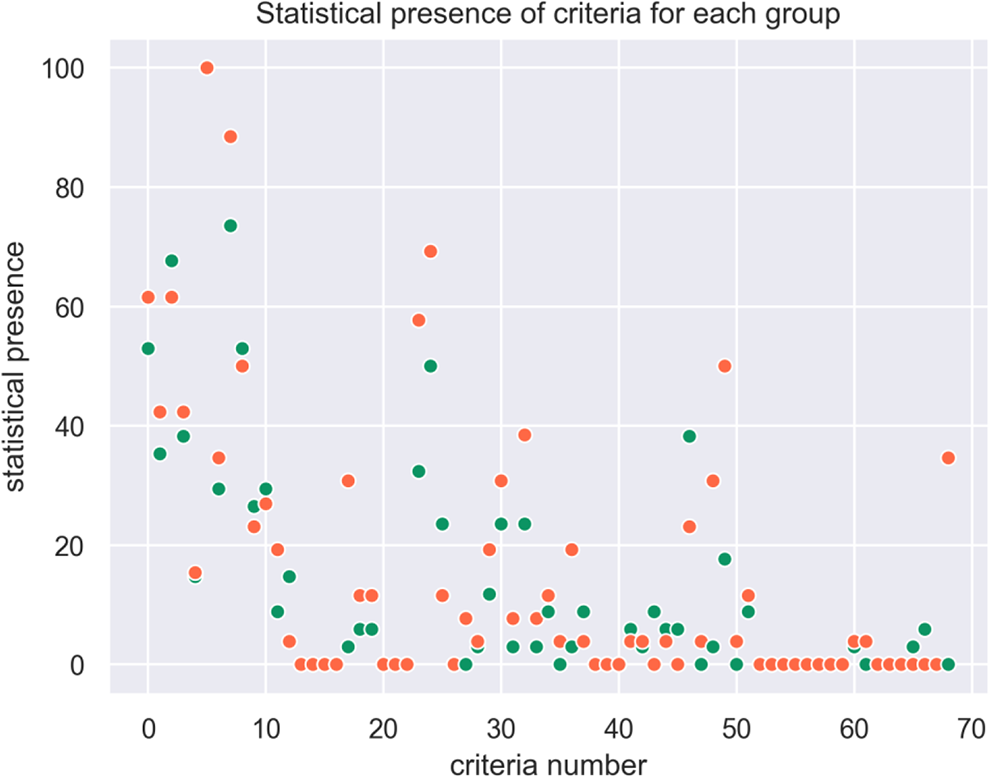
Statistical presence of criteria for each group orange / green (EHR).
Predictors
A total of 68 unfavorable predictors were collected and included in the initial training of the predictive model (See Table 4.). Those 68 criteria are used (58 “type of criteria” and their variants). Among the 68 criteria, 54 are pre-operative criteria and 14 are peri-operative criteria (from surgery to 1-month follow-up). Missing criteria are also counted.
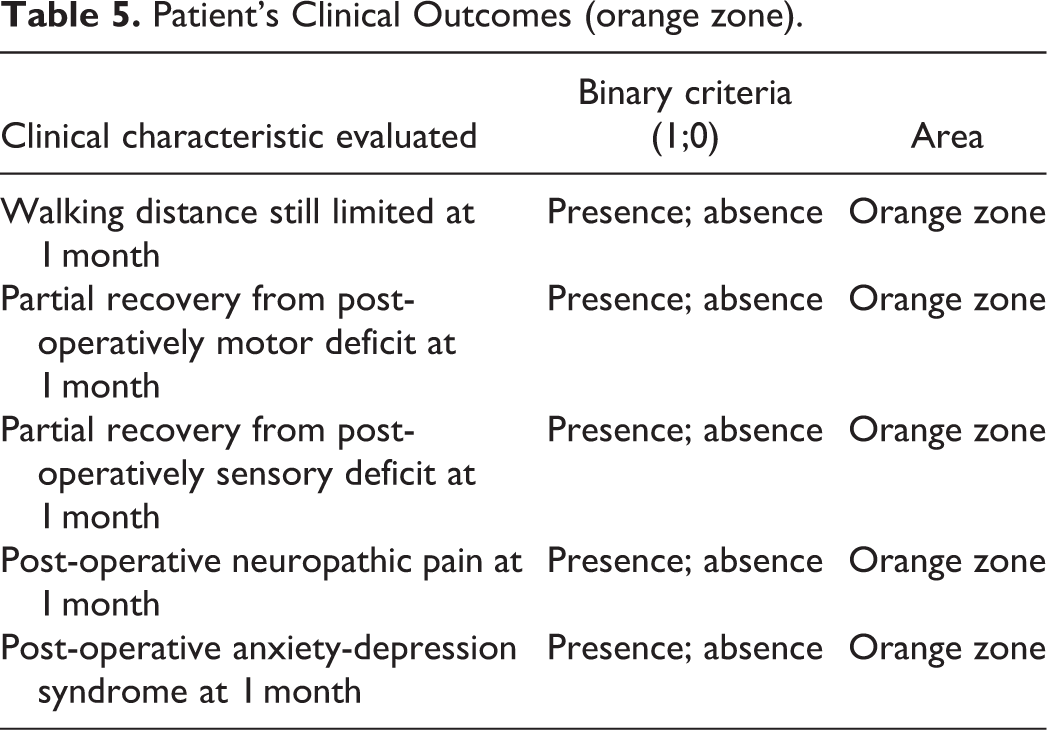
5 other criteria are related to Patient-Related Outcome and allow us to assess the improvement of the quality of life (See Table 5.). The presence of one of these criteria defines the patient’s outcome as falling into the orange zone. Our machine learning model was then evaluated through the correct patient classification in the orange zone.
Patient’s Clinical Outcomes (orange zone).
Synthetic Data Set
We generated 10000 virtual patients for training our classifier, 5000 were allocated to the green zone, 5000 to the orange zone. We chose a 50/50 split in order not to introduce a bias of distribution between the 2 zones during the algorithm training. We also generated 2000 tables for testing (20% of the training set).
Figure 4 shows a Gaussian distribution of the number of criteria for the 2 zones.
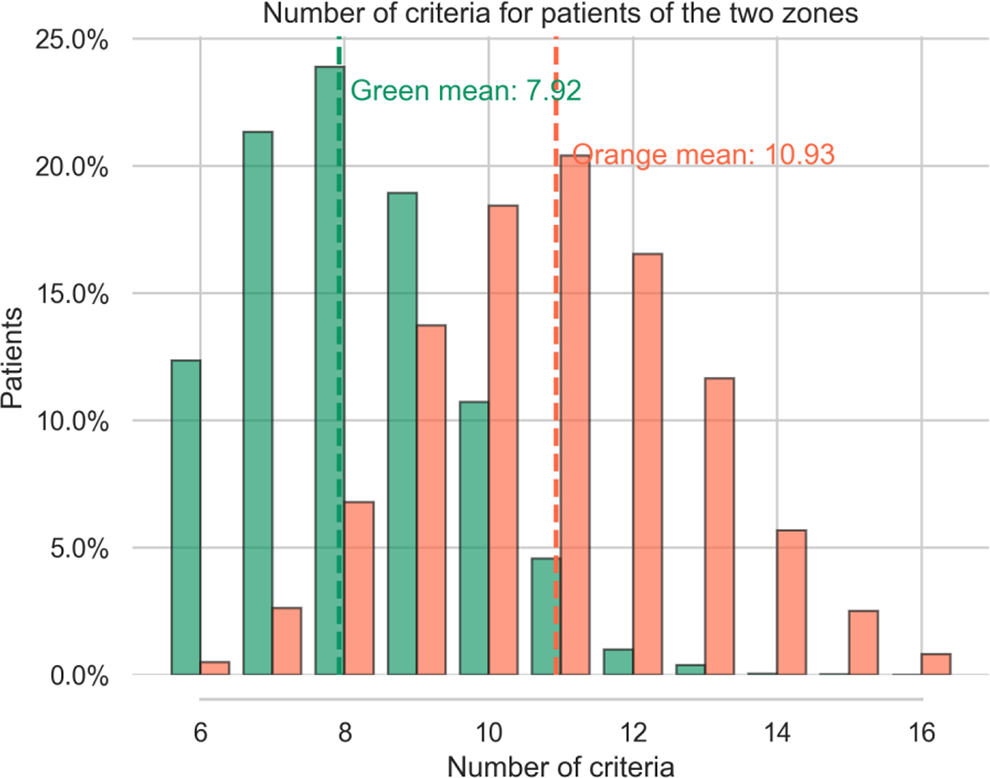
Number of patient criteria for the 2 zones (syn-EHRS).
For patients in the green zone we found a mean of 7.92 symptoms per table, (median: 9, SD +/- 1.71), for patients in the orange zone the mean is 10.93, (median: 11, SD +/- 1.81). These numbers are coherent with what we observe in real patient distributions (see Figure 2.). Submitting the number of criteria to a Welch’s test we get a value of -71.31 715 with a p-value of 0.0, confirming that the difference in number of criteria for the 2 zones is significantly different.
Indeed, patients in the orange zone tend to have more criteria. Moreover, the higher the strength of a criteria the higher the probability of presence is for that symptom in the orange category. For instance, the predictor “BMI >30” is more represented in orange tables (16.88%) than in green ones (1.84%). Conversely, most of the criteria with low strength are represented with nearly the same proportion in the 2 categories (<2%): age, appetite, COPD, transit disorders, Sleep apnea work stopping duration before surgery-light worker>35, kidney disease and diabetes.
The statistical presence of each criteria in each zone is plotted in Figure 5.
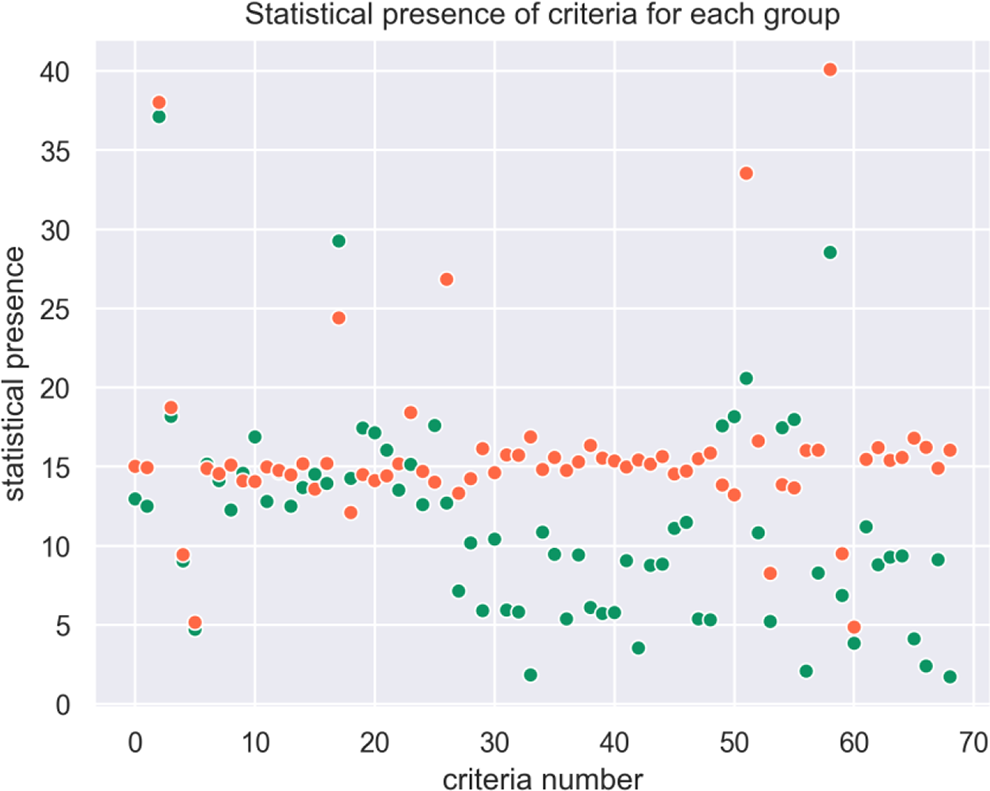
Statistical presence of criteria for each group (syn-EHRs).
The combination of several criteria leads from green to orange zone, i.e, the presence of 1 or 2 criteria is not significant in itself to classify the patient outcome. In our synthetic population, 5 criteria are present more than 20% of the time, but these criteria alone do not determine the zone.
Comparison of Criteria Between Real Patient and Synthetic Patient
The criteria proportions in each cohort are compared in Table 6. In order to assess the relevance of the virtually generated patients and their representativeness, we used an open-clustering approach.
Real and Synthetics Patient’s Predictors Distribution (%).
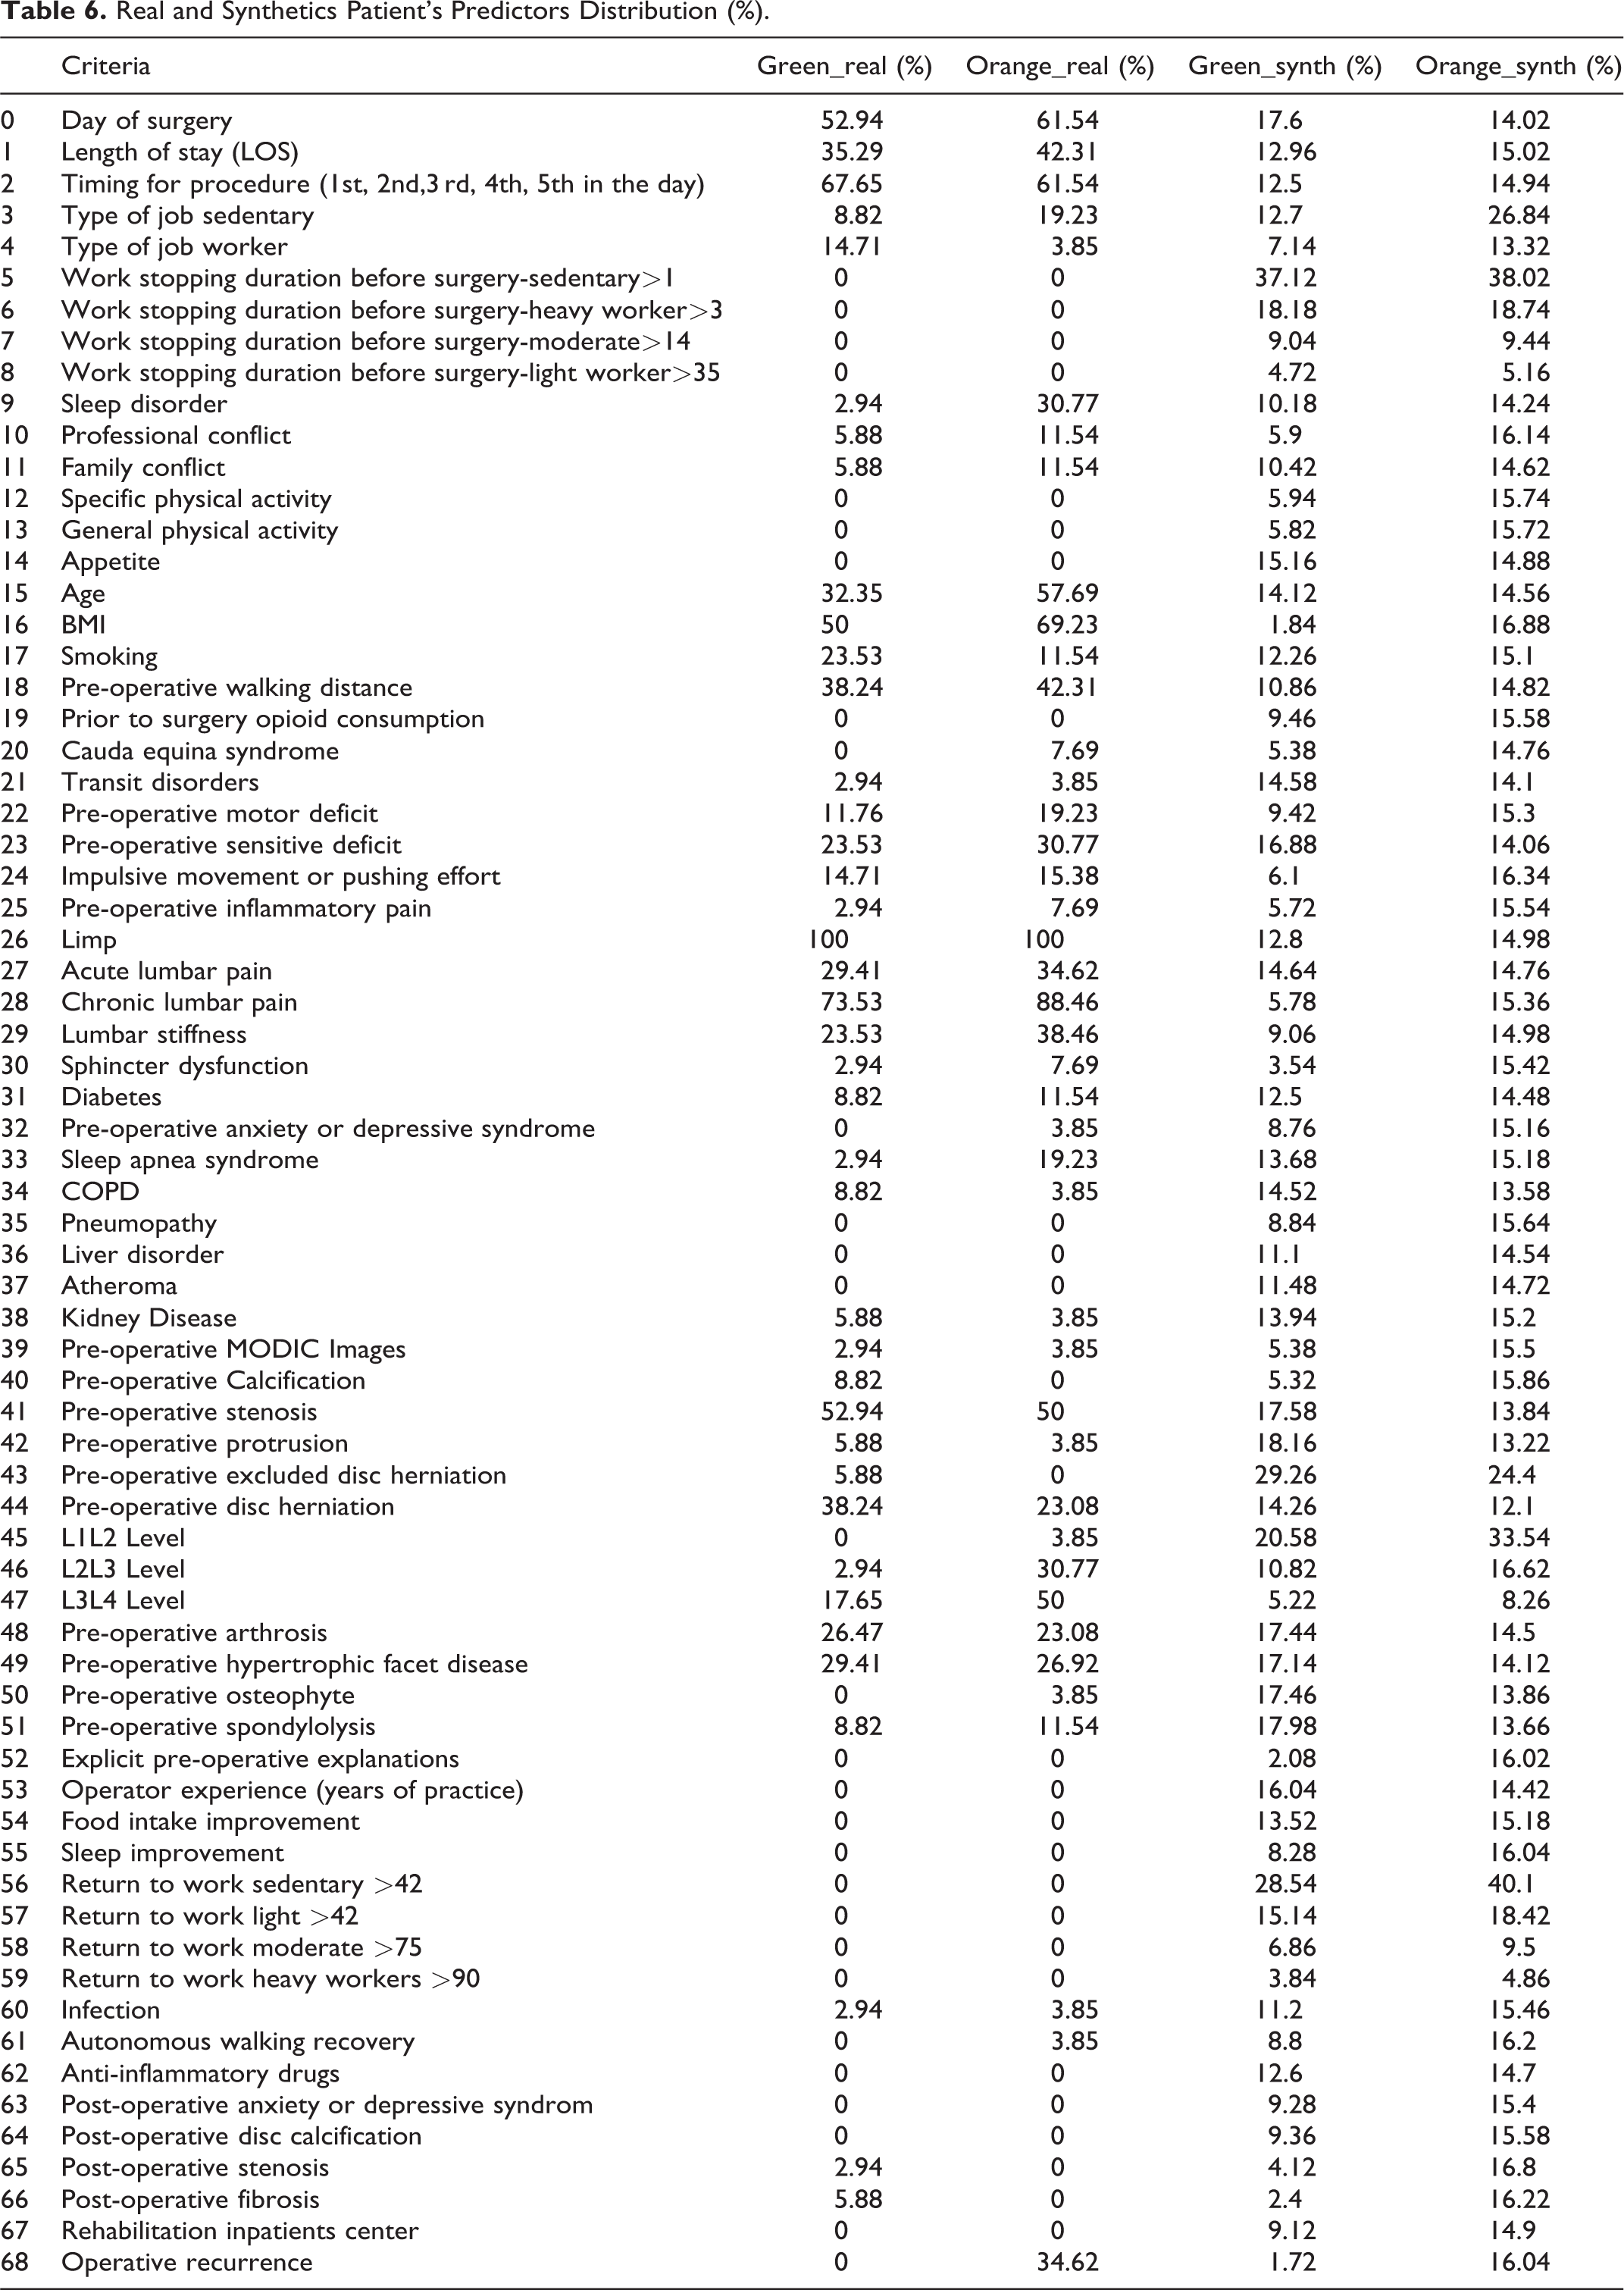
As we are conscious of the lack of exhaustive data in the real patients cohort criteria, we presume that several non-significantly different criteria could be finally relevant if correctly assessed. Therefore, we preserve them to keep a maximum of meaningful data for the training of our machine learning and increase the reliability of our synthetic population.
Training and Validation of the Model (ANN Results)
The classifier is trained using 10000 patients from the training set and 2000 patients from the test set. The batch size is 2000 and the model is trained for 100 epochs. The loss decreases rapidly, and the accuracy is growing also quickly. After 50 epochs the model is already close to convergence (see Figure 6.).
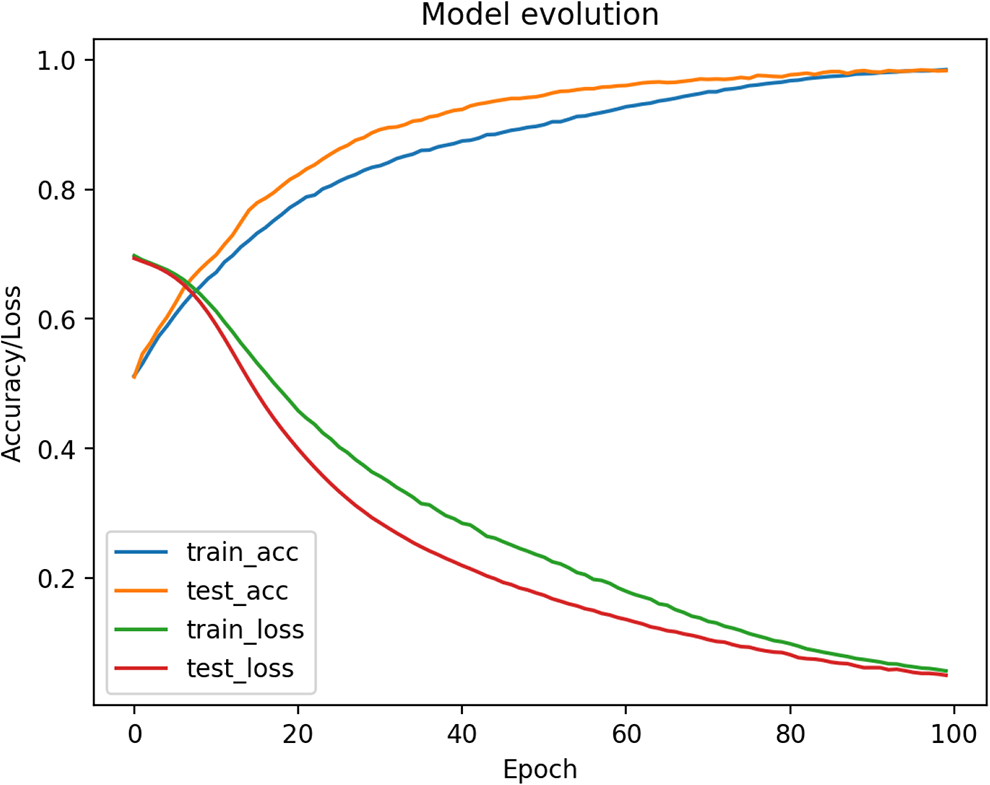
Training model evolution (Accuracy and loss / Number of epochs).
The test set is also synthetic and does not provide a solid way of stopping the model before overfitting because it has the same convergence as the training set. Thus, we use the real data to test our model and stop training.
After 100 epochs the test on real data gives an accuracy of 72% and the ROC curve is as follows with a ROC score of 0.78 (See Figure 6). The sensitivity of our model is then 88,5%, specificity is 58%, PPV is 62% an NPV 87%, these numbers for each zone are reported in Table 7.
ANN Model for Predict Successful Spine Surgery.
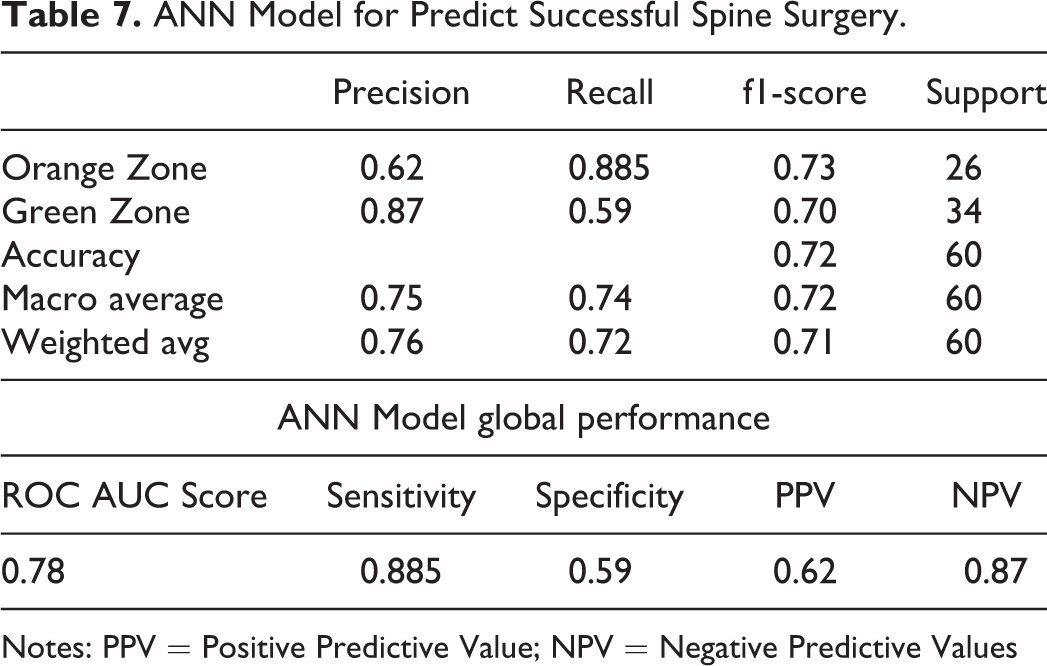
Notes: PPV = Positive Predictive Value; NPV = Negative Predictive Values
Discussion
Our results show similar risk factors identified in other cohorts. 92 In our real patients cohort, age > 65 years, BMI> 30, surgery same day of hospital entry, chronic low back pain are strongly predictive of the orange zone. In our virtual cohorts, sedentary job, L1L2 level, return to work to sedentary job >42 days, work stopping duration before surgery-sedentary>1, are the strongest predictors for the orange zone, ie. treatment failure or poor improvement.
However, on their own, they cannot determine one outcome or the other. This illustrates the need for an individual predictive tool based on several predictors, having multiple degrees of influence (strength) on the outcome.
Our model was statistically representative of the real data. We also used the real data as the validation set of the classifier, in order to better fit the real world.
Our machine learning model can classify the orange population in 88,5% of cases, whereas our green zone is correctly classified in 59% of the cases. The overall precision, calculated by the area under the ROC curve (AUC) is 0.78 (see Figure 7).35,56,63,74,67-76,78-81 This model is particularly suitable for screening patients who react negatively to lumbar surgery, with similar sensitivity to other predicting tools recently published. Nevertheless, there is still a lack of specificity, maybe due to the 23 missing criteria from the database, which prevent our model to evaluate their impact as clinical predictors. Although ANNs show very promising performance, it was trained using virtual patients generated by our model, thus limiting the precision of the response in real cases. Moreover the study sample of real patients was small, and therefore this study will need to be repeated with larger, multicentre datasets and external validation to convincingly demonstrate its validity and predictive power.
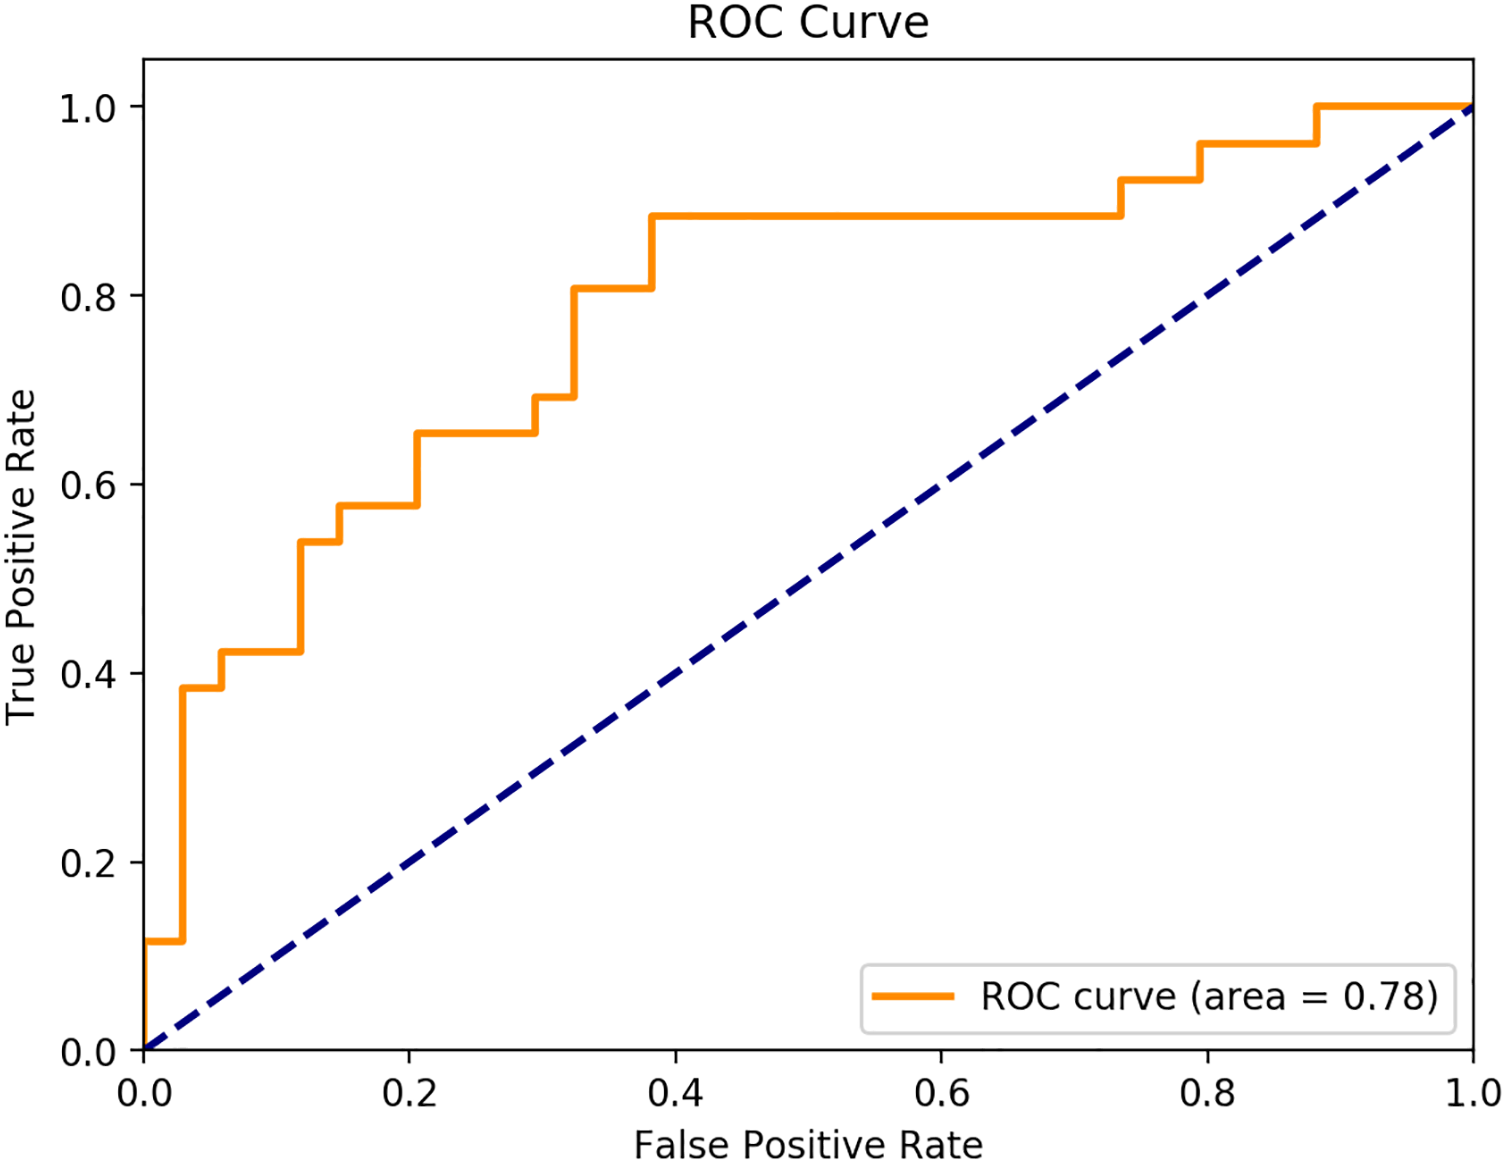
AUC of our ANN-models using EHRs and syn-EHRs.
The goal of our method was to obtain a reproducible, repeatable, and usable tool, that can fit with various databases, deal with missing data and can be applied to similar stakes. Indeed, the missing complete electronic patient data, the difficulty to access it and the inability to standardize and exploit this data make the development of an omniscient prediction tool challenging.
Thus, we increase the number of exploitable variables (below the significance threshold) to obtain an individual response, we generate virtual patients to increase the size of our training cohort, and we use medical know-how as a tool for architecture of our virtual patients to answer a data quantity problem.
Our algorithm is based on deep learning, which goal is to use as much data as possible to increase its accuracy and precision. The more intensive the use of the algorithm, the better the accuracy in cases statistically farther and farther from the center of the Gaussian. Indeed, the amount of data influences the variability of this data. This increases the number of “rare” cases far from the median value, making it less necessary to use techniques to boost their number (data augmentation). The real cases collected by retro-analysis of the data will gradually replace the data augmentation of the training set and the model will increase its robustness. This method is used in all machine learning algorithms whose training is supervised. Successive versions are improved by increasing the dataset as the actual data is captured. 93
As we move toward personalized medicine and value-based care, there is an increasing need to collect and use PRO scores not just in research settings, but also in routine clinical care or quality improvement activities. 50 The progressive digital transformation in the healthcare facilities should allow us to collect more precise and valuable clinical data.
Conclusion
Our method can be used to predict outcome lumbar decompression surgery. There is still a need to further develop its ability to analyze patients in the “failure of treatment” zone in order to offer precise management of patient health before spinal surgery. Through the exploitation of a larger database more representative over time, we think that our model will be capable of improving classification of the orange zone. This model is in concordance with already published machine-learning tools in spine surgery, successfully allowing to predict the improvement of post-operative symptomatology64,94 and reduction of drug consumption.38,95,96 Thus, it will be possible to administer the patient’s health monitoring to reduce the post-operative risks and above all to promote its recovery after surgery with appropriate therapies. In addition, a software suite could help surgical practice by reducing the surgical gesture to its anatomical usefulness by avoiding the psychological or iatrogenic undesirable effects inherent in the medico-social framework of the intervention.
Footnotes
Abbreviations
Declaration of Conflicting Interests
The author(s) declared no potential conflicts of interest with respect to the research, authorship, and/or publication of this article.
Funding
The author(s) received no financial support for the research, authorship, and/or publication of this article.