
Abstract
Study Design:
Retrospective cohort study.
Objectives:
To explore the possibility of predicting final body height at maturity based on associating parameters at the time of diagnosing adolescent idiopathic scoliosis (AIS), while examining the effect of curve magnitude and deterioration.
Methods:
A total of 284 female patients with AIS (mean age 12.2 ± 1.1 years, 52.5% premenarchal) were followed till skeletal maturity, indicated by ≥Risser stage 4, static body height and arm span over the past 6 months, and postmenarche 2 years. Standing body height, arm span, menarchal status, Risser staging, distal radius and ulna (DRU) classification, Sanders staging (SS), Cobb angles (major and minor curves), and Lenke curve types at initial presentation were examined. Patients with/without curve deterioration were compared. Multiple linear regression was used for predicting final body height (cm), and remaining height increase (%).
Results:
Baseline body height was 152.1 ± 7.1 cm and major curve Cobb angle was 27.1° ± 7.4°, whereas at maturity they were 159.5 ± 5.4 cm and 32.5° ± 9.3°, respectively. For patients presented at Risser stage 0 or 1, radius grade (R) 6, ulnar grade (U) 5, or SS3, those with curve deterioration exhibited greater height increase potential at initial presentation (P < .05) than those without deterioration. No intergroup difference was found for patients presented at ≥Risser 2, R7, U6, SS4. Predictive baseline parameters were age, body height, Cobb angle (major curve), curve type, and DRU grades. Prediction models of final body height (R 2 = 0.735, P < .001) and remaining height increase (R 2 = 0.742, P < .001) were established.
Conclusions:
Final body height prediction model was derived for female patients with AIS, with baseline body height and ulnar grading having larger impacts than other parameters.
Keywords
Introduction
Idiopathic scoliosis is a three-dimensional spinal deformity presenting as a lateral curvature with vertebral rotation. 1 It accounts for approximately 80% of all scoliosis cases, 2,3 and has a female-to-male ratio of 5.4:1 for scoliotic curves greater than 20°, and up to 7.2:1 for greater than 40°. 4,5 Adolescent idiopathic scoliosis (AIS) usually occurs at the prepubertal and pubertal growth spurt. On diagnosis, these growing patients and their parents frequently express concerns of whether such spinal curvature will affect their final body height and what the final height will be. This is a valid clinical question as body height is an essential component of body composition, and girls with AIS were found to be shorter than healthy controls at prepubertal phase, 6,7 and abnormal growth patterns were observed in patients with severe spinal curvatures. 8 Total body height in scoliosis patients is believed to be affected due to their spine deformity, as there are various methods of calculating loss of body height associated with scoliosis. 9 Contrasting findings, however, are also presented. Patients with scoliosis were found to have no difference in growth when compared to their healthy peers, 10 while other cross-sectional studies found that girls with AIS are taller than healthy controls of the same maturity status during puberty. 8 This is particularly the case for girls with severe idiopathic scoliotic curves at 12 years of age, 11 and for both genders aged 7 to 15 years who were found taller than the healthy controls in a Swedish study. 12 Nonetheless, the height difference between those with or without scoliosis becomes diminished with increasing age, 12 and girls with idiopathic scoliosis were not any taller than their average peers after reaching maturity. 13
As the final body height of an individual is largely predetermined due to genetics, 14 we explore the relationships between various parameters at the time of initial diagnosis and the final height at skeletal maturity. These remain unknown in patients undergoing conservative treatment such as bracing or monitoring only. It is also necessary to particularly explore the effect of change of curve magnitude on height, and clinically useful to give an evidence-based academic answer to parents. Hence, this study aims to investigate the possibility of predicting the final body height when patients are first diagnosed with AIS, and what associated factors can be identified at initial presentation for prediction. This study wants to provide a guide for the final height of AIS patients given the effects of curve magnitude at initial presentation, with the role of curve deterioration being closely examined.
Patients and Methods
Study Design and Methods
This was a retrospective study of consecutive patients attending one of two territory-wide tertiary referral scoliosis clinics between July 2014 to December 2016. Female patients who were diagnosed with AIS and followed-up until skeletal maturity were studied. Skeletal maturity was defined as Risser stage 4 or later, no changes of body height and arm span as compared to the previous 6-month follow-up, and postmenarche 2 years. All included subjects were not suffering from malnutrition, anorexia, or bulimia nervosa, and were not having any developmental delay. Patients were excluded if they were diagnosed with non-idiopathic scoliosis or had undergone surgery (Figure 1). Ethics was approved by the local institutional review board and parental written informed consent was gained.
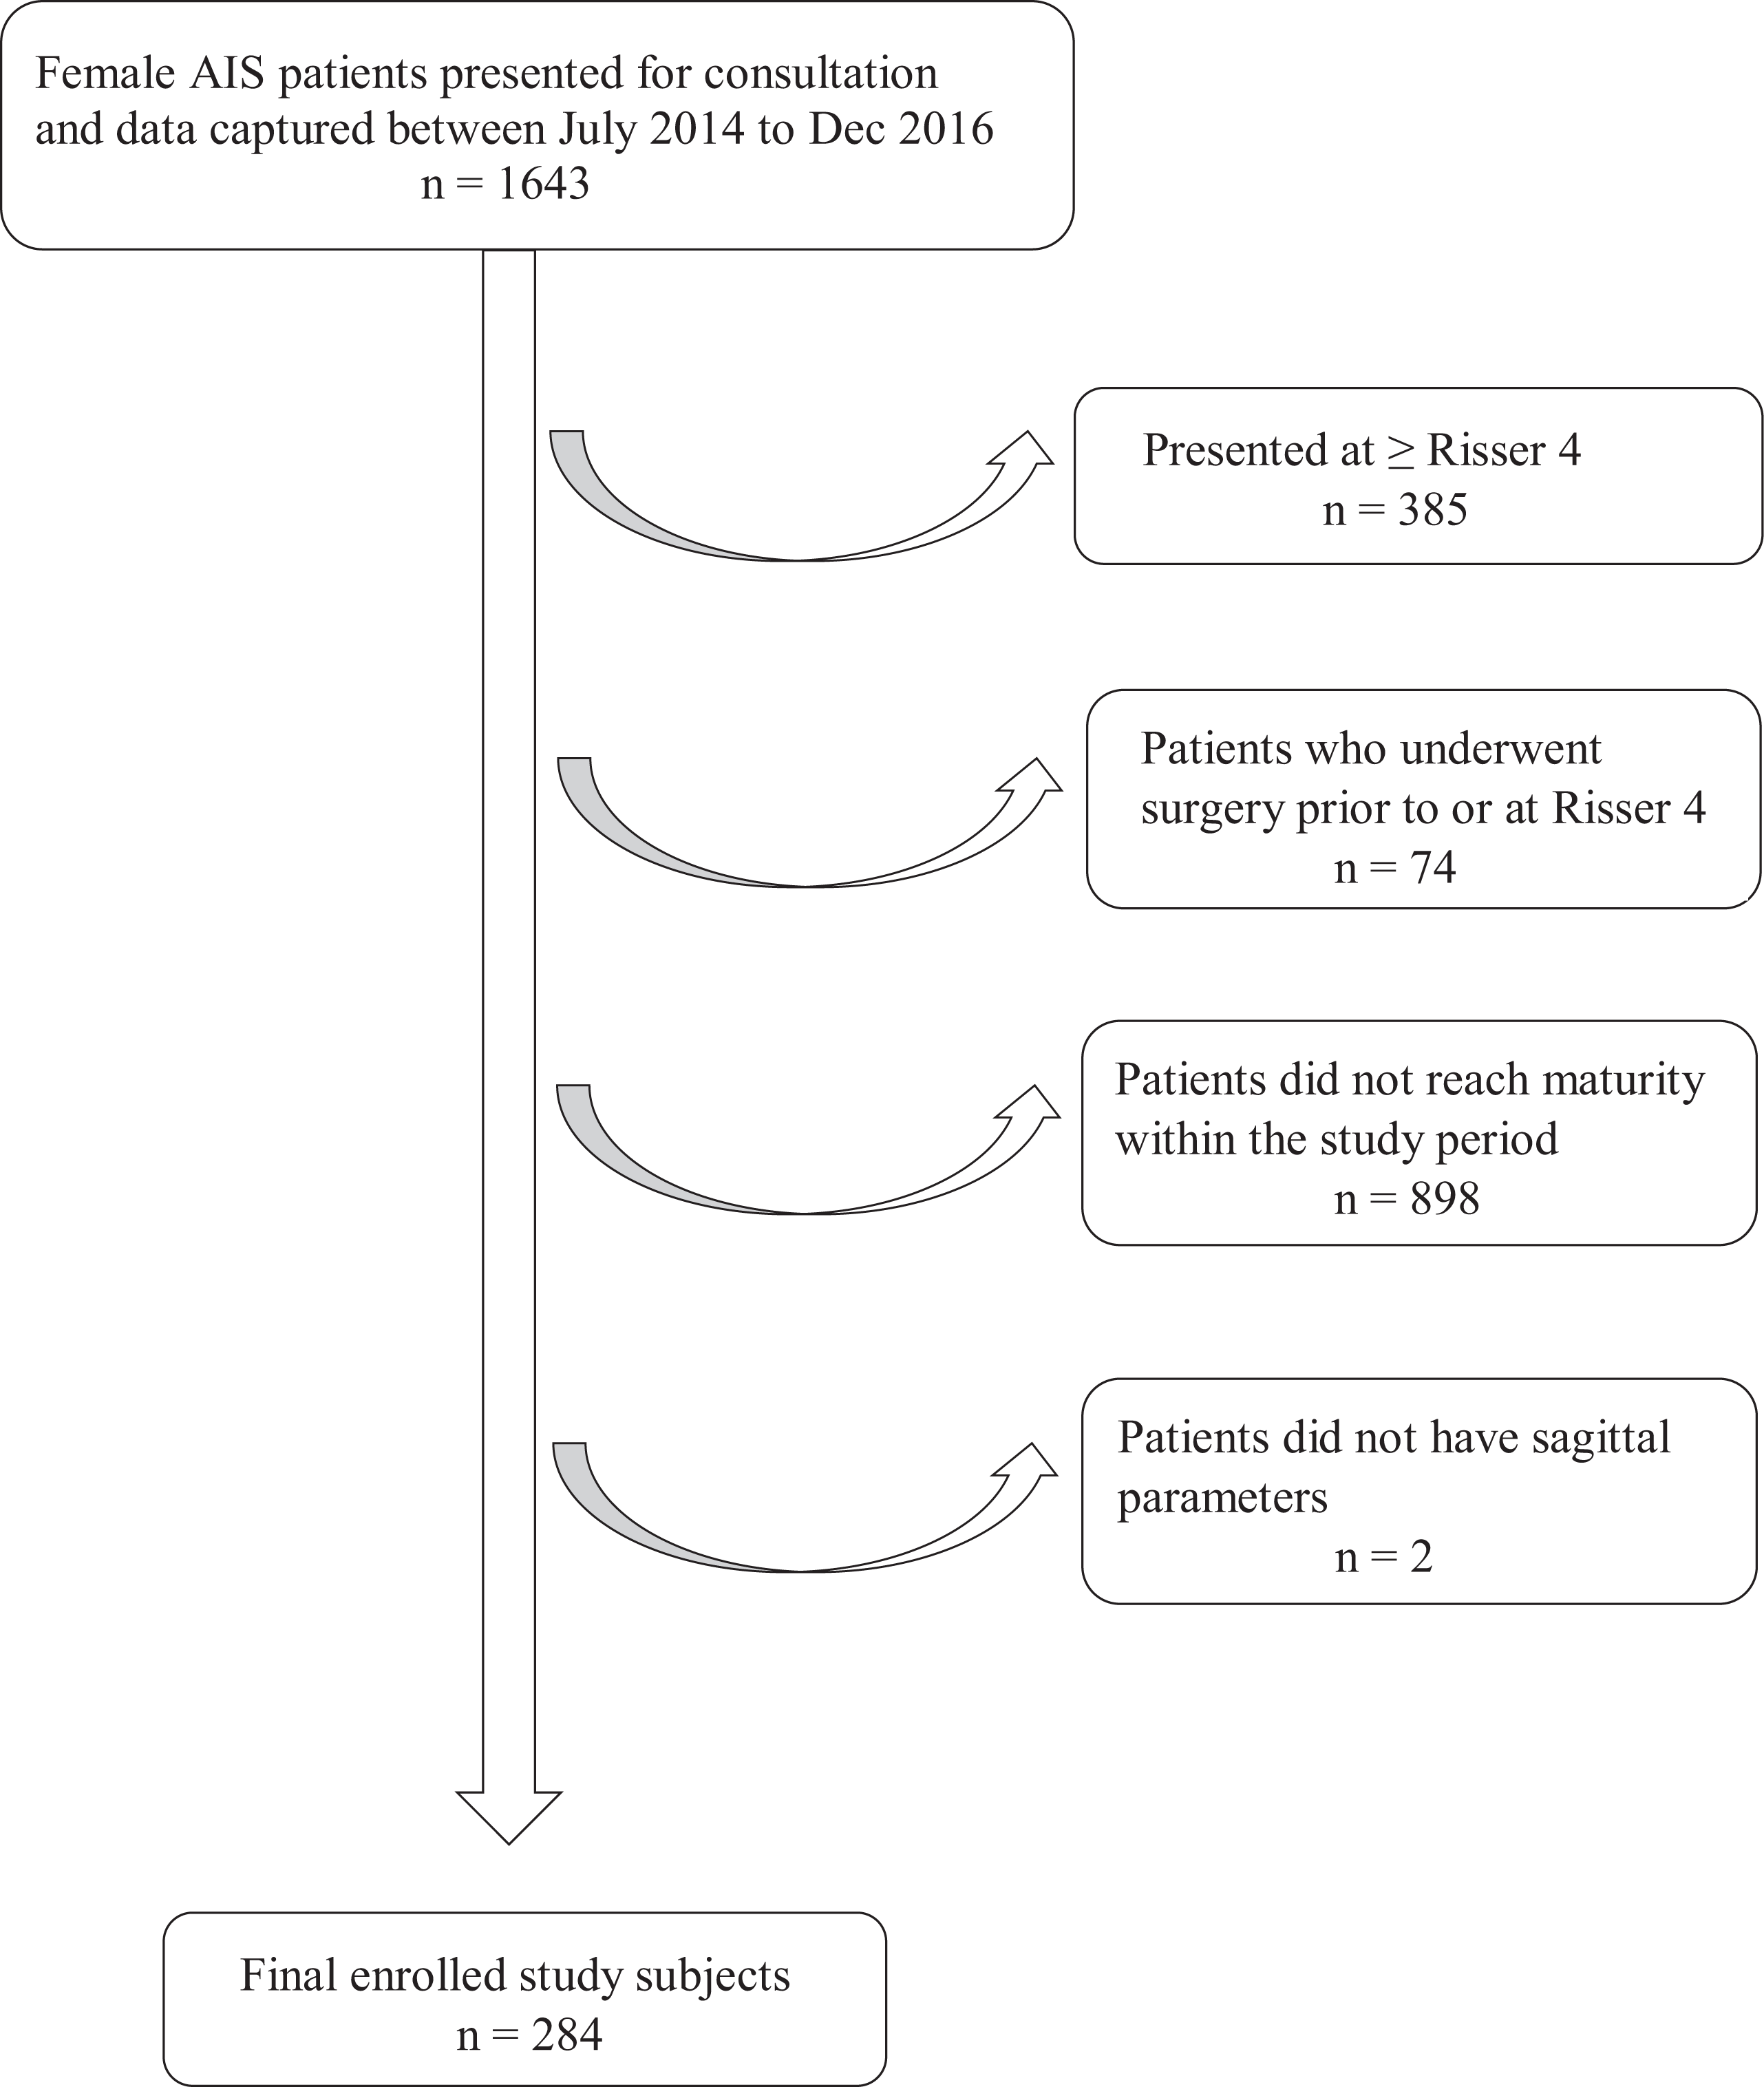
Patient recruitment. AIS, adolescent idiopathic scoliosis. n = number of subjects.
Data Collection
As a routine practice for each patient, standing body height and arm span were measured in a standardized manner by a trained clinical assistant before consultation. Standing body height was measured with patients standing bare feet together in an upright position against the wall-mounted stadiometer. Arm span was measured with the patient standing with heels together against the wall-mounted horizontal bench rule, and both arms raised to shoulder height at a right-angle and parallel to the ground. Measurement was taken from the fingertip of the middle finger contacting a vertical surface at one end to the longest fingertip of the other hand. Curve magnitude in Cobb angles 15 was measured on the standing posteroanterior spine radiograph by the attending specialists without prior knowledge of the study, whereas sagittal profile (thoracic kyphosis and lumbar lordosis) was assessed on the standing lateral spine radiograph. Thoracic kyphosis was measured as the angle from the upper endplate of T5 to the lower endplate of T12, and lumbar lordosis was the angle measured from the upper endplate of L1 to the upper endplate of S1. Curve types were recorded using the Lenke classification. 16
Patients’ initial presentation at the clinic was considered the baseline and the visit at which the patients reached our criteria for skeletal maturity was considered the final time point. The baseline and final growth parameters (body height, arm span) and Cobb angles of the major and minor curve were recorded, together with their corresponding skeletal maturity status and date of menarche. Skeletal maturity was assessed by Risser staging (0 to 5) on the posteroanterior spine radiograph, 17,18 and the distal radius and ulna (DRU) classification 19,20 (R1 to R11, U1 to U9) and Sanders staging 21 (SS1 to SS8) by the left hand-wrist radiograph.
Parameters Definition
Remaining height increase potential was derived from the difference between final height at skeletal maturity and baseline height (Remaining height increase potential (%) = (Final height – baseline height)/baseline height × 100%). This representation in percentage reflects the remaining growth potential independent of the absolute value of baseline body height and indicates how close the female patient is to her final body height. Curve deterioration was determined as any >5° increase of the major curve Cobb angle at the final follow-up compared with baseline. For menarchal status at initial presentation, premenarche and postmenarche were coded as 0 and 1, respectively.
Statistical Analysis
Descriptive statistics were presented as mean values with standard deviations and/or 95% confidence interval (CI) where appropriate for continuous variables, and percentages for frequencies and counts. The role of curve deterioration at maturity was examined through stratifying patients into curve deterioration and non-deterioration groups. Intergroup comparison was performed on parameters including remaining height increase potential (in percentages) at individual skeletal maturity grading, and final body height and arm span using independent-samples t test or Mann-Whitney test depending on the results of the tests of normality.
Univariate analyses were performed between independent variables at baseline and the 2 outcome variables: (a) final body height and (b) remaining body height increase potential, using Spearman’s correlation and Kendall’s tau-b (τb) correlation tests. Their respective coefficients, rs and τb, indicate the strength of associations. Tests for linearity, multicollinearity (variance inflation factor and tolerance), and subsequent test for autocorrelation (Durbin-Watson) revealed no violations. Multiple linear regression was used for predicting the absolute value of final height (in centimeters) and remaining height increase potential (in percentages), with the significant independent variables identified (those with P < .20). 22
The performance and robustness of the regression models were assessed and validated using bootstrapping. Bootstrapping was preferred over cross-validation because it did not compromise sample size, as it took random resampling by replacement from the original dataset. 23 The process of resampling was repeated 2000 times to ensure random sampling. In addition, we obtained measures of accuracy to sample estimates, and derived robust estimates of the prediction models found. Prediction bias (zero bias indicates an unbiased estimation method), 24 CIs, and standard errors (root mean squared errors) were computed, 25 -27 as well as Bias-Corrected and Accelerated Bootstrap (BCa) which further refined the prediction models.
Statistical analyses were conducted using SPSS Windows 26.0 (IBM Corp). Statistical significance was considered with a P value of less than .05.
Results
A total of 284 female idiopathic scoliosis patients were included for analyses (Figure 1) after excluding patients presenting at Risser 4 or later (n = 385), patients who underwent surgery (n = 74), patients who have yet reached skeletal maturity (n = 898) and those who have missing sagittal parameters (n = 2). The mean age at initial presentation was 12.2 ± 1.1 years, with 52.5% being premenarchal. At baseline, the most frequent skeletal grades of each maturity index were as follows: Risser 0 (52.5%), radius grade (R) 6 (38.4%), ulnar grade (U) 5 (35.9%) and Sanders stage (SS) 3 (35.2%). There were 74.3% of patients who underwent bracing. The mean follow-up duration was 4.3 ± 1.6 years (Table 1).
Baseline Patient Demographics.
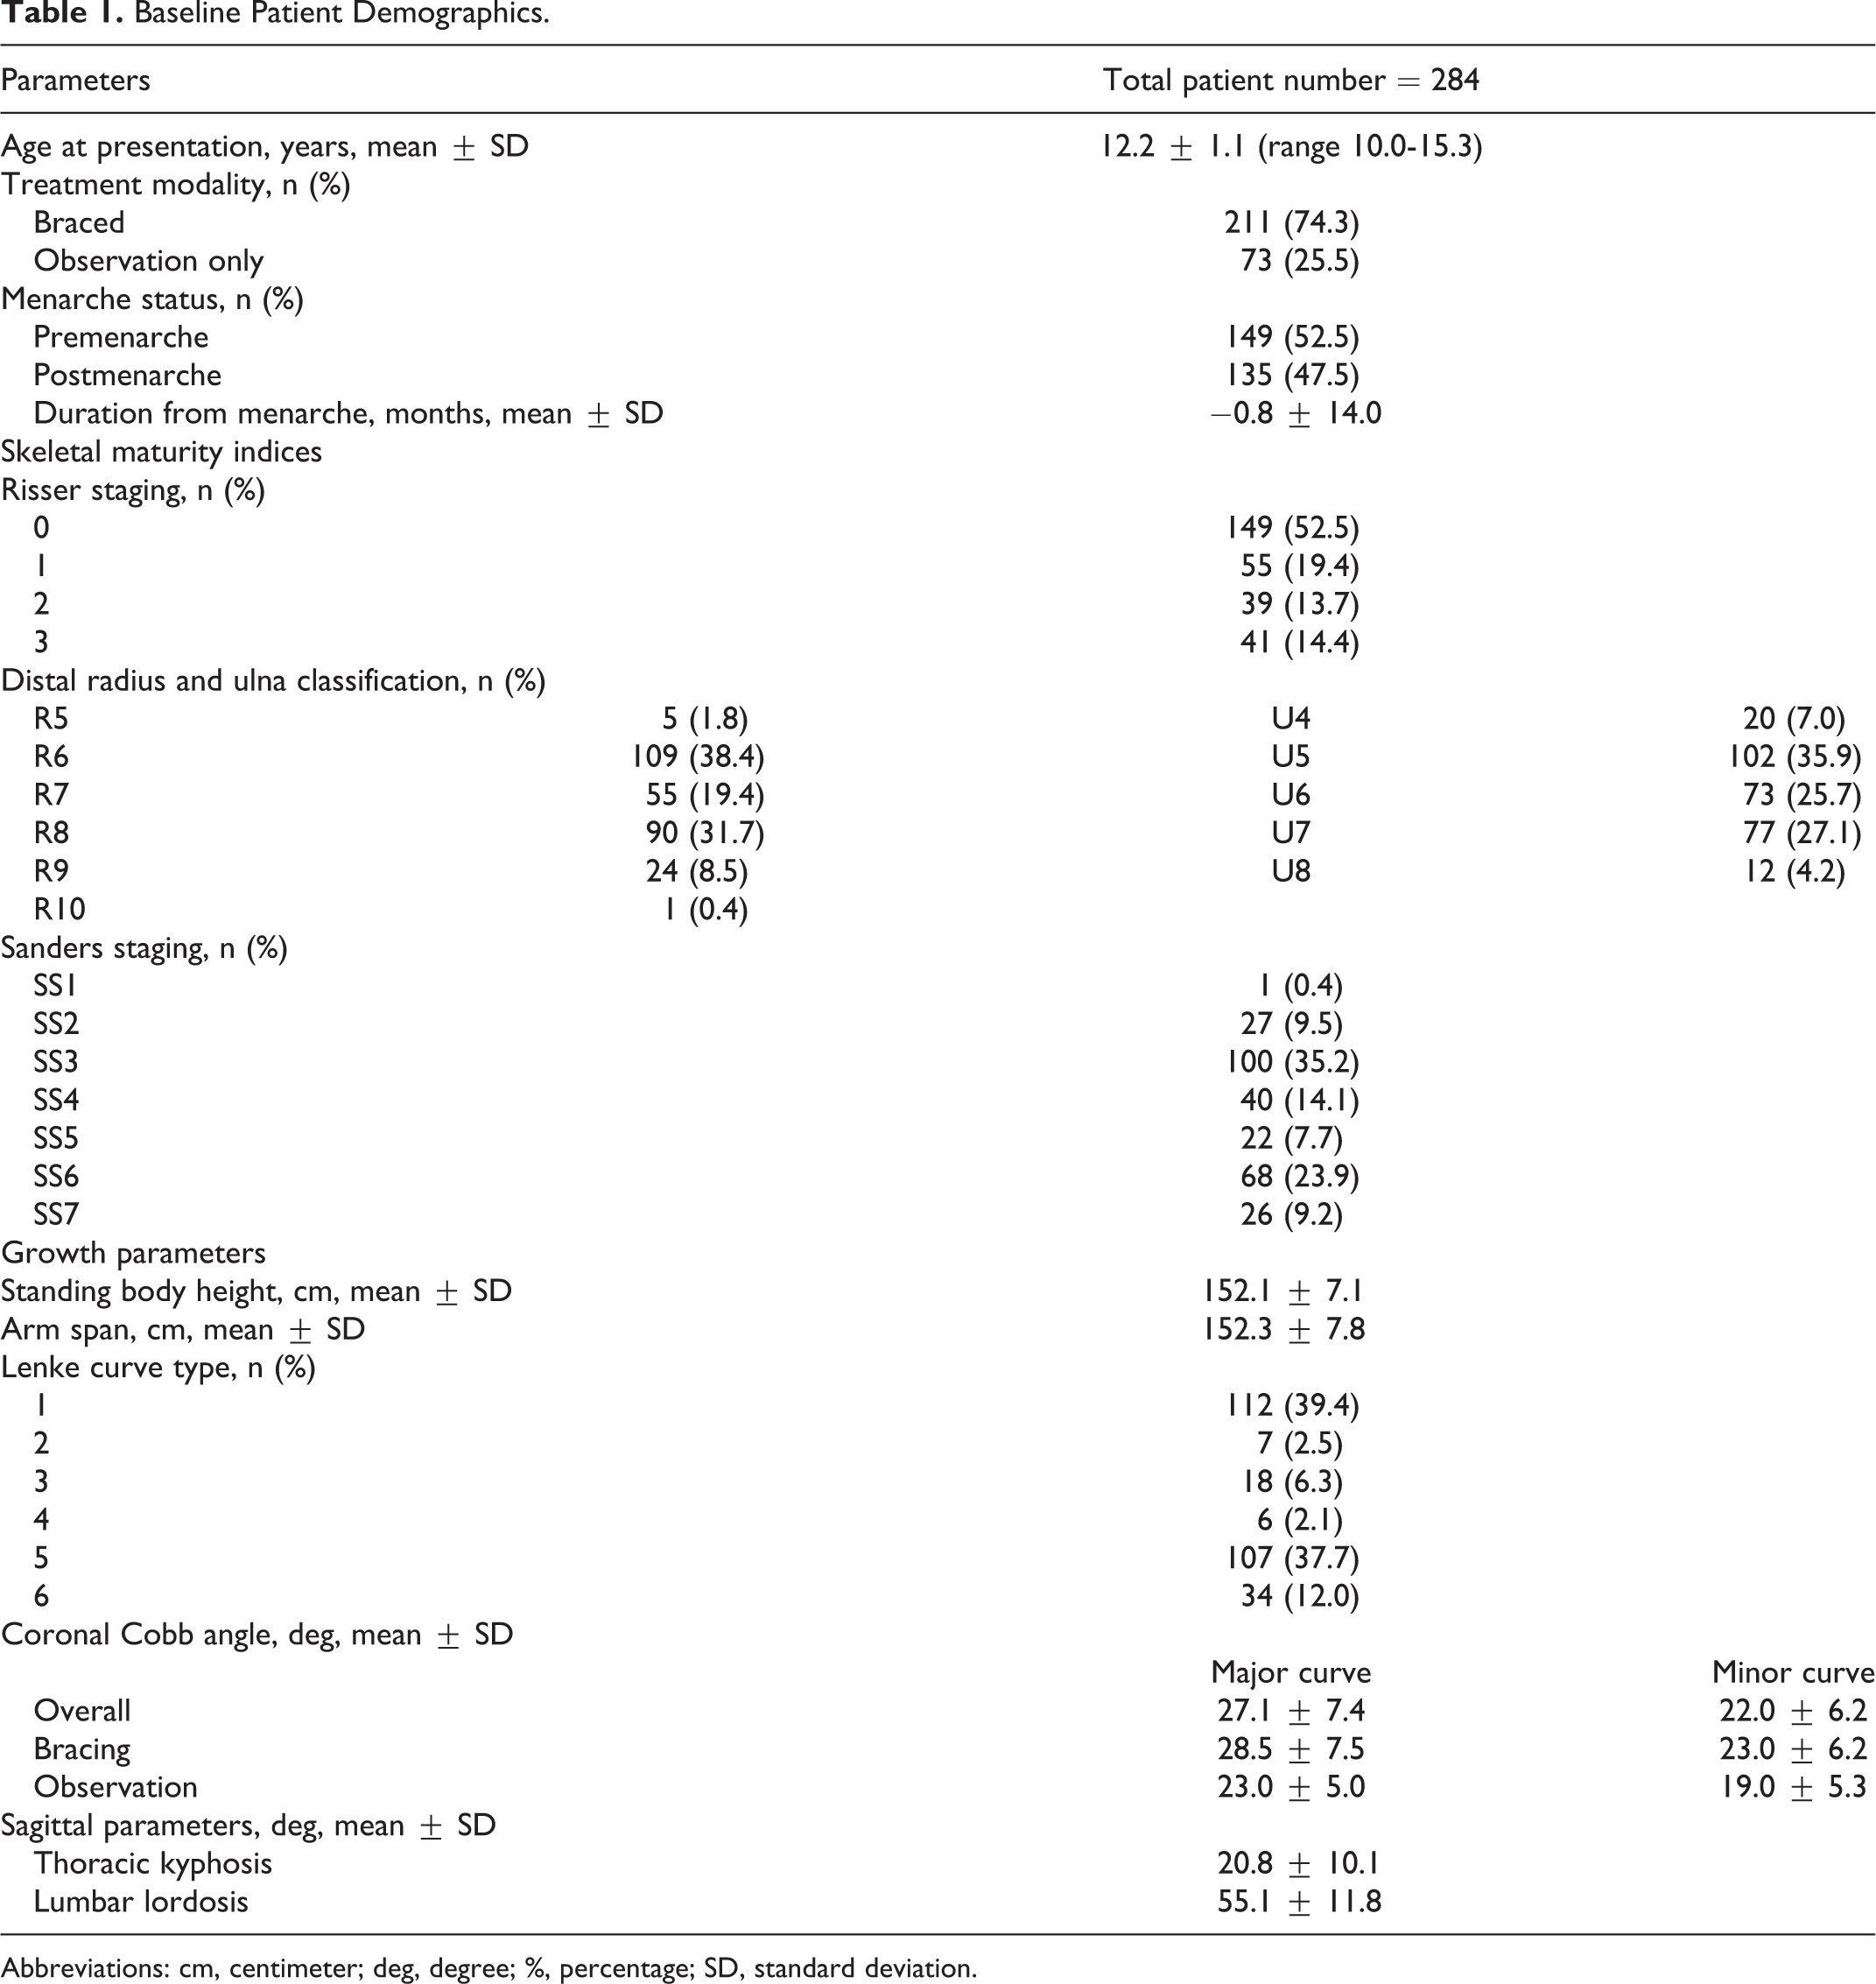
Abbreviations: cm, centimeter; deg, degree; %, percentage; SD, standard deviation.
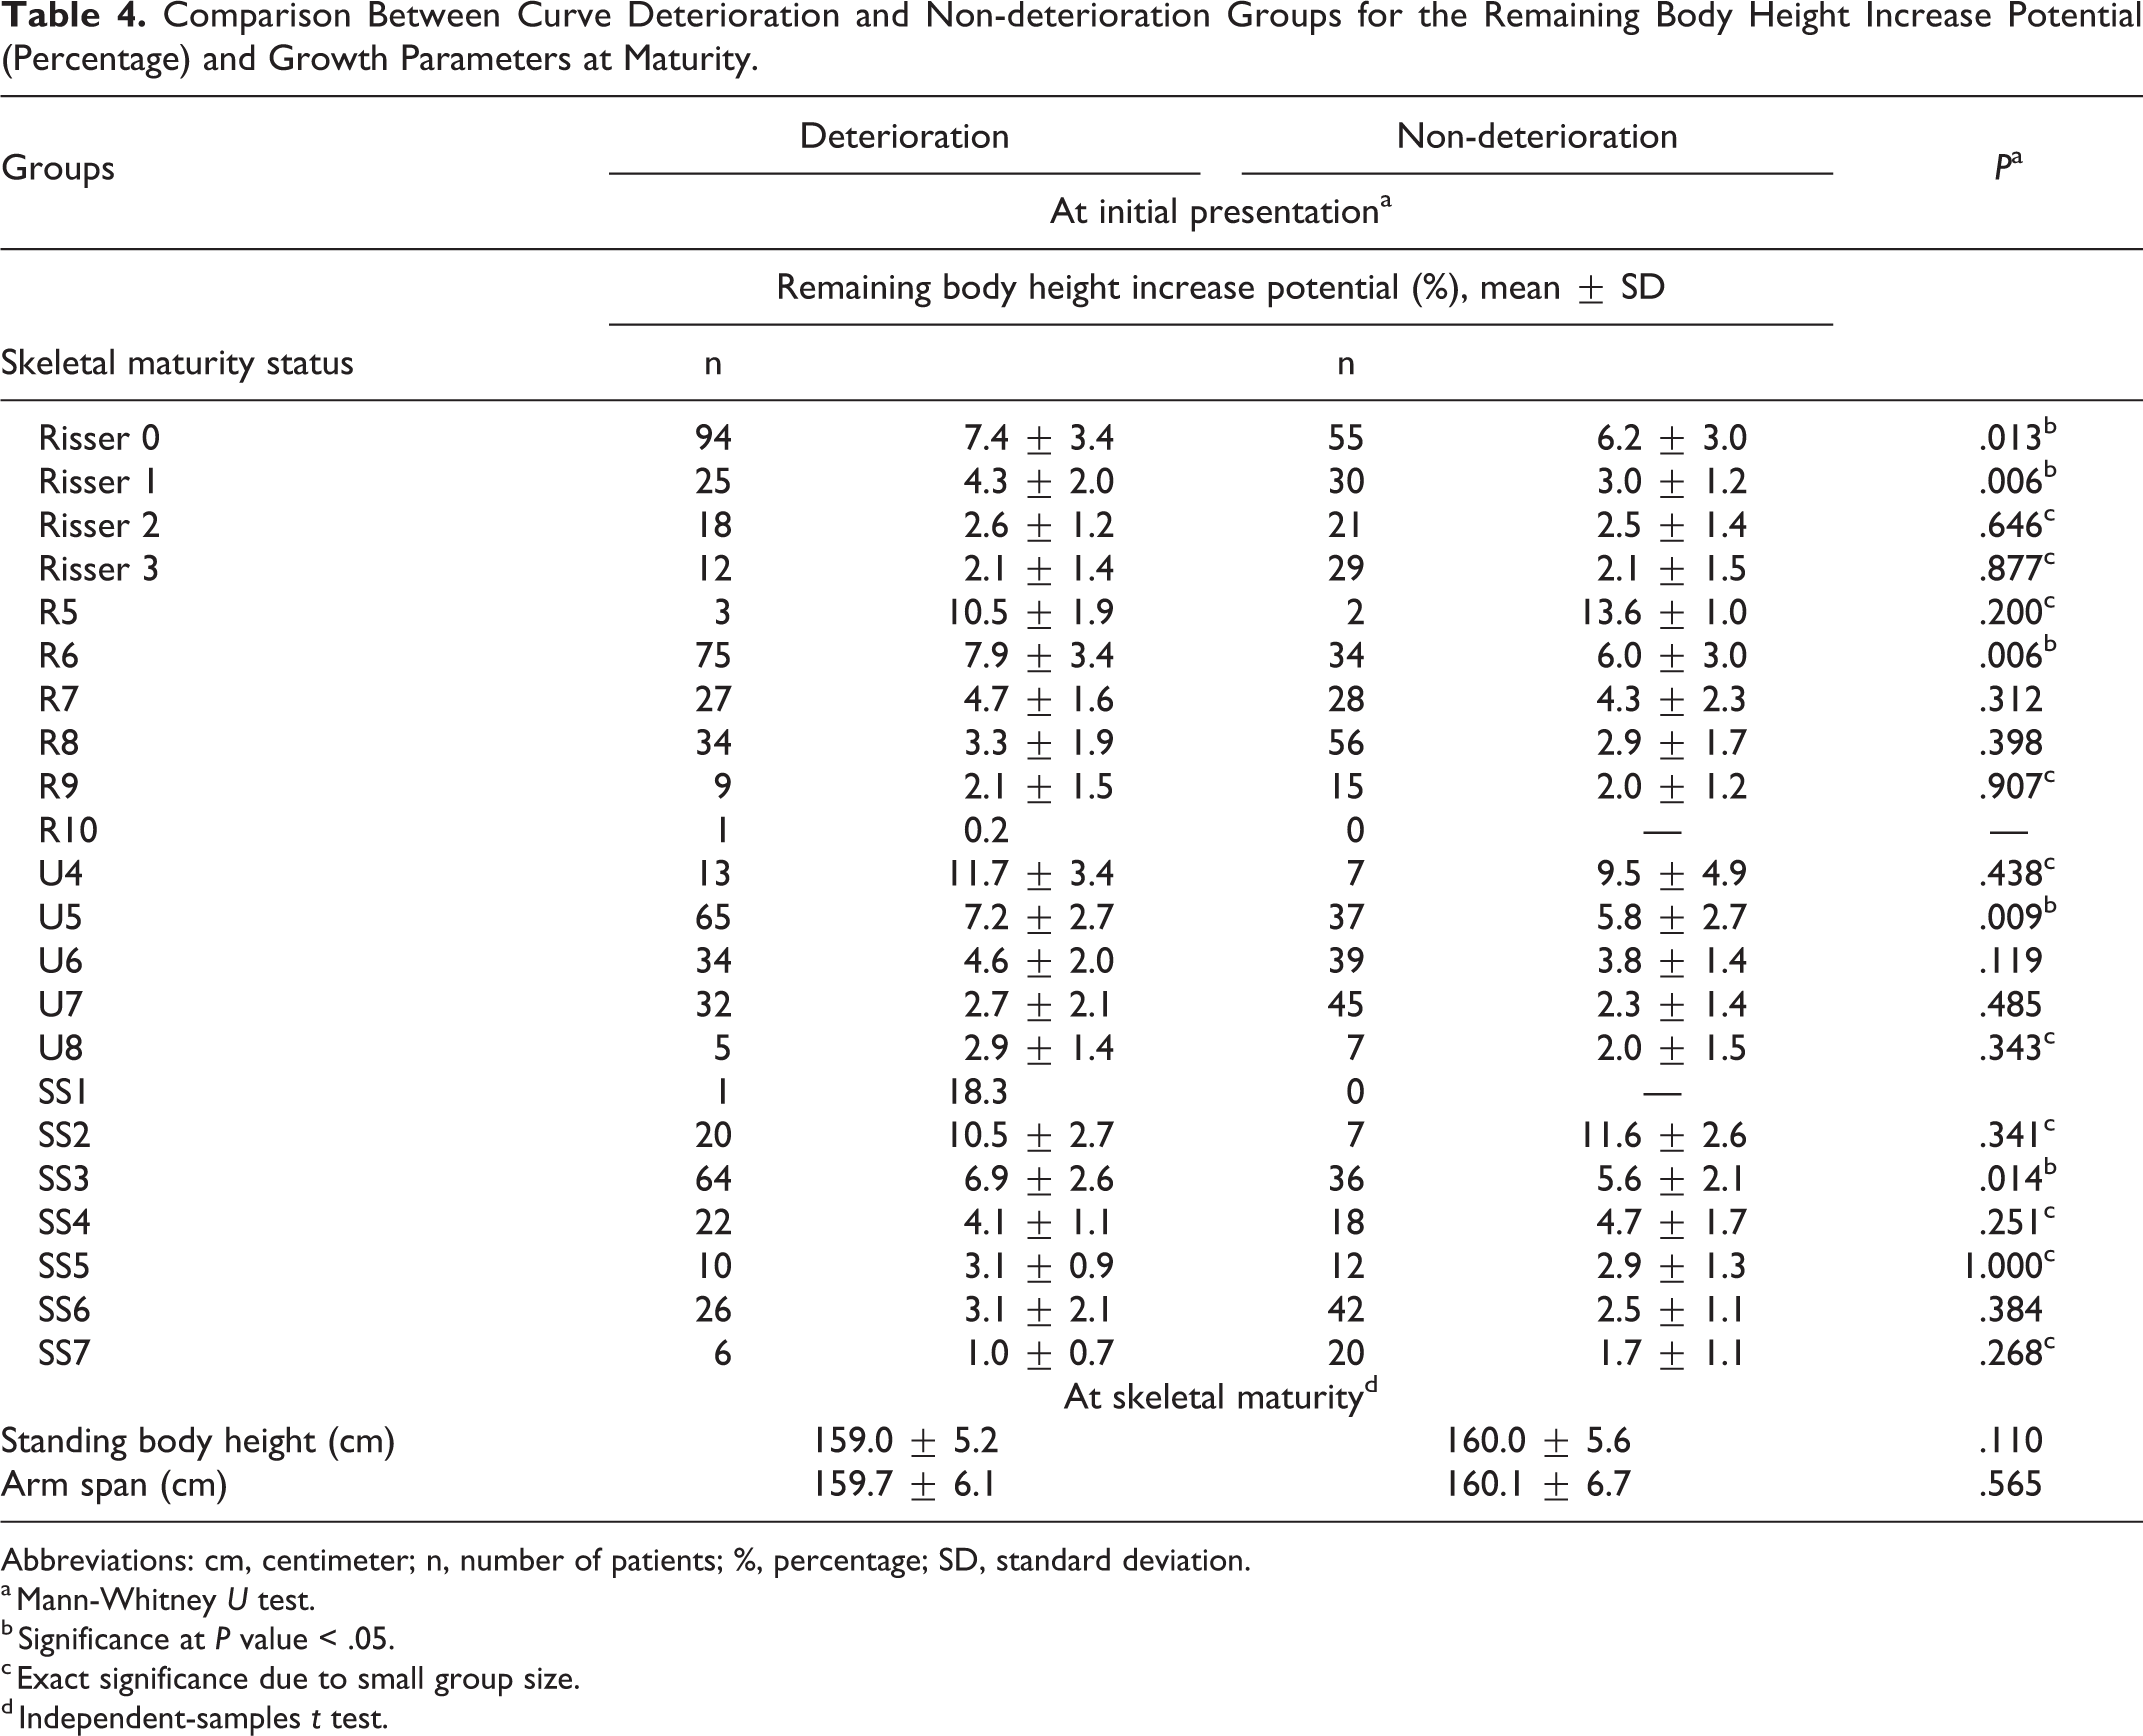
As presented in Table 2, the mean baseline and final standing body height were 152.1 ± 7.1 cm (95% CI 151.2-152.9 cm) and 159.5 ± 5.4 cm (95% CI 158.9-160.1 cm), respectively. The major curve Cobb angle was 27.1° ± 7.4° (95% CI 26.2°-28.0°) at baseline and was 32.5° ± 9.3° (95% CI 31.4°-33.6°) at the final time point. For each maturity index, the largest number of patients experiencing curve deterioration at maturity were those initially presented at Risser 0, R6, U5, and SS3, with corresponding increase in major curve Cobb angle of 8.5° ± 10.3°, 10.1° ± 10.5°, 8.5° ± 10.6°, and 8.2° ± 9.6°, respectively (Table 3). The largest remaining height increase potential was 18.3% (24.5 cm, n = 1) for patients presented at SS1, followed by 11.7% ± 2.2% (16.6 ± 2.8 cm) for patients presented at R5. For patients presented at Risser stage 0 or 1, R6, U5, SS3, those with curve deterioration at maturity exhibited greater remaining height increase potential at initial presentation (P < .05), as compared to those without curve deterioration (Table 4). The difference in remaining height increase potential between curve deterioration and non-deterioration groups diminished for patients presented at Risser 2, R7, U6, SS4, and beyond (P > .05) (Table 4, Figure 2). Both groups had comparable final standing body height (P = .110) and arm span (P = .565).
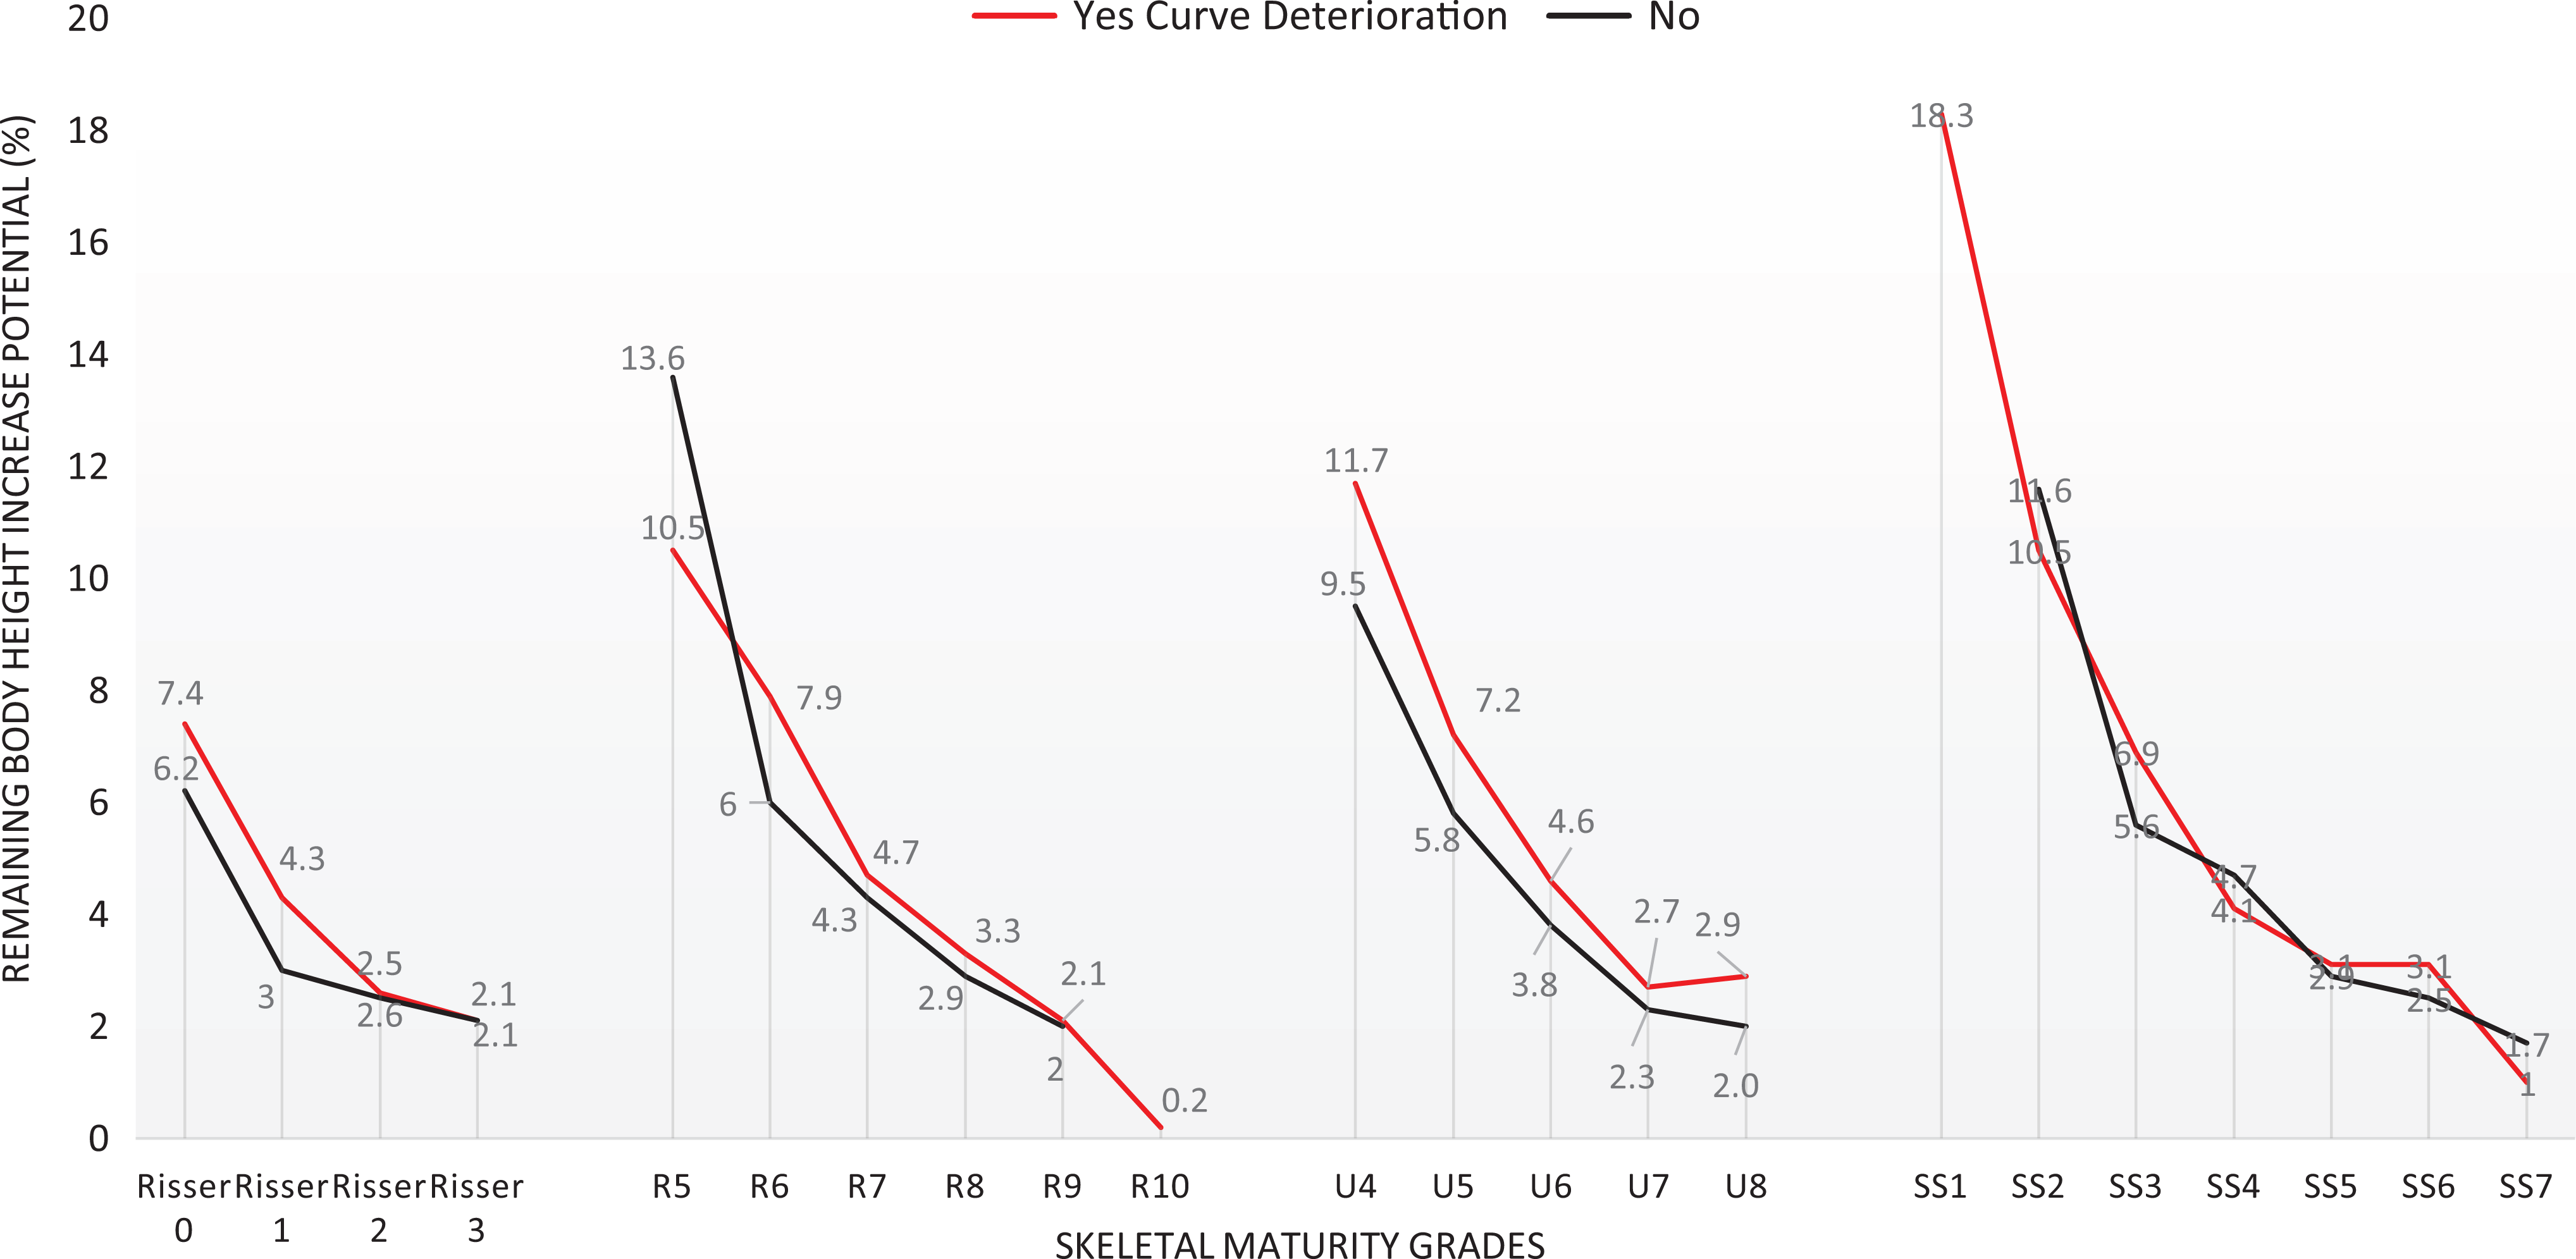
Remaining body height increase potential (%) per skeletal maturity index for curve deterioration and non-deterioration groups.
Mean Standing Body Height and Coronal Cobb Angle at Baseline and Final Time Points.
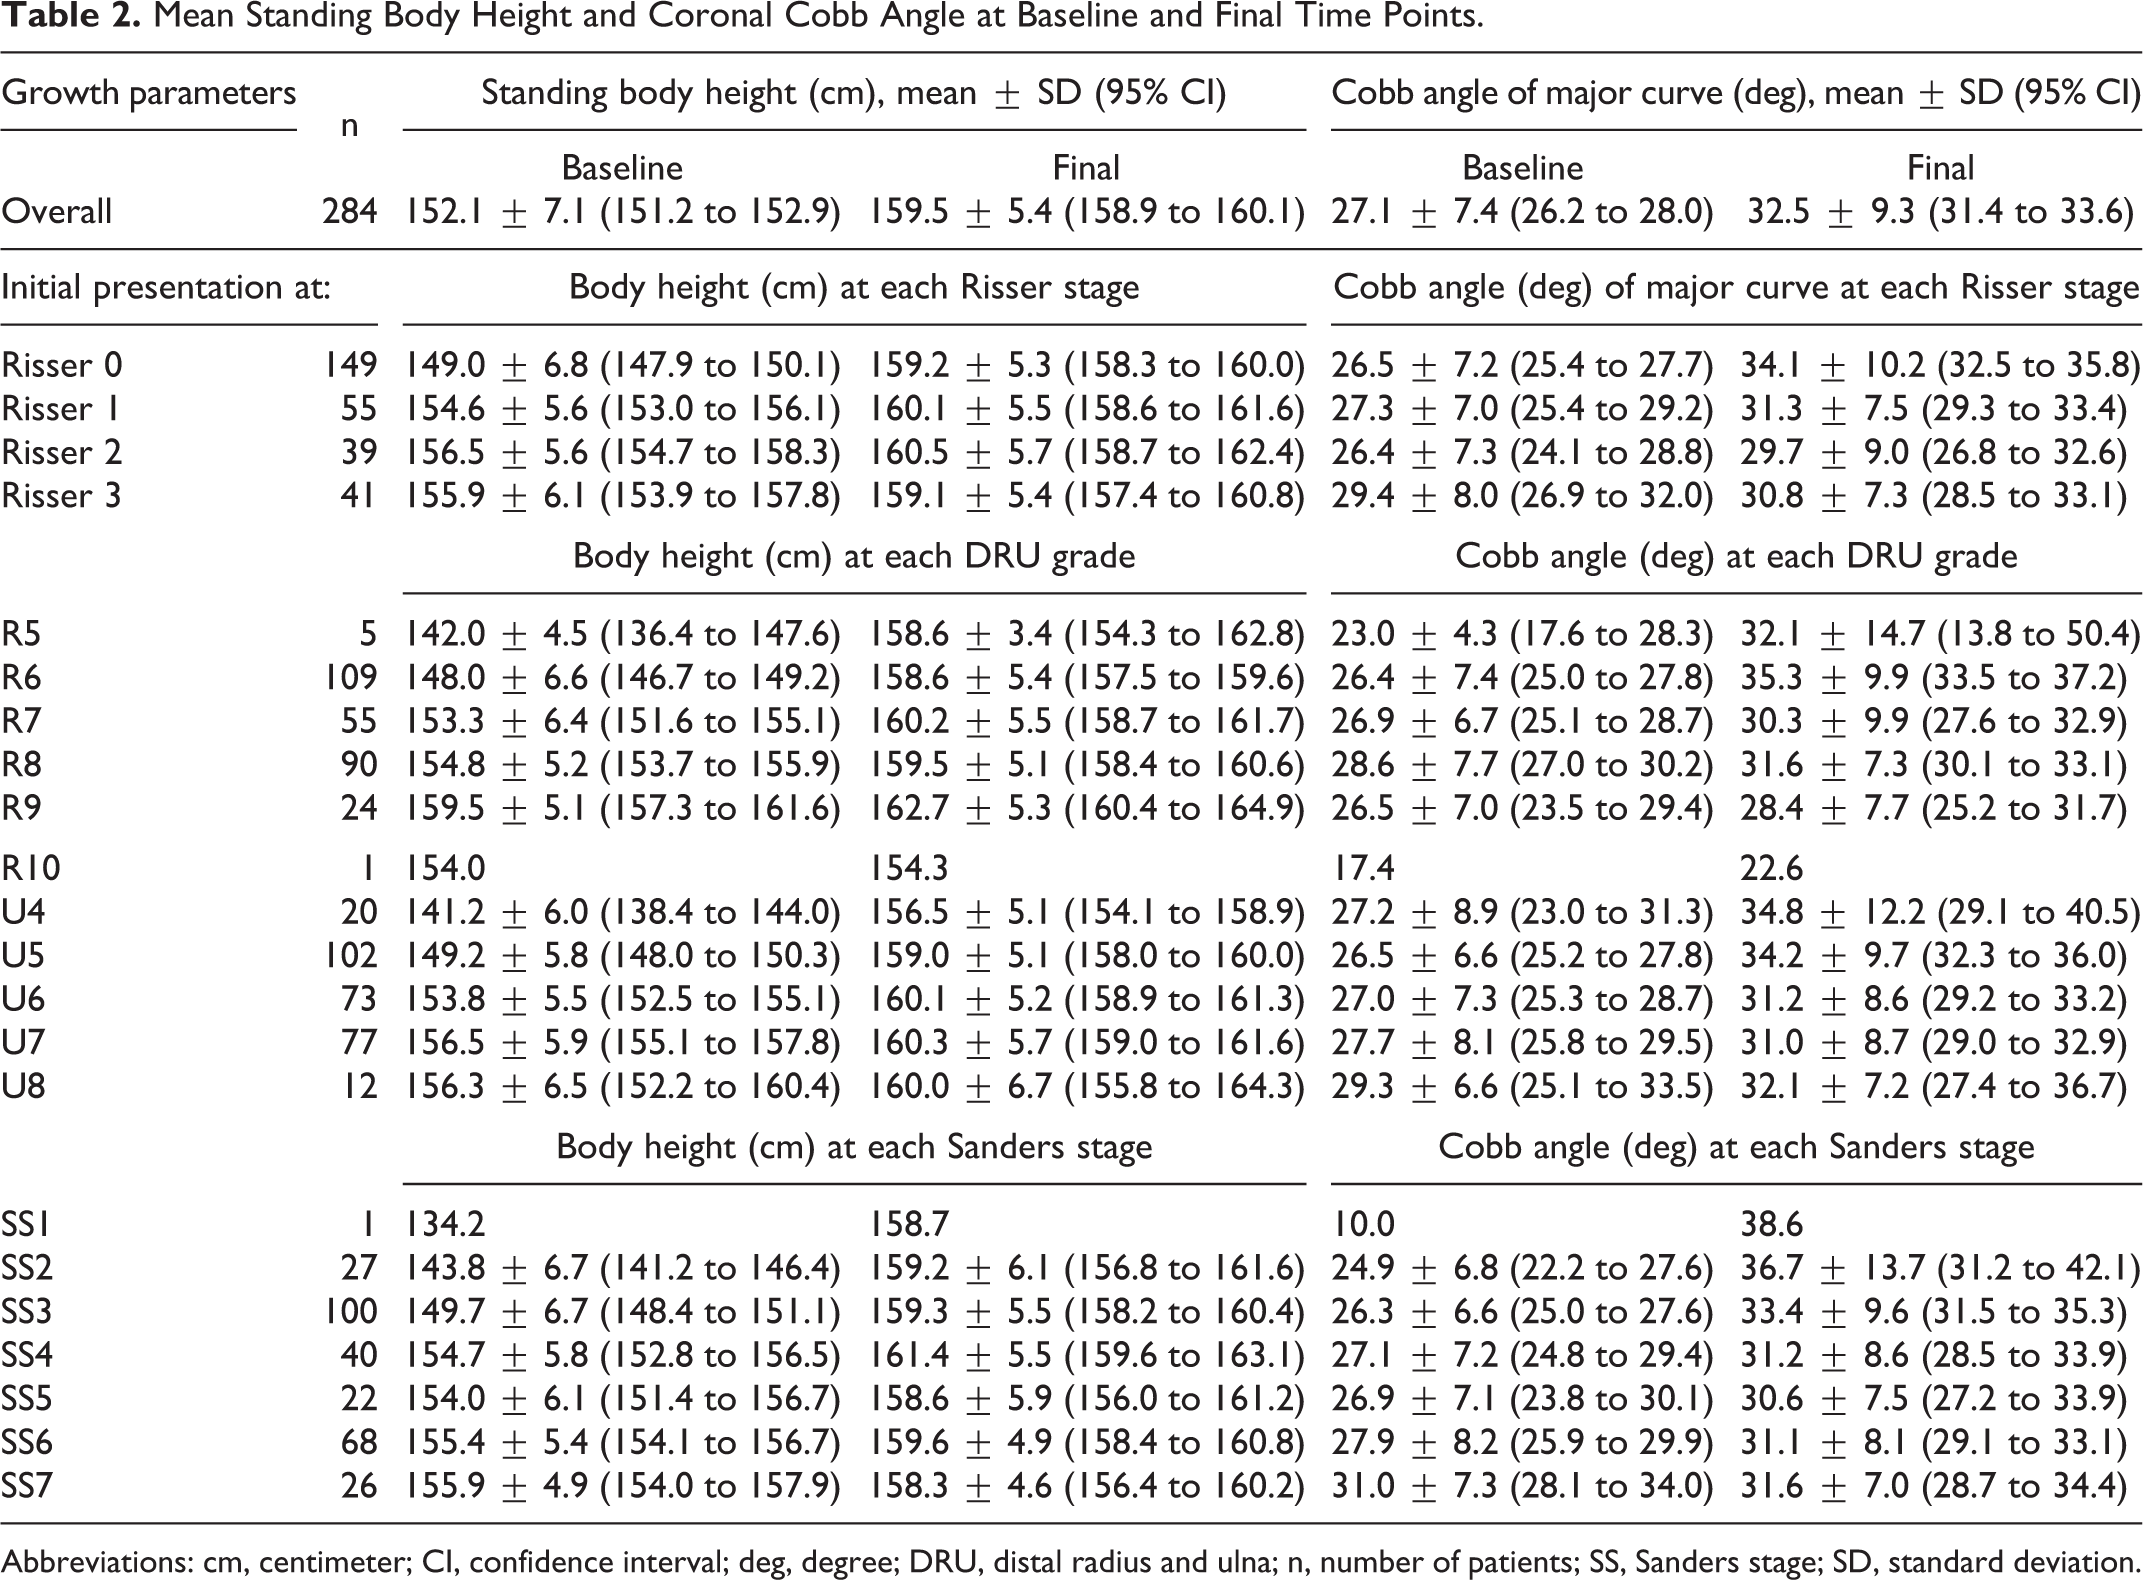
Abbreviations: cm, centimeter; CI, confidence interval; deg, degree; DRU, distal radius and ulna; n, number of patients; SS, Sanders stage; SD, standard deviation.
Remaining Standing Body Height Increase Until Final Height and Cobb Angle Changes per Skeletal Maturity Grade at Baseline.
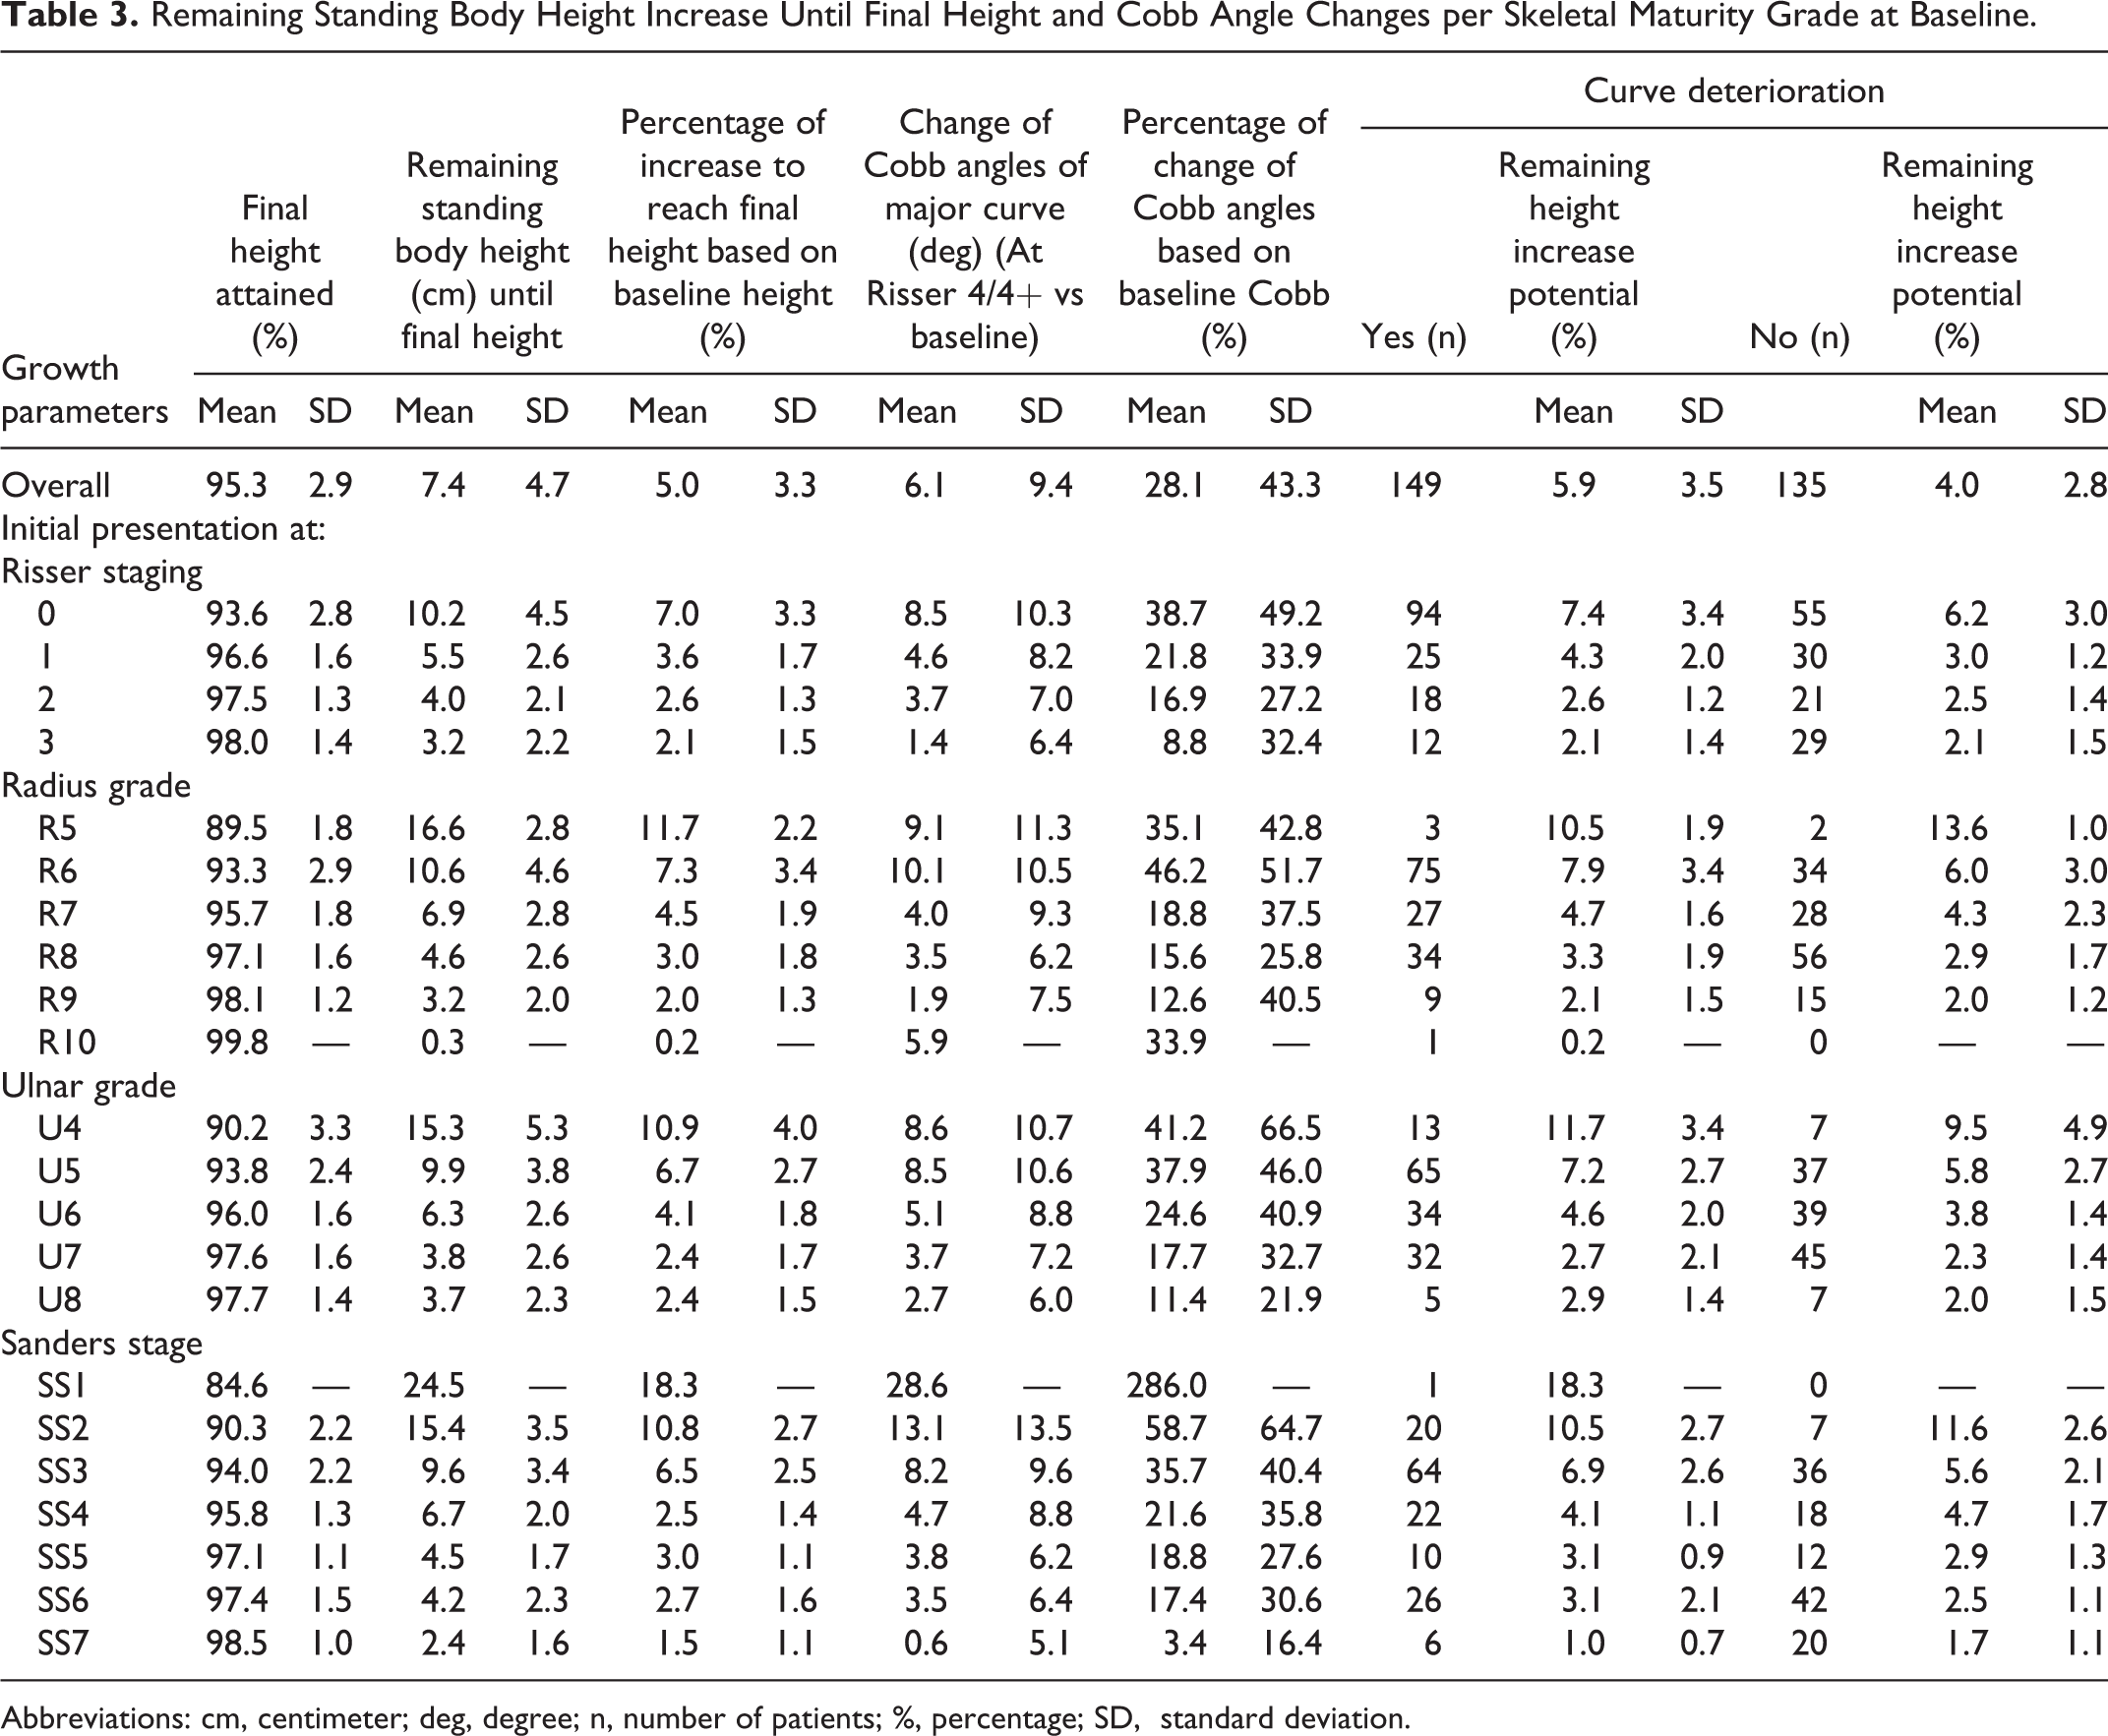
Abbreviations: cm, centimeter; deg, degree; n, number of patients; %, percentage; SD, standard deviation.
Comparison Between Curve Deterioration and Non-deterioration Groups for the Remaining Body Height Increase Potential (Percentage) and Growth Parameters at Maturity.
Abbreviations: cm, centimeter; n, number of patients; %, percentage; SD, standard deviation.
a Mann-Whitney U test.
b Significance at P value < .05.
c Exact significance due to small group size.
d Independent-samples t test.
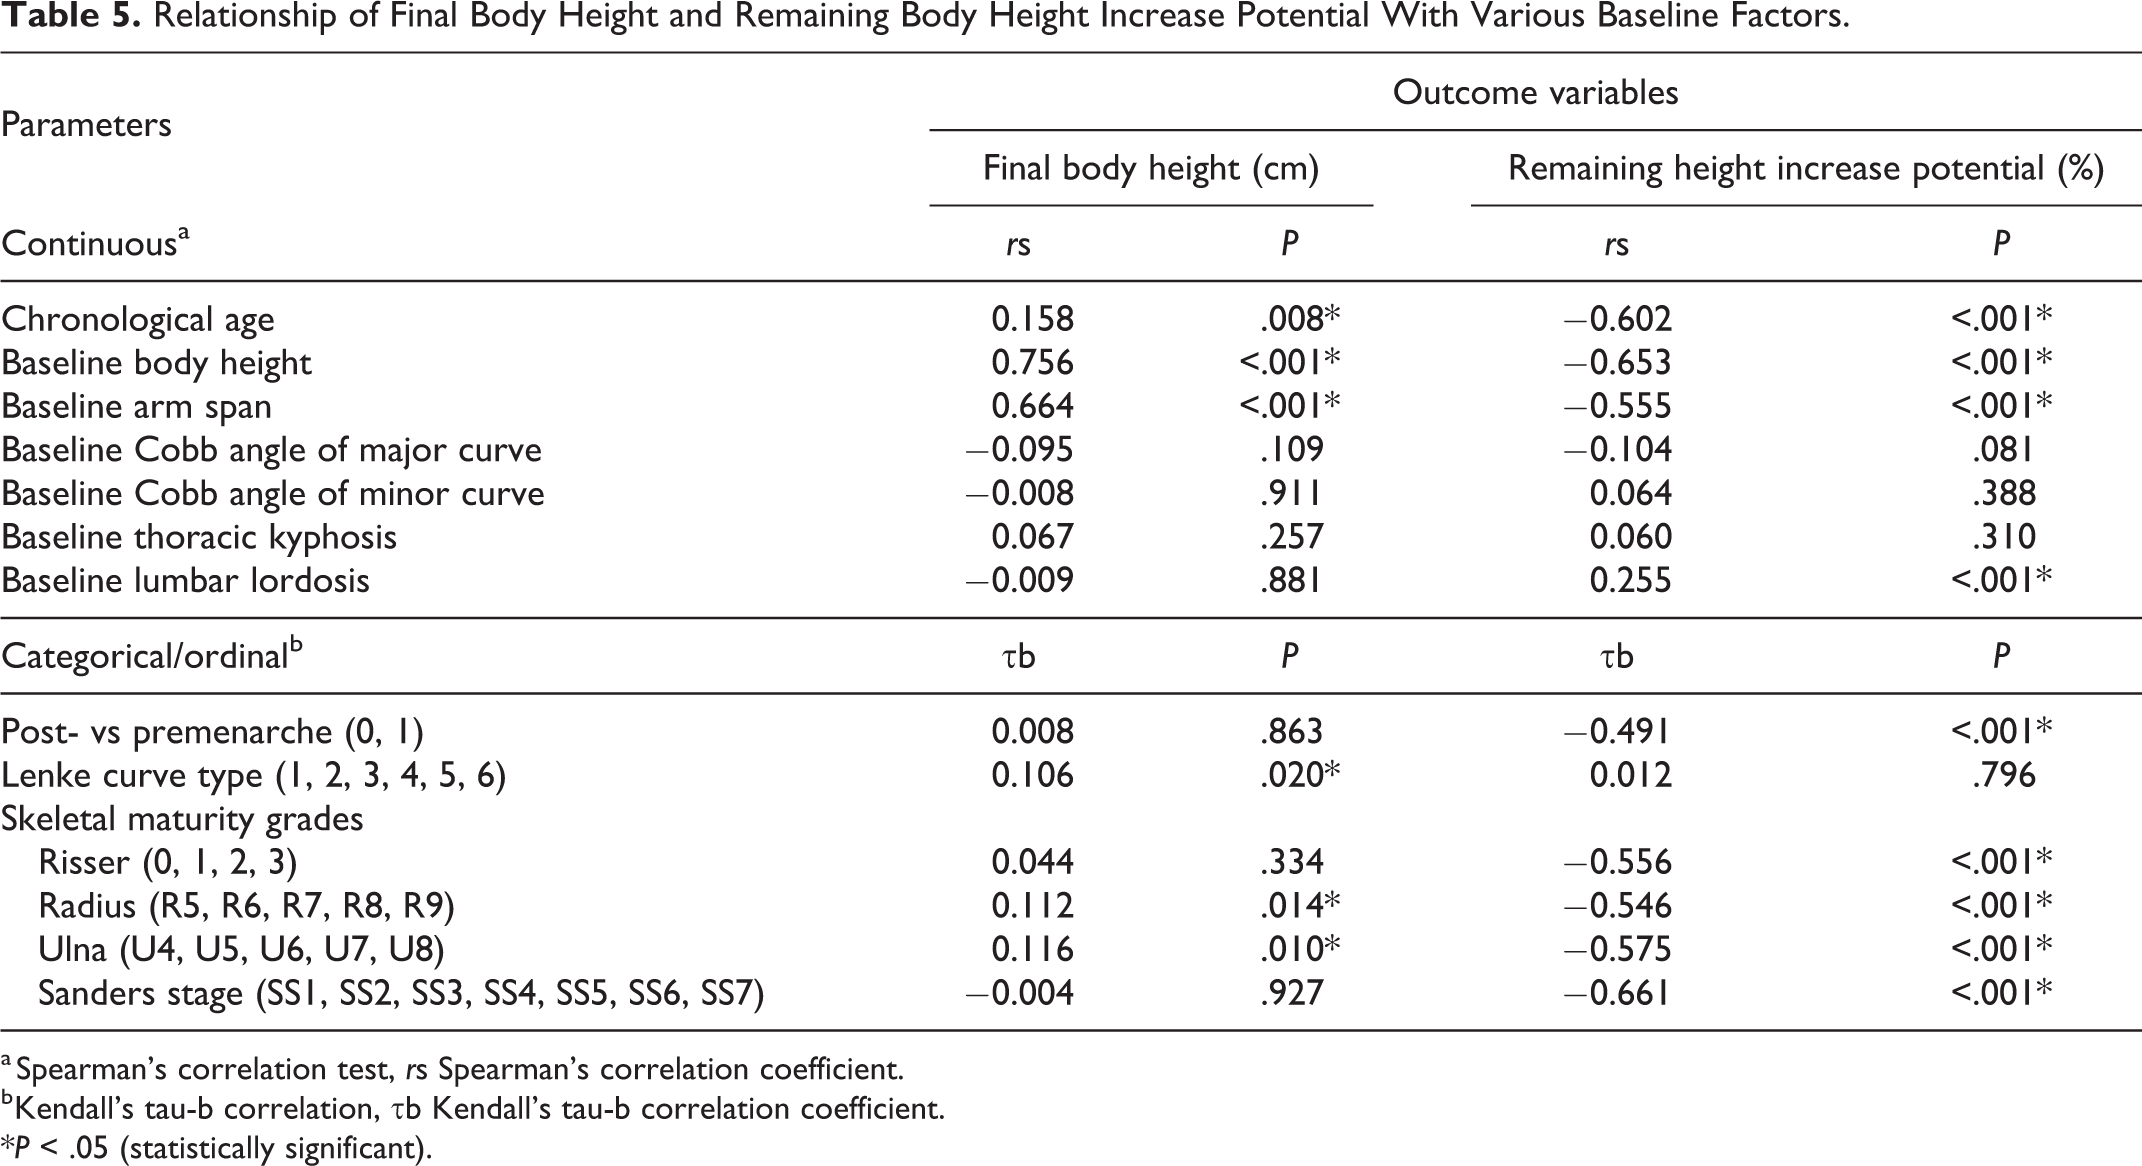
Baseline chronological age, body height, arm span, Lenke curve types, and radius and ulnar grades were significant associating factors for the absolute value of final body height though some relationships were weak (Table 5). The associations of remaining height increase potential were stronger with most of the baseline parameters: age (rs = −0.602, P < .001), body height (rs = −0.653, P < .001), arm span (rs = −0.555, P < .001), menarchal status (post-/pre-) (τb = −0.491, P < .001), Risser staging (τb = −0.556, P < .001), radius (τb = −0.546, P < .001) and ulnar grades (τb = −0.575, P < .001), Sanders staging (τb = −0.661, P < .001), and lumbar lordosis (rs = 0.255, P < .001). Baseline Cobb angle of the major curve had very weak relationships with the outcome variables and was just short of statistical significance (rs = −0.095, P = .109 with final height value; rs = −0.104, P = .081 with remaining height increase potential). These factors were included for multiple regression except baseline arm span. Baseline arm span was excluded to avoid multicollinearity as it correlated strongly with baseline body height (rs = 0.836, P < .001), and it had weaker associations with the 2 outcome variables than baseline body height.
Relationship of Final Body Height and Remaining Body Height Increase Potential With Various Baseline Factors.
a Spearman’s correlation test, rs Spearman’s correlation coefficient.
b Kendall’s tau-b correlation, τb Kendall’s tau-b correlation coefficient.
*P < .05 (statistically significant).
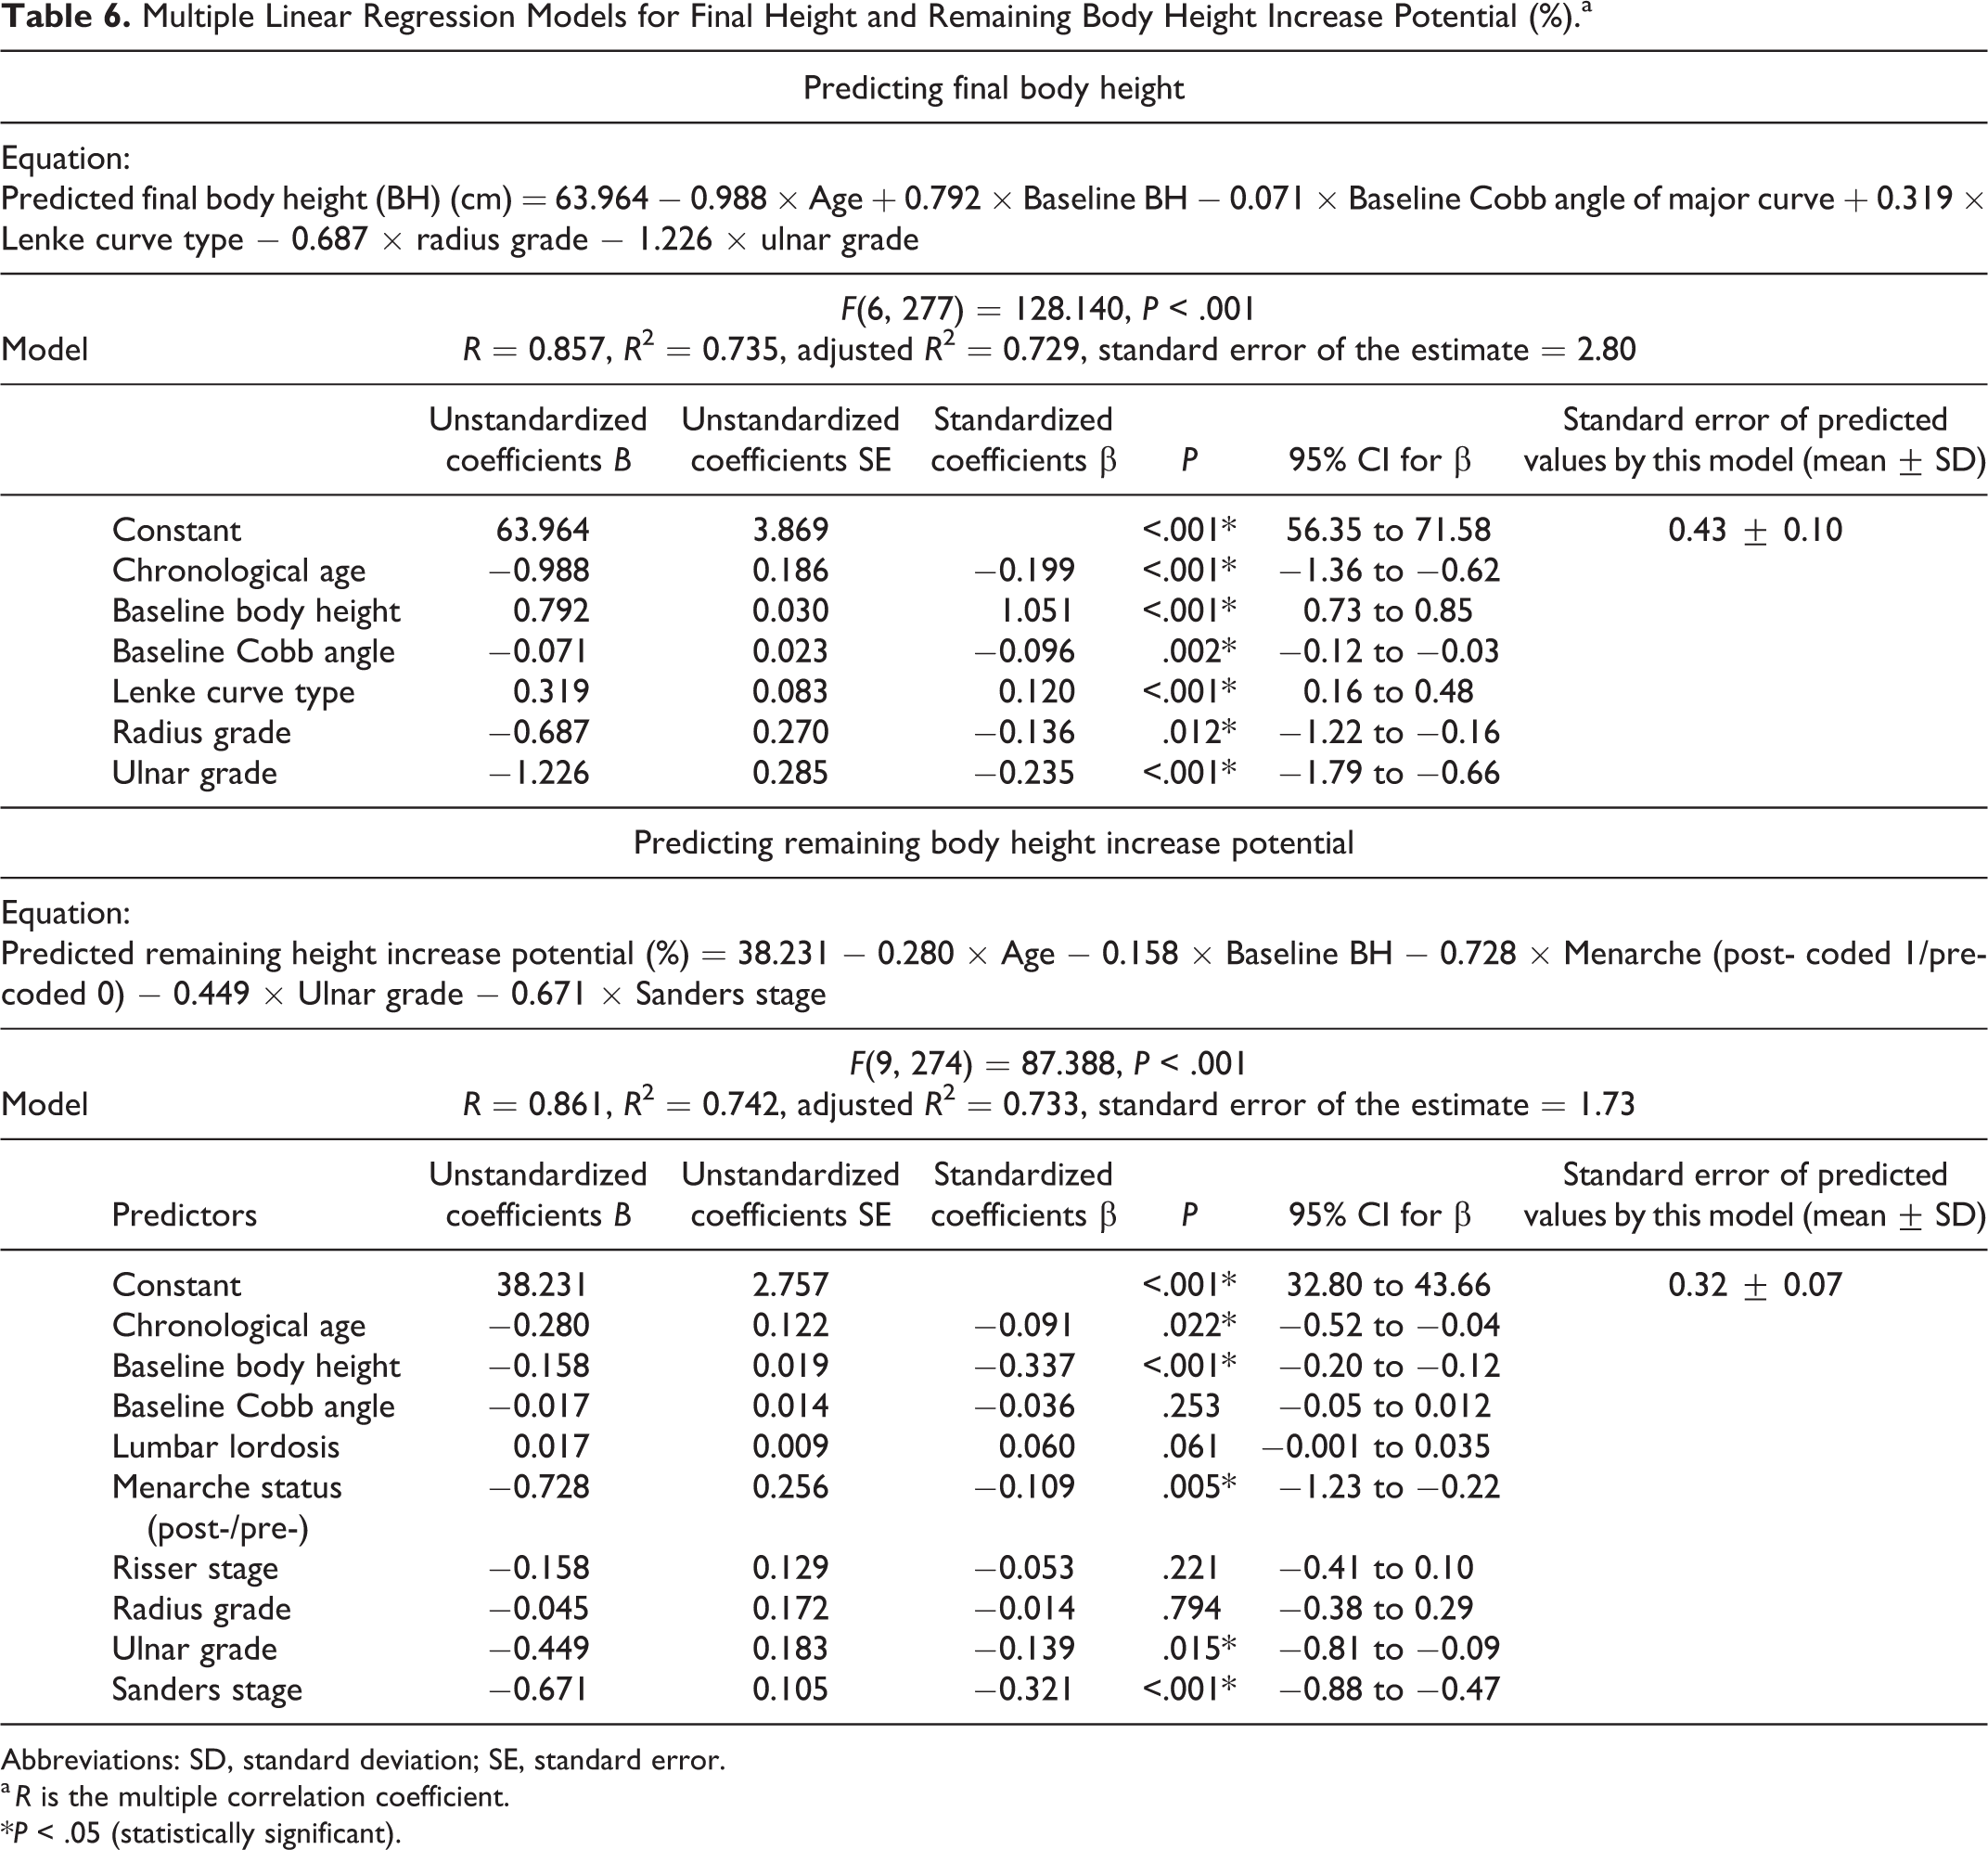
In Table 6, multiple linear regression models were significant (Figure 3a and b) with the following regression equations derived:
Multiple Linear Regression Models for Final Height and Remaining Body Height Increase Potential (%).a
Abbreviations: SD, standard deviation; SE, standard error.
a R is the multiple correlation coefficient.
*P < .05 (statistically significant).
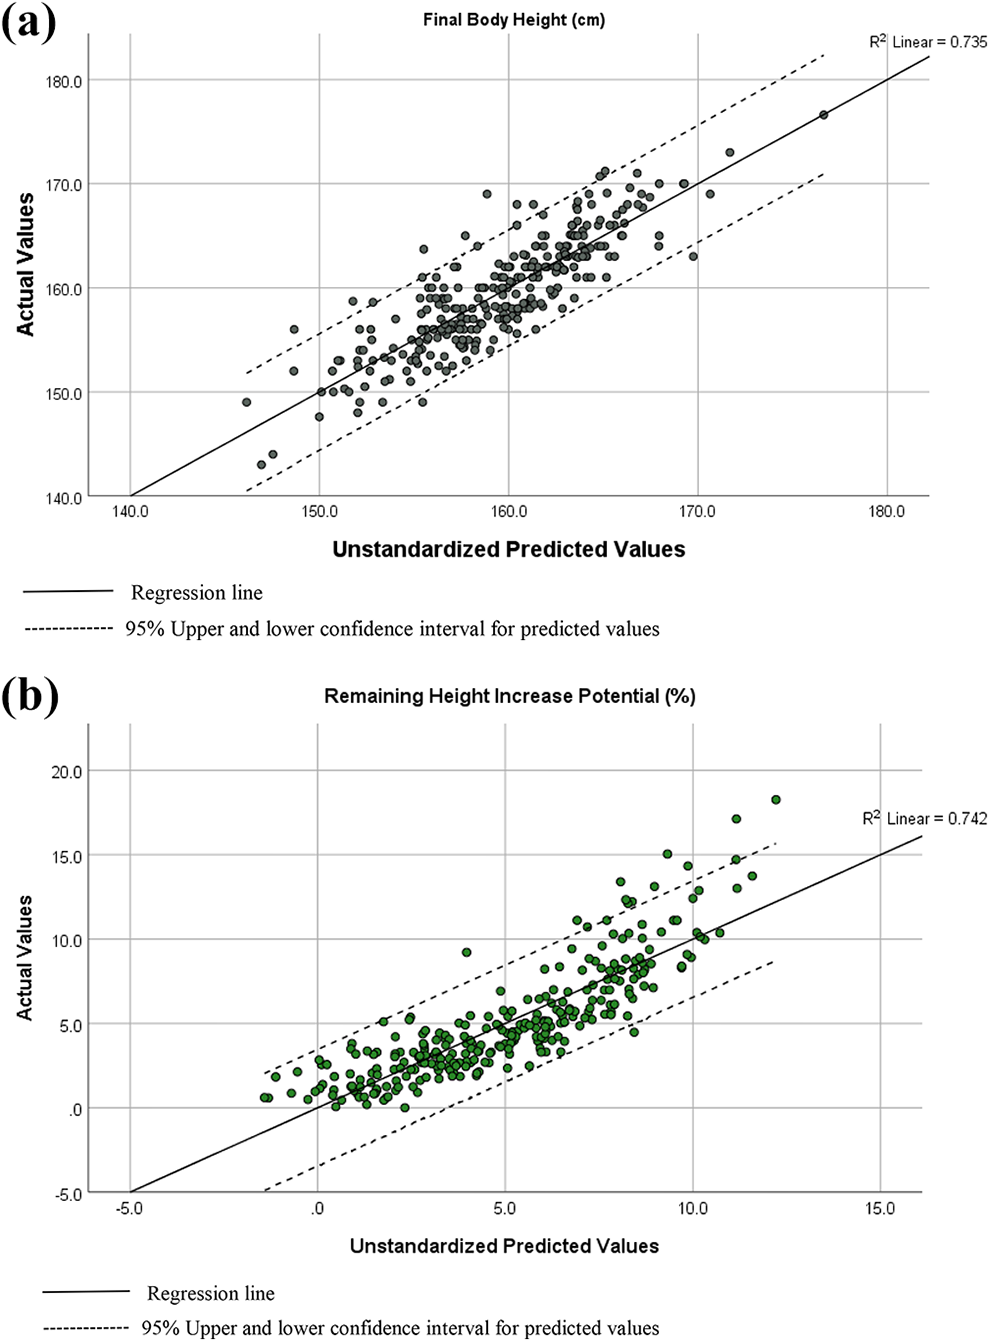
Scatter plots of (a) final body height (cm) and (b) remaining height increase potential (percentage) with actual versus predicted values from regression models.
Predicted final body height (BH) (cm) = 63.964 − 0.988 × Age + 0.792 × Baseline BH − 0.071 × Baseline Cobb angle of major curve + 0.319 × Lenke curve type − 0.687 × radius grade − 1.226 × ulnar grade, with F(6, 277) = 128.140, P < .001, percentage of explained variability (R 2) of predicted final height = 73.5%.
Predicted remaining height increase potential (%) = 38.231 − 0.280 × Age − 0.158 × Baseline BH − 0.728 × Menarche (post- coded 1/pre- coded 0) − 0.449 × Ulnar grade − 0.671 × Sanders stage, with F(9, 274) = 87.388, P < .001, R 2 = 74.2%.
Bootstrapping validation revealed the mean bias of the predicted values for the final height model was −0.011 ± 0.004 and root mean square error (standard error) of the estimate was 0.32 cm. For the remaining height increase potential model, its predicted values had a mean bias of 0.001 ± 0.013 and standard error of 0.20%. Table 7 reveals very little bias for all predictors’ bootstrap coefficients for both models (bias β ≤ |0.005|). Largest root mean square error for the final height and remaining height increase potential prediction models were 0.297 for the ulnar grade factor and 0.258 for the menarchal status. Bootstrapping reestimated the standard error of each predictor and improved the standard error of radius grade in the final height model (from 0.270 in Table 6 to 0.254 in Table 7). Standard errors of factors like chronological age and Sanders stages were also reduced in the remaining height increase potential model.
Bootstrapping Validation of Prediction Models Via Resampling.
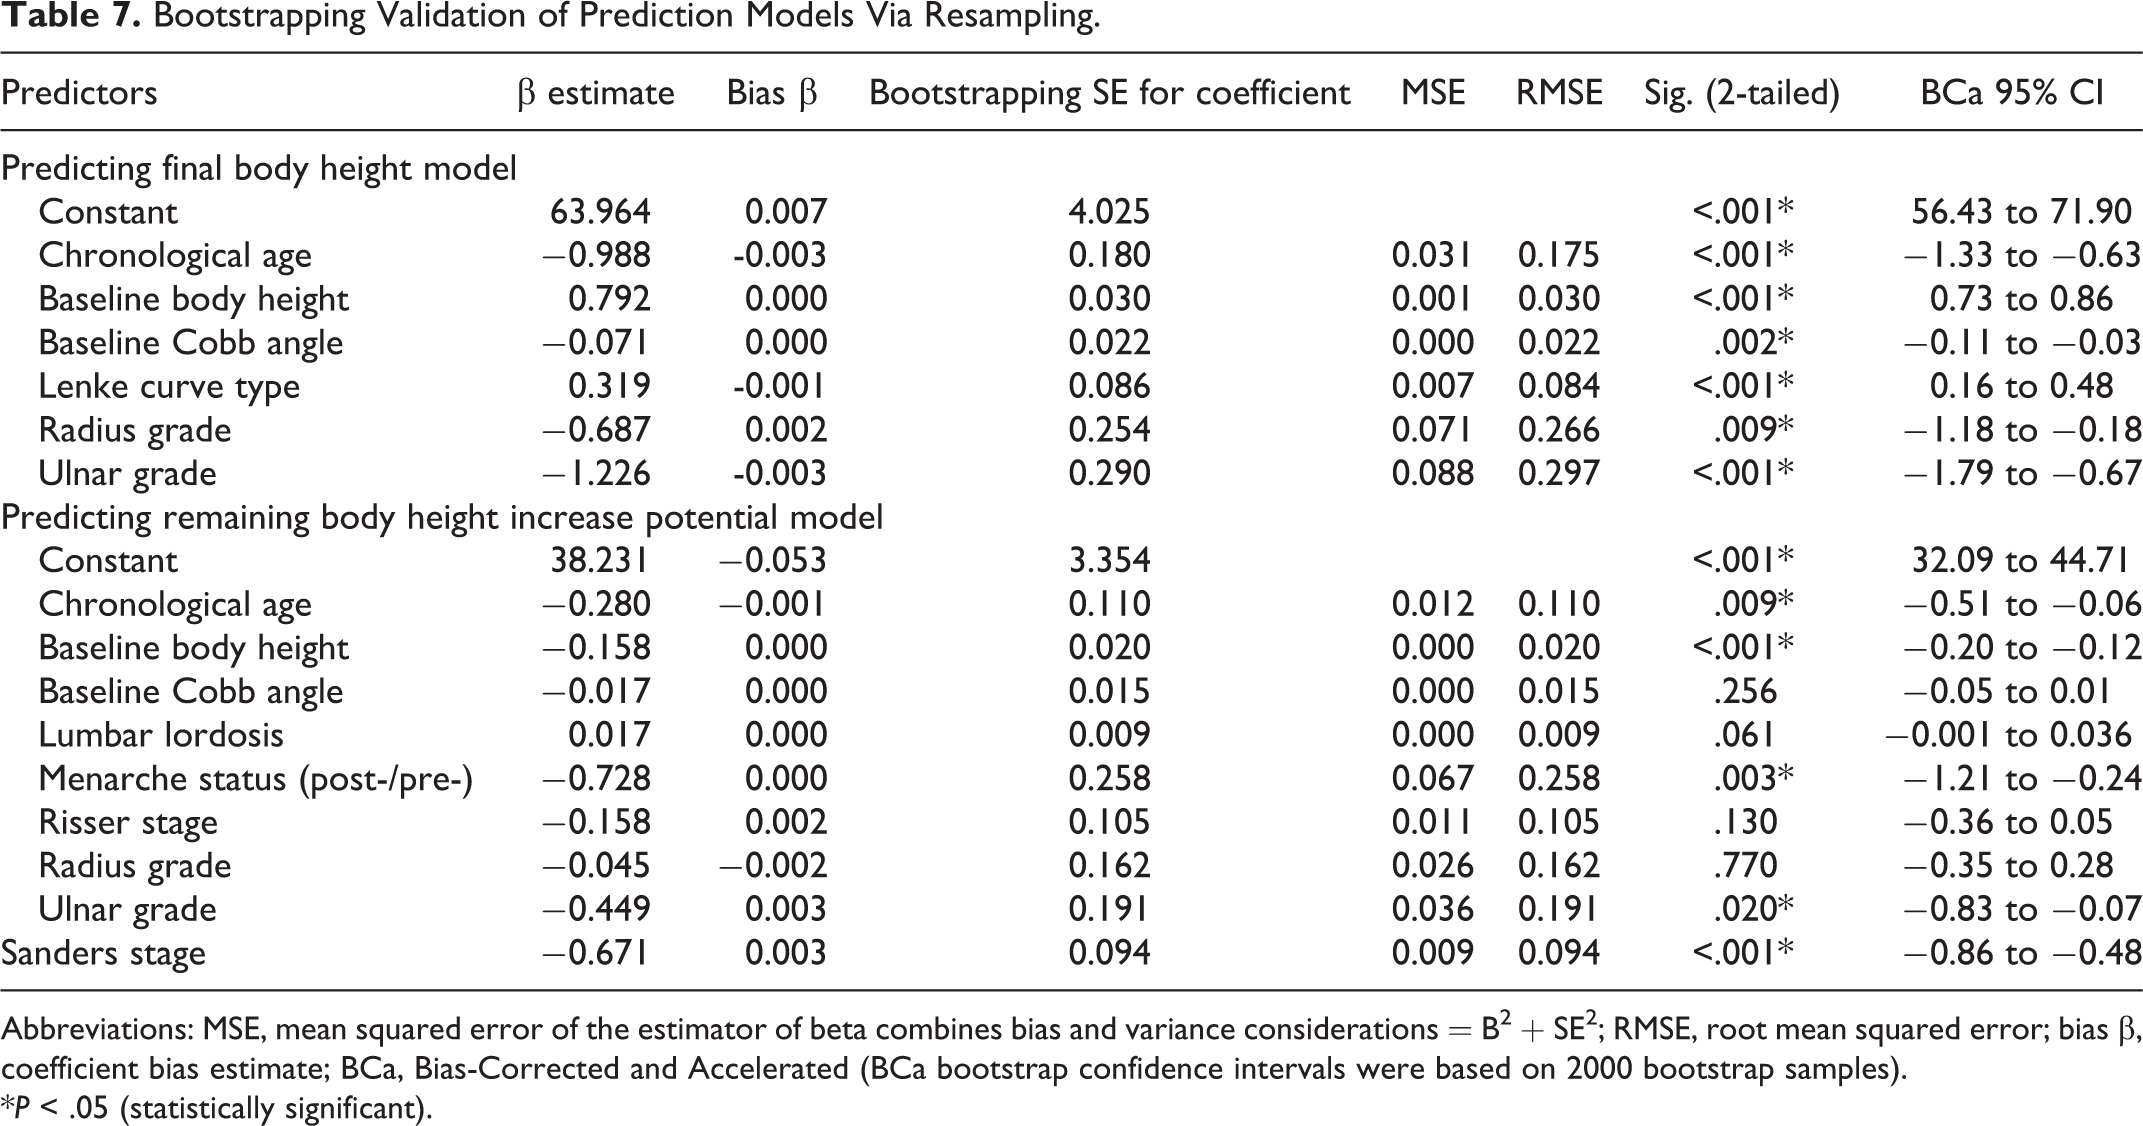
Abbreviations: MSE, mean squared error of the estimator of beta combines bias and variance considerations = B 2 + SE 2 ; RMSE, root mean squared error; bias β, coefficient bias estimate; BCa, Bias-Corrected and Accelerated (BCa bootstrap confidence intervals were based on 2000 bootstrap samples).
*P < .05 (statistically significant).
Discussion
Previous studies provide some knowledge about correction of height loss from truncal or spinal height loss due to scoliosis, but not for the prediction of absolute body height at maturity when these patients are first presented. Since the 1960s, several methods have been derived for calculating height correction of idiopathic scoliosis patients. These include Bjure et al whose height loss calculation was from the reduced trunk height relating to the Cobb angle of primary curves. 28,29 Another correction formulae was developed from a mixed group of patients with idiopathic scoliosis and scoliosis with associated syndromes, and was recommended for patients with larger Cobb angles. 30 Stokes 31 and Ylikoski 13 also based their prediction of body height loss on Cobb angles only. Recent studies have also focused on calculating height loss for the purpose of estimating postoperative height regain for surgical patients with AIS. 32,33 None of these equations included multiple factors at the time of initial presentation, that is when patients and parents are most concerned as scoliosis is just being diagnosed. In this study, we have made a novel approach to determine the relationships between baseline parameters with final body height measurement at skeletal maturity, to explore any predictive effect of these parameters. This aids in developing a more relevant, clinical user-friendly and accurate equation for predicting final body height, based on non-surgical patients (Figure 4). The effect of curve magnitude at initial consultation and the role of curve progression on body height and remaining height gain were investigated.
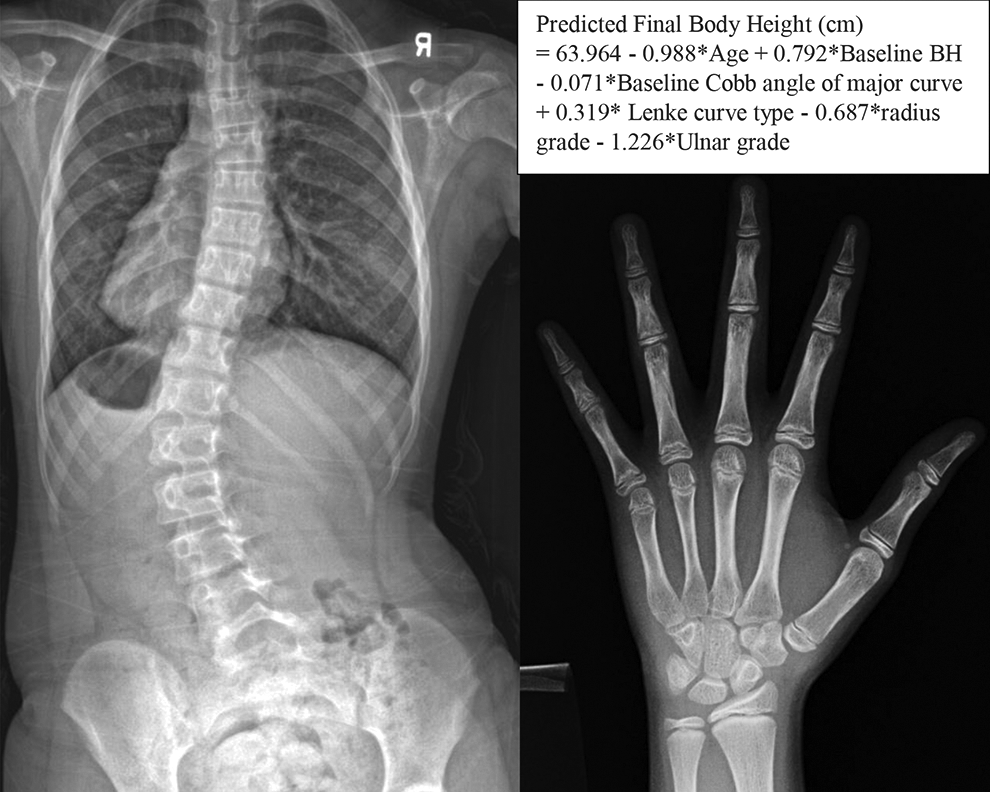
Clinical case. At initial consultation, a female of 10.6 years of age, presented with Risser 0, radius grade 6, ulnar grade 4, Sanders stage 3, premenarche, coronal Cobb angle: T10-L4: 39.3°, T5-T10: 24°, T1-T5: 19.2° with Lenke curve type 5. Baseline body height was 138.0 cm. At baseline, final body height predicted using model was 152.6 cm. At maturity, final body height observed was 152.0 cm.
Chronological age at initial presentation, baseline body height, baseline Cobb angle of major curve, Lenke curve type and skeletal maturity status using radius and ulna grades are significant predictors for final body height. These factors remain significant for the prediction of remaining height increase potential except for radius grades and baseline Cobb angle and curve type, while menarchal status and Sanders stages become significant instead. Based on the regression analyses, the final height prediction model requires lesser number of predictors yet providing comparable accuracy of prediction as the remaining height increase the potential model. Therefore, the final height prediction model is recommended.
In order to enhance our understanding of which factor plays an important role in final height prediction, it is of particular interest to assess the extent of each predictor’s effect on the predicted values when all other parameters are held constant. For both prediction models, baseline body height has the largest effects (standardized β = 1.051 for final height prediction, standardized β = −0.337 for remaining height increase potential model), with ulnar grading (standardized β = −0.235) and Sanders staging (standardized β = −0.321) at initial presentation having the second largest effects for each respective model. Apart from the obviously relevant baseline body height, the baseline ulna grade and Sanders stage hold relatively larger impact on our ability to predict than other baseline parameters. This relative strength on prediction can be accounted by the ulnar grading having strong correlation with remaining growth potential (τb = −0.575, P < .001) and so does the Sanders staging (τb = −0.661, P < .001). Moreover, the distal radius and ulna epiphysis, which both the DRU and Sanders staging assess, are the last to fuse in the hand and wrist, 34 hence it has the widest and comprehensive range and utility to capture growth potential.
In comparison, Cobb angle at initial presentation has the least effect in the final height prediction (standardized β = −0.096). We can comprehend this more accurately by understanding the study population. The mean baseline Cobb angle of major curve was 27.1° ± 7.4° (95% CI: 26.2°-28.0°), ranging from 10.0° to 50.9°. Further examination reveals the largest mean value of baseline curve magnitude per skeletal maturity index were: 29.4° ± 8.0° (95% CI: 26.9°-32.0°) at Risser 3, 28.6° ± 7.7° (95% CI: 27.0° to 30.2°) at R8, 29.3° ± 6.6° (95% CI: 25.1° to 33.5°) at U8, and 31.0° ± 7.3° (95% CI: 28.1° to 34.0°) at SS7. These indicate that our prediction models are based on a study population with moderate curve magnitude at initial presentation. Therefore, if skeletally immature patients are first presented with relatively larger major curve Cobb angles, the predictive effect of baseline Cobb angle may not be the weakest and should not be underestimated. Despite the prediction models are based on parameters at initial presentation prior to any prescription of intervention, it is crucial to consider whether conservative therapy, like bracing, of these moderate curves can have an impact on the expected growth. The effect of bracing, be it successfully preventing curve progression or resulting in curve regression or deterioration, 35 can lead to potential changes of growth during the bracing period.
In addition, our finding reveals that patients with curve deterioration at maturity, in fact, have significantly greater remaining height increase potential during initial presentation at Risser stage 0 or 1, R6, U5 and SS3. The difference in potential body height increase between curve deterioration and non-deterioration groups becomes less than 1% and insignificant for patients presented at Risser 2, R7, U6 and SS4 or after. Interestingly, final body height and arm span are found to be comparable between those with/without curve deterioration at skeletal maturity. These indicate that remaining growth potential can be different when patients are first presented at immature status, even though they are of the same maturity grade. Despite the same skeletal maturity status, patients who will experience curve deterioration at maturity tend to have greater amount of body height still yet to grow before achieving a comparable final body height. This suggests a possible lagging of growth at initial presentation for those with curve progression. These are observations only as we cannot foresee whether the curve will deteriorate at maturity when patients are first presented. But they are novel findings which prompt further investigation of whether the lag in bodily growth in immature patients (Risser 0 or 1, R6, U5, SS3) can be used as a precursor for future Cobb angle deterioration, and also for ascertaining curve deterioration at maturity with the exact cut-off value that does not affect final body height.
The main limitation of this study is the number of cases excluded for the specific inclusion and exclusion criteria. However, our strict inclusions increase the homogeneity of the study population and ensure a reliable clinical application with the regression equations. It needs to be emphasized, however, that this final height prediction is based on a Chinese cohort, and its application is subjected to racial differences and possible geographic characteristics. 36 In addition, this study uses the standing body height and arm span as measures of growth. Therefore, an in-depth investigation of body height in the sitting position is required, with the aim of investigating the role of spine height increases in relation to growth as expressed with sitting height gain, and how that may impact the final sitting height at skeletal maturity. At the same time, factors such as body mass index and competitive sports which can possibly be altering growth should be considered in addition to the range of factors we have analyzed. Among the various factors studied, there may be mismatch between menarchal status with bodily growth and skeletal maturity. Tanner stages could have been assessed in conjunction but is not possible due to the retrospective data. Also, this study only examines non-surgical patients, thus those patients whose Cobb angle eventually progresses to the surgical threshold may not follow the predicted values of our regression equations. Postoperative spinal height gain requires investigation specifically on the effect of surgical intervention on spinal and body height, and any possible characteristics inherited in the natural history of height increase for large curves. 37,38 Moreover, future external validation is required, plus examining the prediction of final height with stratification based on various baseline curve magnitude.
In conclusion, valid regression models for final body height and remaining body height increase potential are established with regression equations for clinical use, aiming at addressing concerns from patients with moderate curve magnitude. Close examination of curve deterioration provides understanding of the effect of curve deterioration on remaining height increase potential. The contribution of each predictor for the regression model is considered, specifically the chronological age, baseline body height, curve magnitude, curve type, and skeletal maturity parameters.
Footnotes
Author Contributions
Prudence Wing Hang Cheung: Study design, data collection, statistical analysis, writing and final editing the manuscript. Abhishek Mannem: data collection, critical review of the manuscript. Jason Pui Yin Cheung: Study design and conception, supervision, critical review and editing of manuscript.
Declaration of Conflicting Interests
The author(s) declared no potential conflicts of interest with respect to the research, authorship, and/or publication of this article.
Funding
The author(s) disclosed receipt of the following financial support for the research, authorship, and/or publication of this article: the Health and Medical Research Fund (ref# 05161356) and the General Research Fund of the Research Grants Council (ref# 17156416).