
Abstract
Study Design
Retrospective observational study.
Objectives
The prediction of curve progression in patients with adolescent idiopathic scoliosis (AIS) remains an unresolved area in orthopedic surgery. To make a rapid meaningful prediction, easily accessible multi-dimensional data at the patient’s first consultation should be used. Current studies use clinical growth parameters and numerical values extracted from radiographs to compile a predictive model, leaving out the radiographs themselves. Such practice inevitably wastes a lot of information. Thus, this study aims to create a neural network that can predict AIS progression among patients with curves indicated for bracing by integrating both one-dimensional (1D) clinical and two-dimensional (2D) radiological data collected at the patient’s first visit in a fully automated manner.
Methods
513 idiopathic scoliosis patients indicated for and managed with bracing orthosis were recruited. After exclusion, 463 patients were included in deep learning analysis. Processed first-visit growth parameters and posteroanterior radiographs are used as training inputs and the curve progression outcomes obtained in follow ups are used as binary training outputs. The CapsuleNet architecture was modified and trained accordingly to make a prediction.
Results
The final model achieved 90% sensitivity with an overall accuracy of 73.9% in the prediction of AIS in-brace curve progression by using first-visit multi-dimensional data, outperforming conventional convolutional neural networks.
Conclusions
This first-ever multidimensional-input model shows promise in serving as a screening tool for AIS in-brace curve progression. The incorporation of such a model into routine AIS diagnostic pipeline can assist orthopedics clinicians in personalizing the most appropriate management for each patient.
Introduction
Scoliosis is a three-dimensional spinal deformity and AIS is the most common form, attributing to about 70% of all cases, and is usually diagnosed during puberty.1-4 Throughout puberty, the rapid increase in linear growth may exacerbate the structural deformity, contributing to the progressive nature of AIS. A curved spine can detrimentally affect the patient’s daily activities, quality of life and even cardiopulmonary function.
5
Treatment options depend on the severity of disease ranging from observation alone, to bracing and surgery. It is also highly influenced by the patient’s remaining growth potential and therefore, AIS warrants an early diagnosis and an appropriate and timely treatment to prevent progression. However, the etiology of AIS progression still remains unclear up to this date due to the lack of consistency between studies
6
; this is especially the case among the patients indicated for and managed by bracing orthosis where individuals already share certain characteristics like large curves and skeletal immaturity at presentation
Determining the risk of AIS progression is a complex task that should integrate both clinical and radiological components; however, most of the current curve progression prediction tools still rely on 1D numerical data alone and fail to make use of 2D radiographs which contain spatial information valuable to prediction accuracy. In addition to the relevant clinical parameters, such as sex, chronological age, date of menarche and height,7-11 current AIS progression estimation focuses on various numerical or categorical parameters extracted from radiographs, including the Cobb angle for measuring the angle of spinal curvature,12,13 skeletal maturity approximated particularly by the distal ulna and radius classification,10,11,14 curve pattern7,15 and supine flexibility.15-18 Researchers in the field have created various composite predictive models using these 1D clinical data and extracted radiological parameters,19-21 and one model even used circulating markers of AIS, such as microRNA-145-5p, achieving a sensitivity of 91.7% and specificity of 79.8%. 20 However, current prediction tools have a significant limitation in that they exclude radiographs from the prediction algorithms, sacrificing a large amount of subtle spatial information within the spine that could be invaluable to AIS progression prediction.
Recent advancements in computer vision and deep learning artificial intelligence (AI) algorithms have been employed for medical research in various specialties. 22 For deep learning applied specifically in AIS progression prediction, there is one study that employed state-of-the-art deep learning techniques to predict curve progression using radiographs alone and showed comparable results to other composite models that use clinical parameters. 23 Another team performed three-dimensional (3D) reconstruction of the spine from bi-planar radiographs and used physics equations to create an impressive mechanistic neural network to characterize stress components along the 3D spine and added it to a bone growth model to predict the curve status of AIS patients at any given time-point. 24 These exciting recent studies show that current machine learning technology enables the utilization of raw radiographs and even their reconstructions to predict AIS curve progression.
Therefore, both 1D clinical parameters and 2D whole-spine radiographs should be used simultaneously in order to optimally utilize routinely collected data to make a better-informed prediction of AIS curve progression while minimizing costs. The objective of this study is to develop an AI neural network that can predict the probability of in-brace curve progression of AIS patients at their first visit to the orthopedic clinic by utilizing both routinely collected 2D radiological images and 1D clinical data. To the best of our knowledge, this is the first ever attempt in literature to directly utilize whole-spine radiographs, instead of using extracted parameters, combined with growth parameters to make a prediction for AIS progression. The results of this study should provide new insights into predicting in-brace curve progression risk within the bracing population, where progression prediction is more challenging. This paper is composed of several sections including the recruitment and inclusion of patients, the X-ray and bracing protocol and the processing of radiographs and clinical parameters for training, the neural network design, performance of the generated models, discussion of results, model design, limitations, and future directions.
Materials and Methods
Patient Recruitment and Demographics of the Study Population
We recruited a total of 513 patients from two tertiary scoliosis referral centers between December 2016 to November 2019. Written informed consent was obtained from all participants and their parents or legal guardians before examinations and measurements were performed. This study was approved by the Institutional Review Board of the University of Hong Kong/Hospital Authority Hong Kong West Cluster (IRB Reference Number: UW 15-596, 7 December 2016). Study inclusion criteria were (i) clinical diagnosis of AIS within the recruitment period, (ii) indicated and managed by bracing orthosis upon diagnosis, (iii) Cobb angle ≥ 20°, (iv) a minimum of one follow-up at least three months after the first visit. 43 patients were consequently excluded due to lack of follow-up and 7 patients were diagnosed with juvenile idiopathic scoliosis instead as they were younger than ten years old, leaving 463 patients for neural network training and analysis (Figure 1). Patients were recruited for this study based on their diagnosis of idiopathic scoliosis, measured Cobb angle ≥ 20°, bracing orthosis management regime and one or more follow-ups at least three months after the patient’s first diagnosis. Most patients fulfilled these inclusion criteria; however, 7 patients were younger than 10 years old and 43 patients defaulted follow up earlier than the three-month time-point. A total of 50 patients were hence excluded from this study.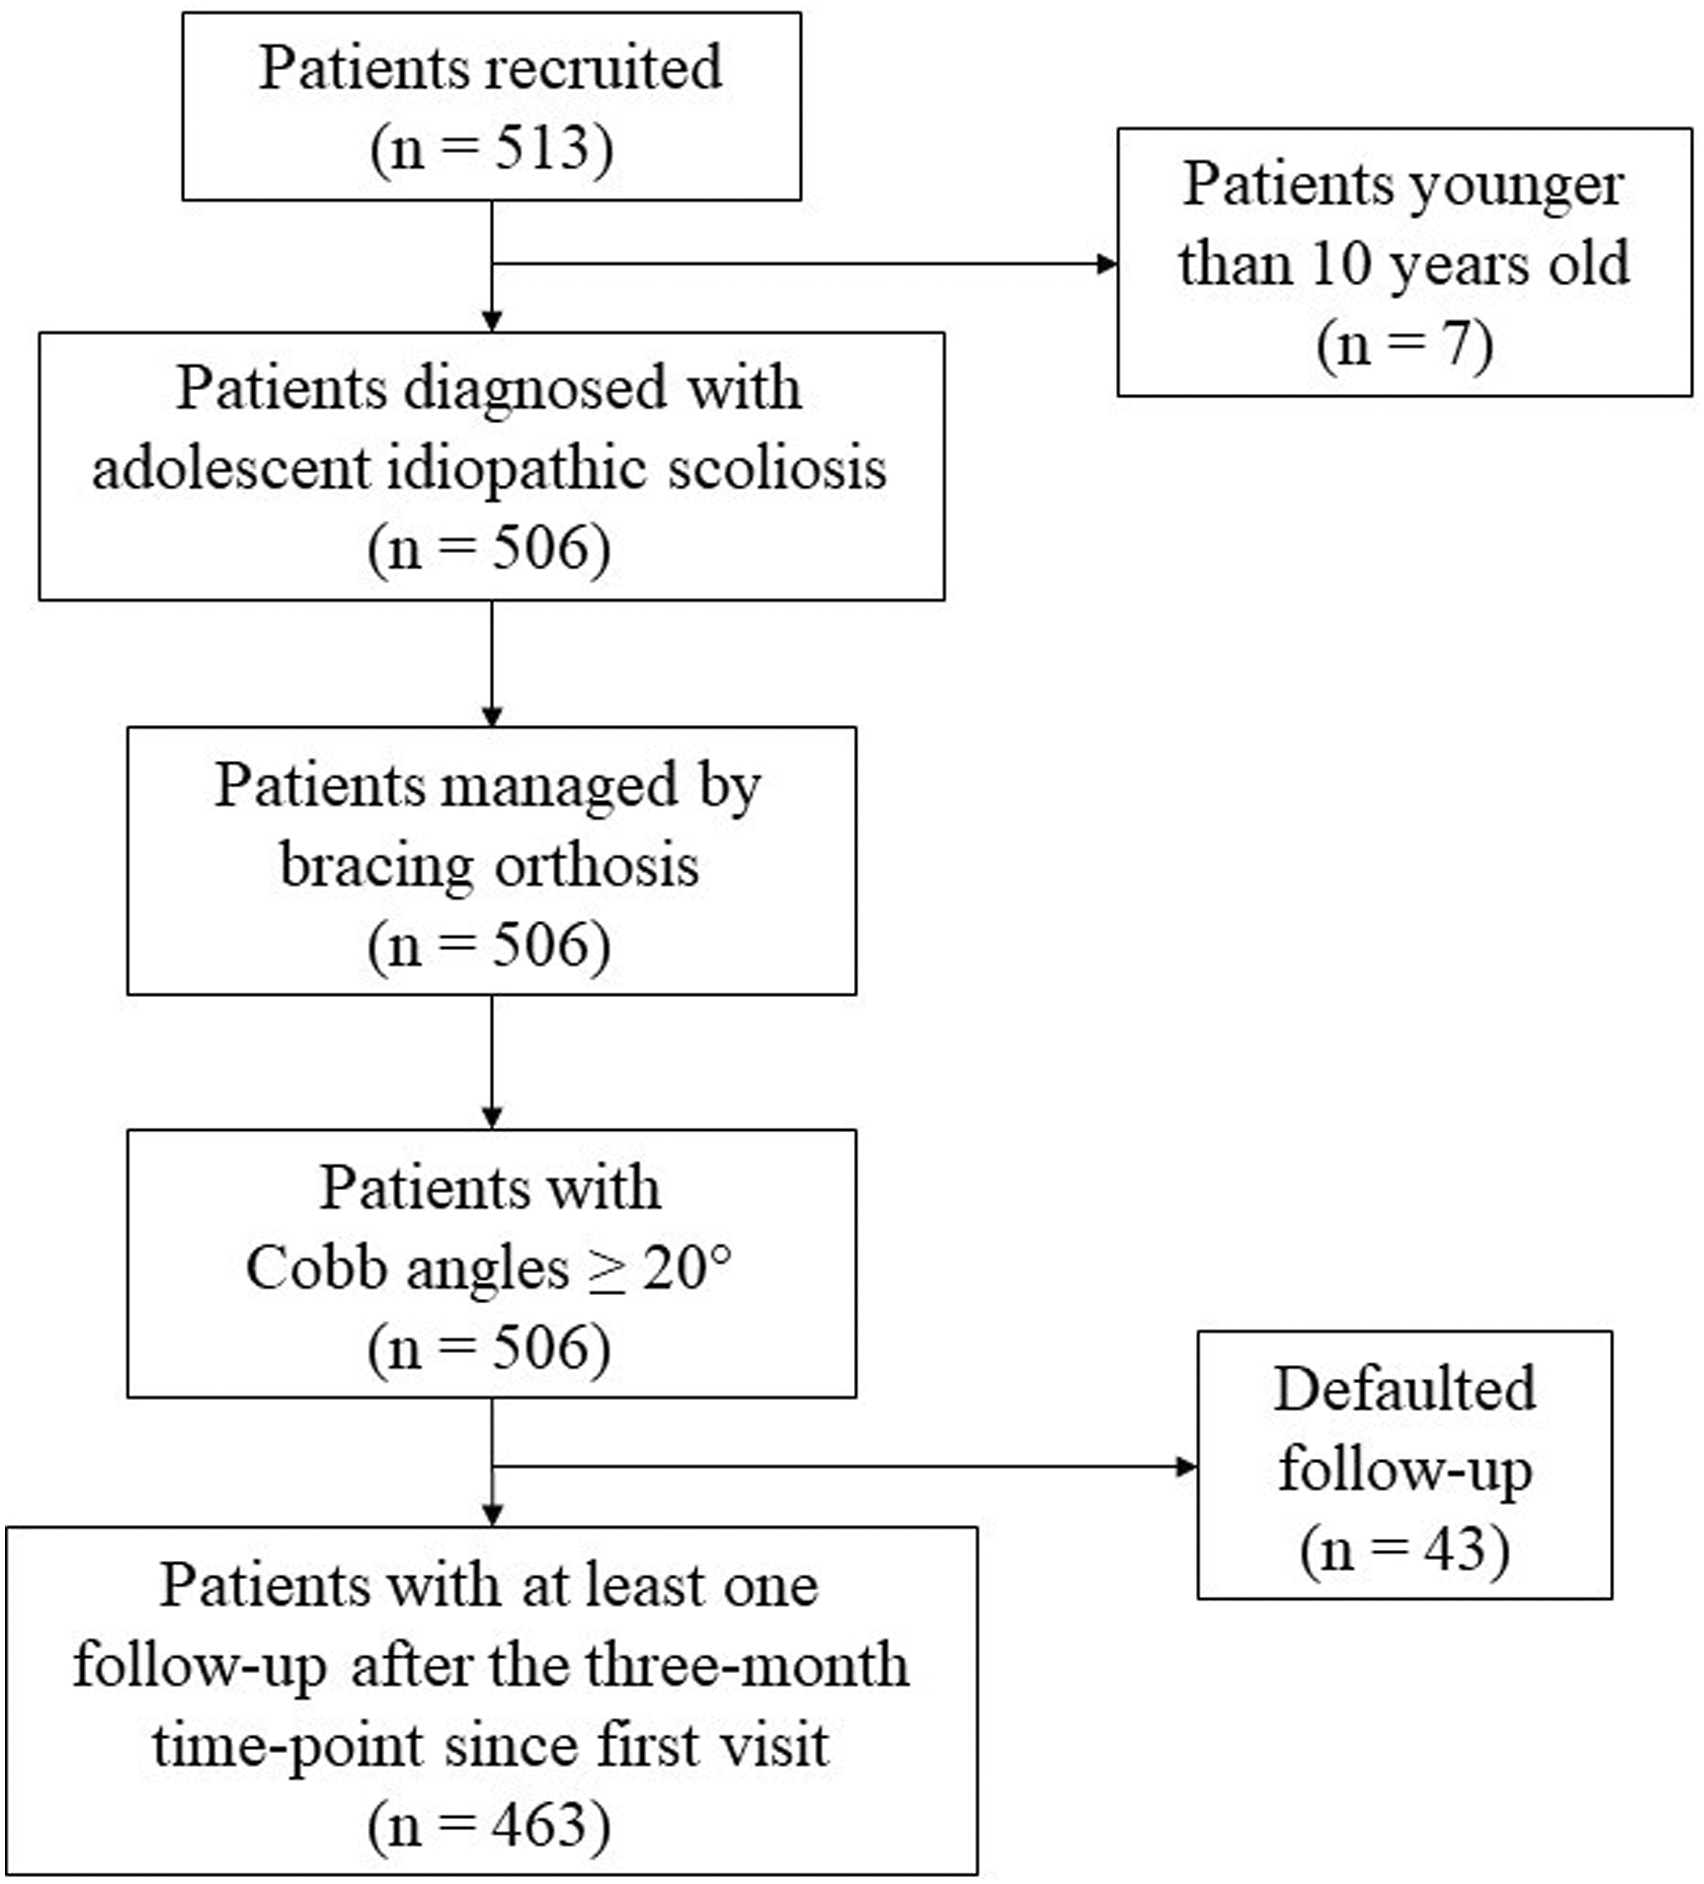
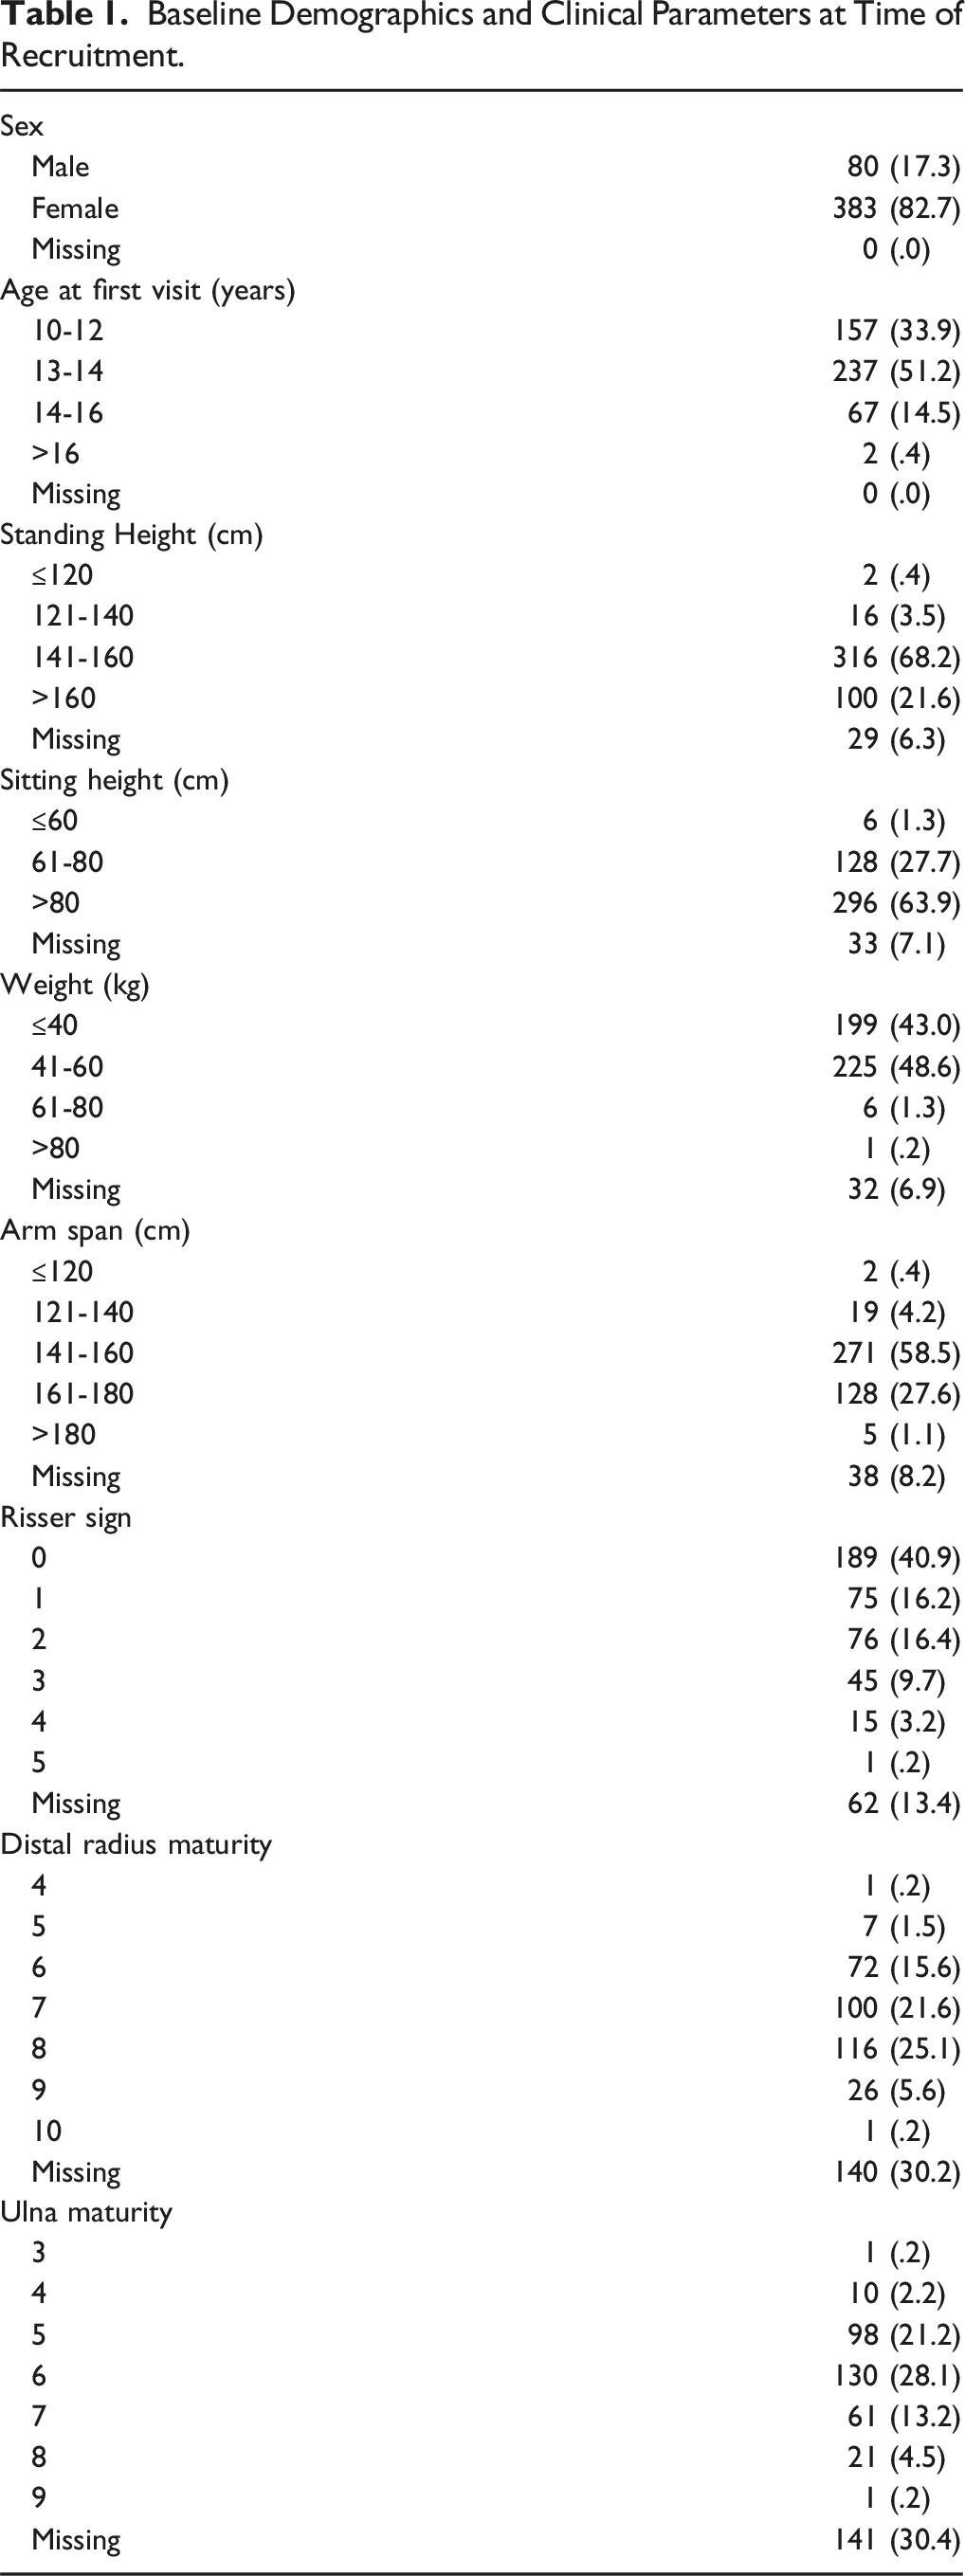
Baseline Demographics and Clinical Parameters at Time of Recruitment.
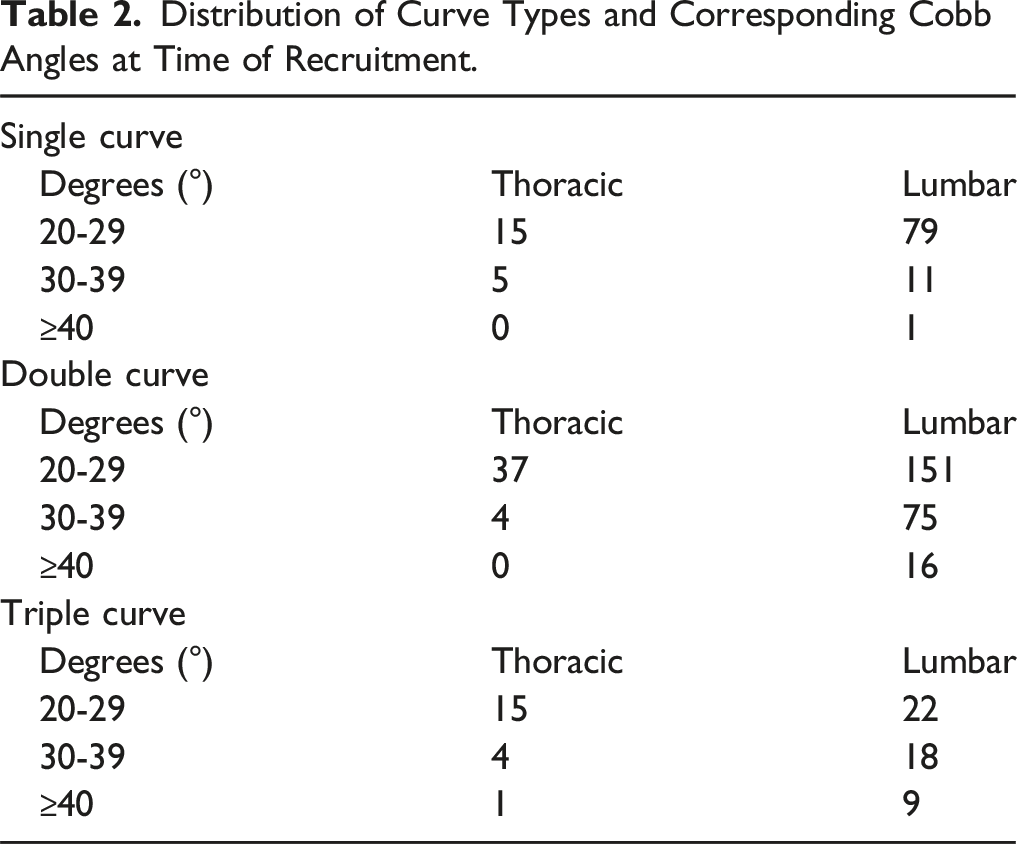
Distribution of Curve Types and Corresponding Cobb Angles at Time of Recruitment.
Bracing Protocol and Compliance
The two tertiary referral centers practice stringent measures to manage AIS and advocate bracing treatment. AIS patients are generally offered bracing for curves between 20° and 40°, less than 1 year post-menarche for girls, and Risser 0-2. However, some AIS patients with curves near to or over 40° and Risser >2 are offered bracing treatment to minimize the risk of any curve progression during growth.
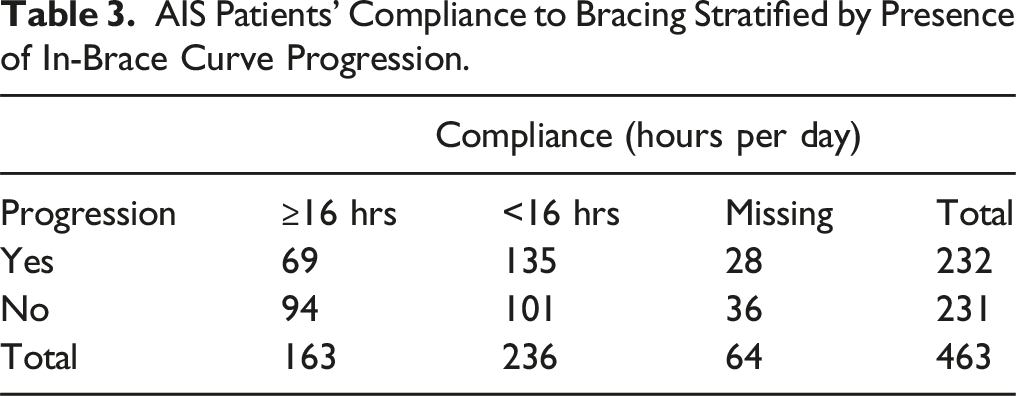
AIS Patients’ Compliance to Bracing Stratified by Presence of In-Brace Curve Progression.
X-ray Protocol
All radiographs used in this study were scanned by bi-planar stereoradiography (EOS® imaging system, Paris, France). This imaging system collects simultaneous full body or upper body whole-spine bi-planar radiographs of the participants. Baseline full body radiographs were taken at the first visit for every patient. For each follow-up visit, patients were required to take two sets of radiographs – one with bracing orthosis and one without bracing orthosis for treatment efficacy assessment purposes. But to achieve consistent comparison specifically for this study, only the follow-up radiographs without bracing orthosis were used for appropriate comparison to pre-brace first-visit radiographs. Only the posteroanterior X-ray images were used for training in this study.
X-ray Image Preprocessing for Model Training
Several steps were employed to prepare the radiographical images for neural network training.
First, the brightness and contrast of all X-ray images were normalized with the Contrast Limited Adaptive Histogram Equalization (CLAHE) image processing algorithm with OpenCV.
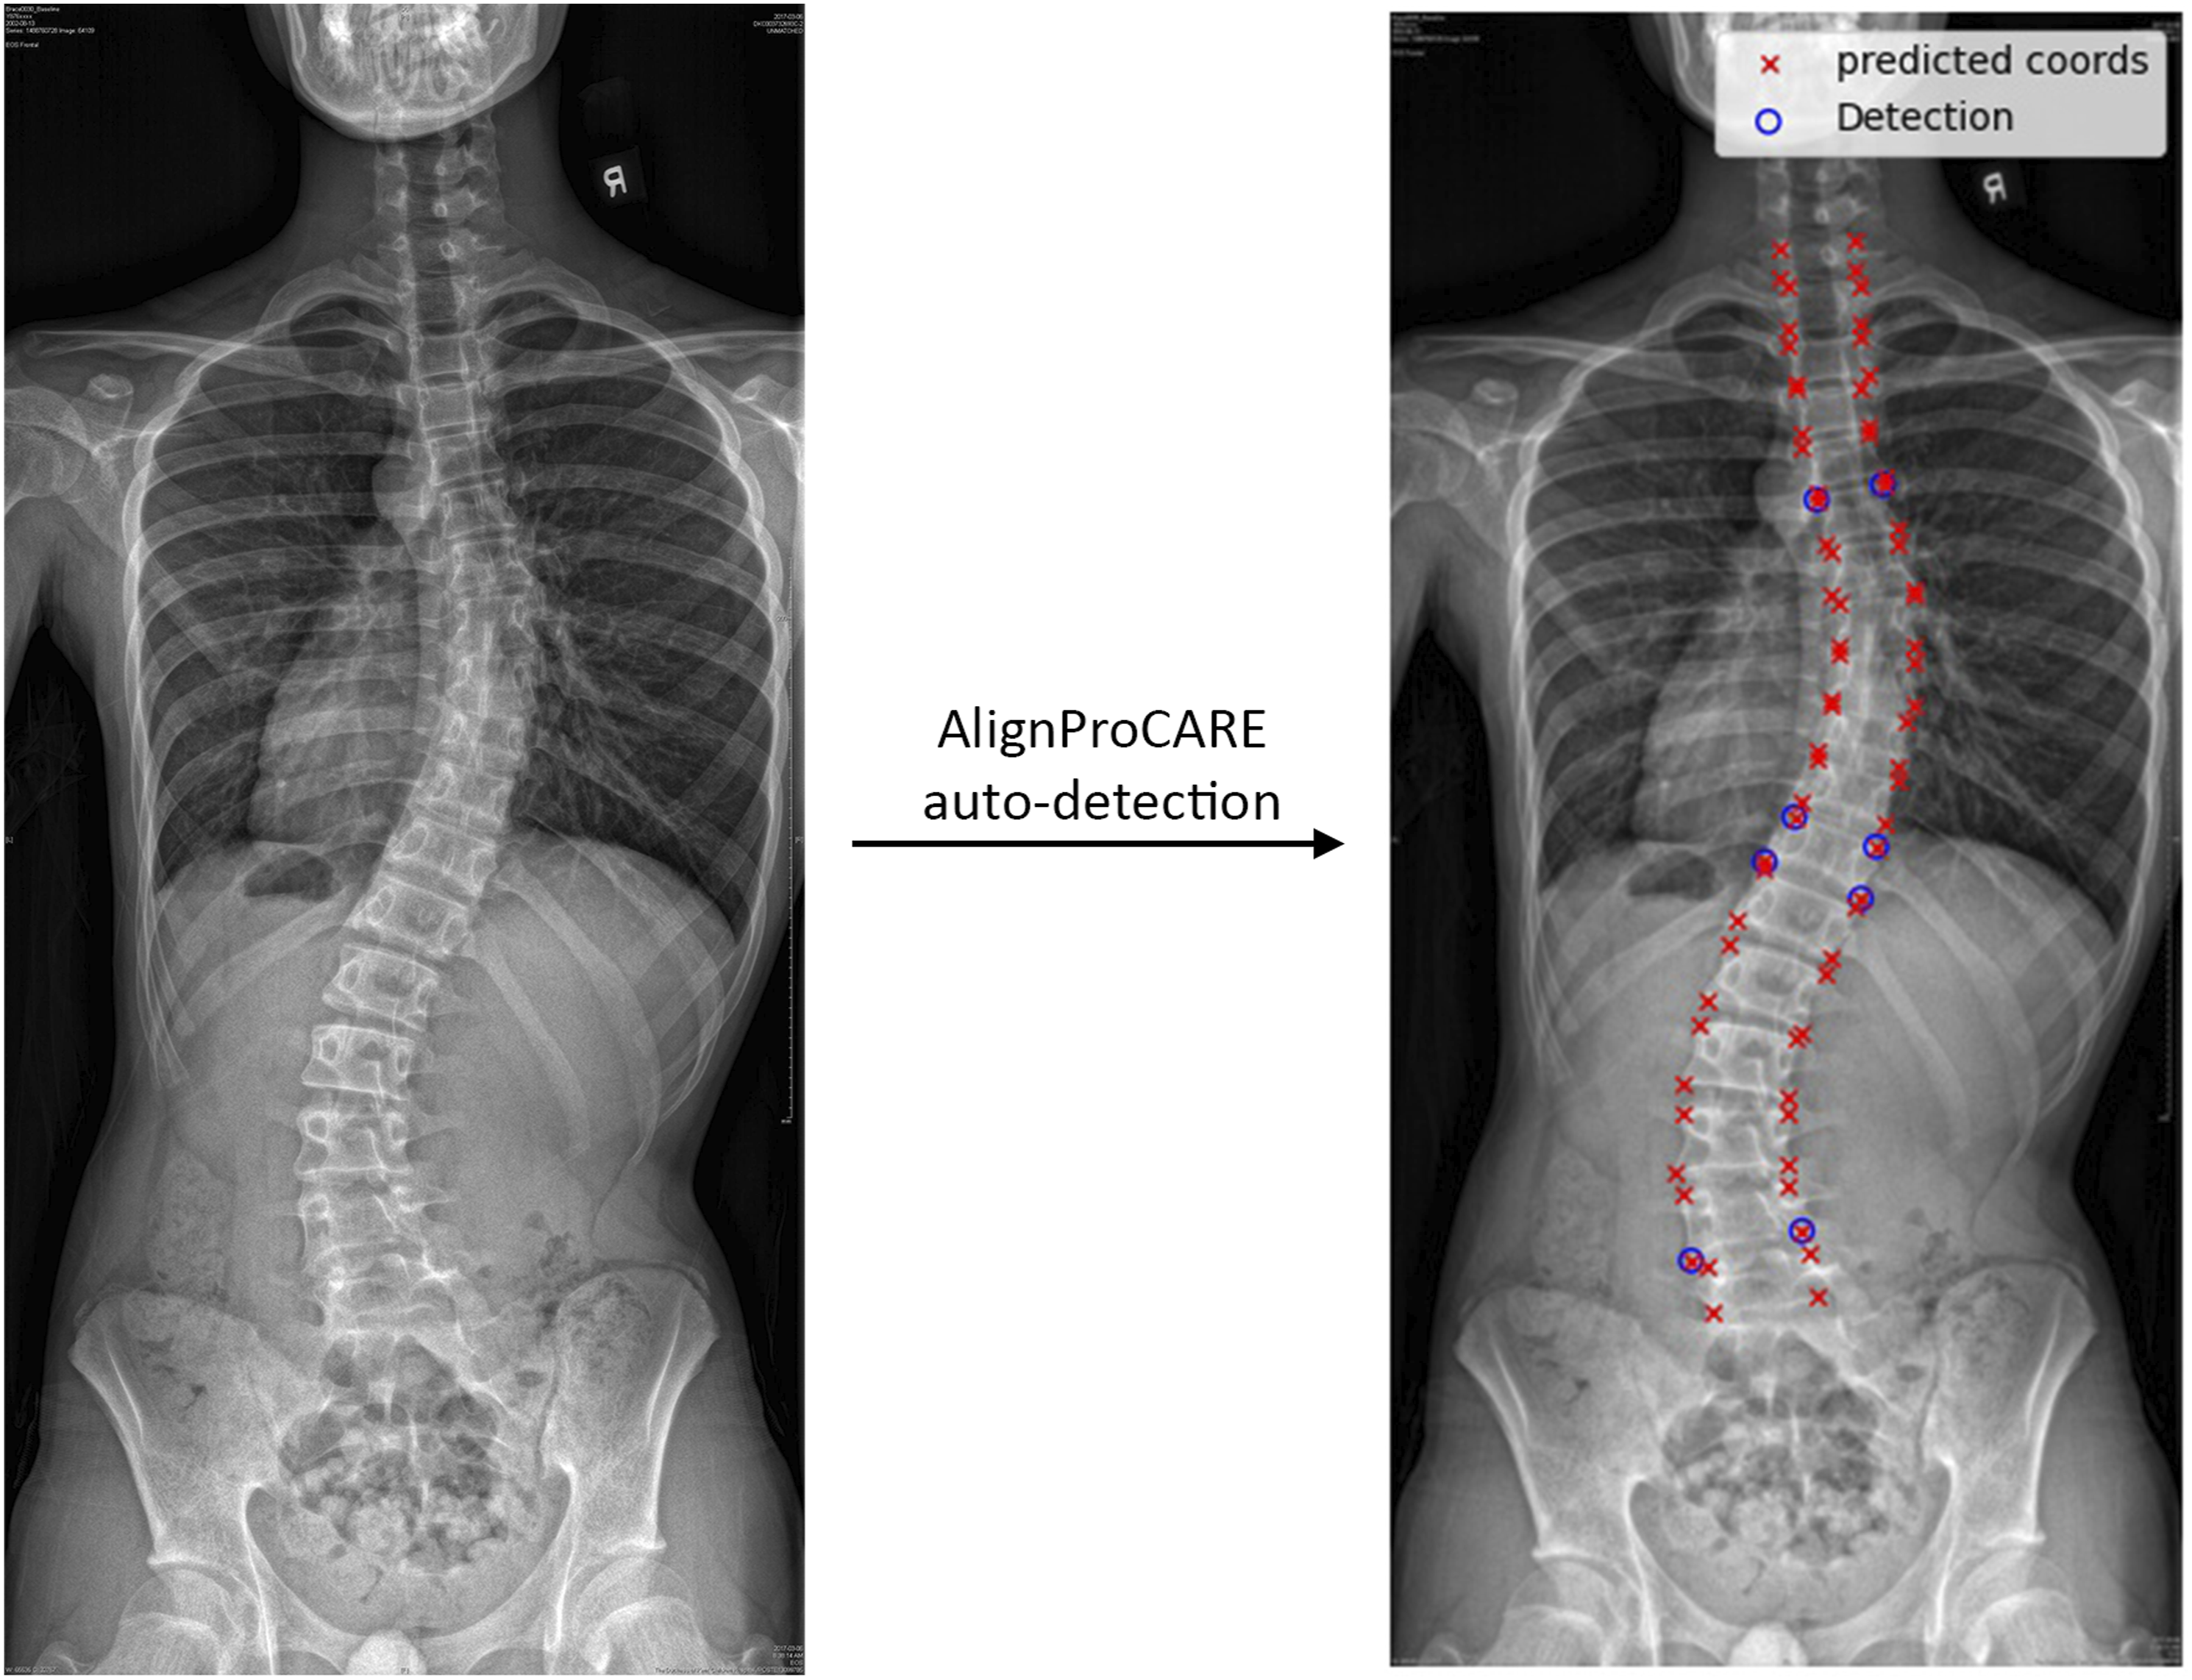
Second, three different regions of interest (ROI) of the original X-ray images were synthesized -- (i) whole-spine, (ii) upper end vertebra of the major curvature, and (iii) lower end vertebra of the major curvature, as demonstrated in Figure 2. To obtain the cropping borders for the ROIs, AlignProCARE
25
was employed to automatically generate two sets of coordinates (Figure 3). The first set consisted of 72 pairs of endplate coordinates from C7 to L5 level and the second set consisted of endplate coordinates that represent the first and last end vertebrae of all detected curvatures. These two sets of coordinates were labelled on top of the radiographs, as demonstrated in Figure 3, for all participants and verified manually. All coordinates generated were accurate, hence no manipulation was necessary. Subsequently, the very first and very last endplate coordinates were used to generate the whole-spine ROIs, spanning from C7 to the pelvic bone. For the upper and lower end vertebrae ROIs, endplate coordinates of the major curvature were used. Three regions of interest (ROI) were selected and processed for training from each original radiograph. The leftmost image is the original coronal view radiograph. The original radiograph was passed through the CLAHE algorithm to enhance image brightness and contrast. The three crop boxes outlined by red dotted lines illustrate the three crops generated for model training. Crop 1 selects the ROI for the whole-spine region according to coordinates exported by AlignProCARE. Crops 2 and 3 select the ROIs for the upper and lower end vertebra of the major curvature. All ROIs were subsequently resized into 256 × 256 for Crop 1 and 50 × 50 for Crop 2 and 3. Crop 1 ROI was additionally multiplied by a Gaussian mask to amplify the signal of the vertebrae. AlignProCARE automatically generates 36 pairs of vertebral end plate coordinates represented by the red crosses in this coronal view radiograph. The four pairs of blue hollow circles are the upper and lower vertebral end plates of the detected spinal curvature. In other words, there are two curvatures detected in this given patient.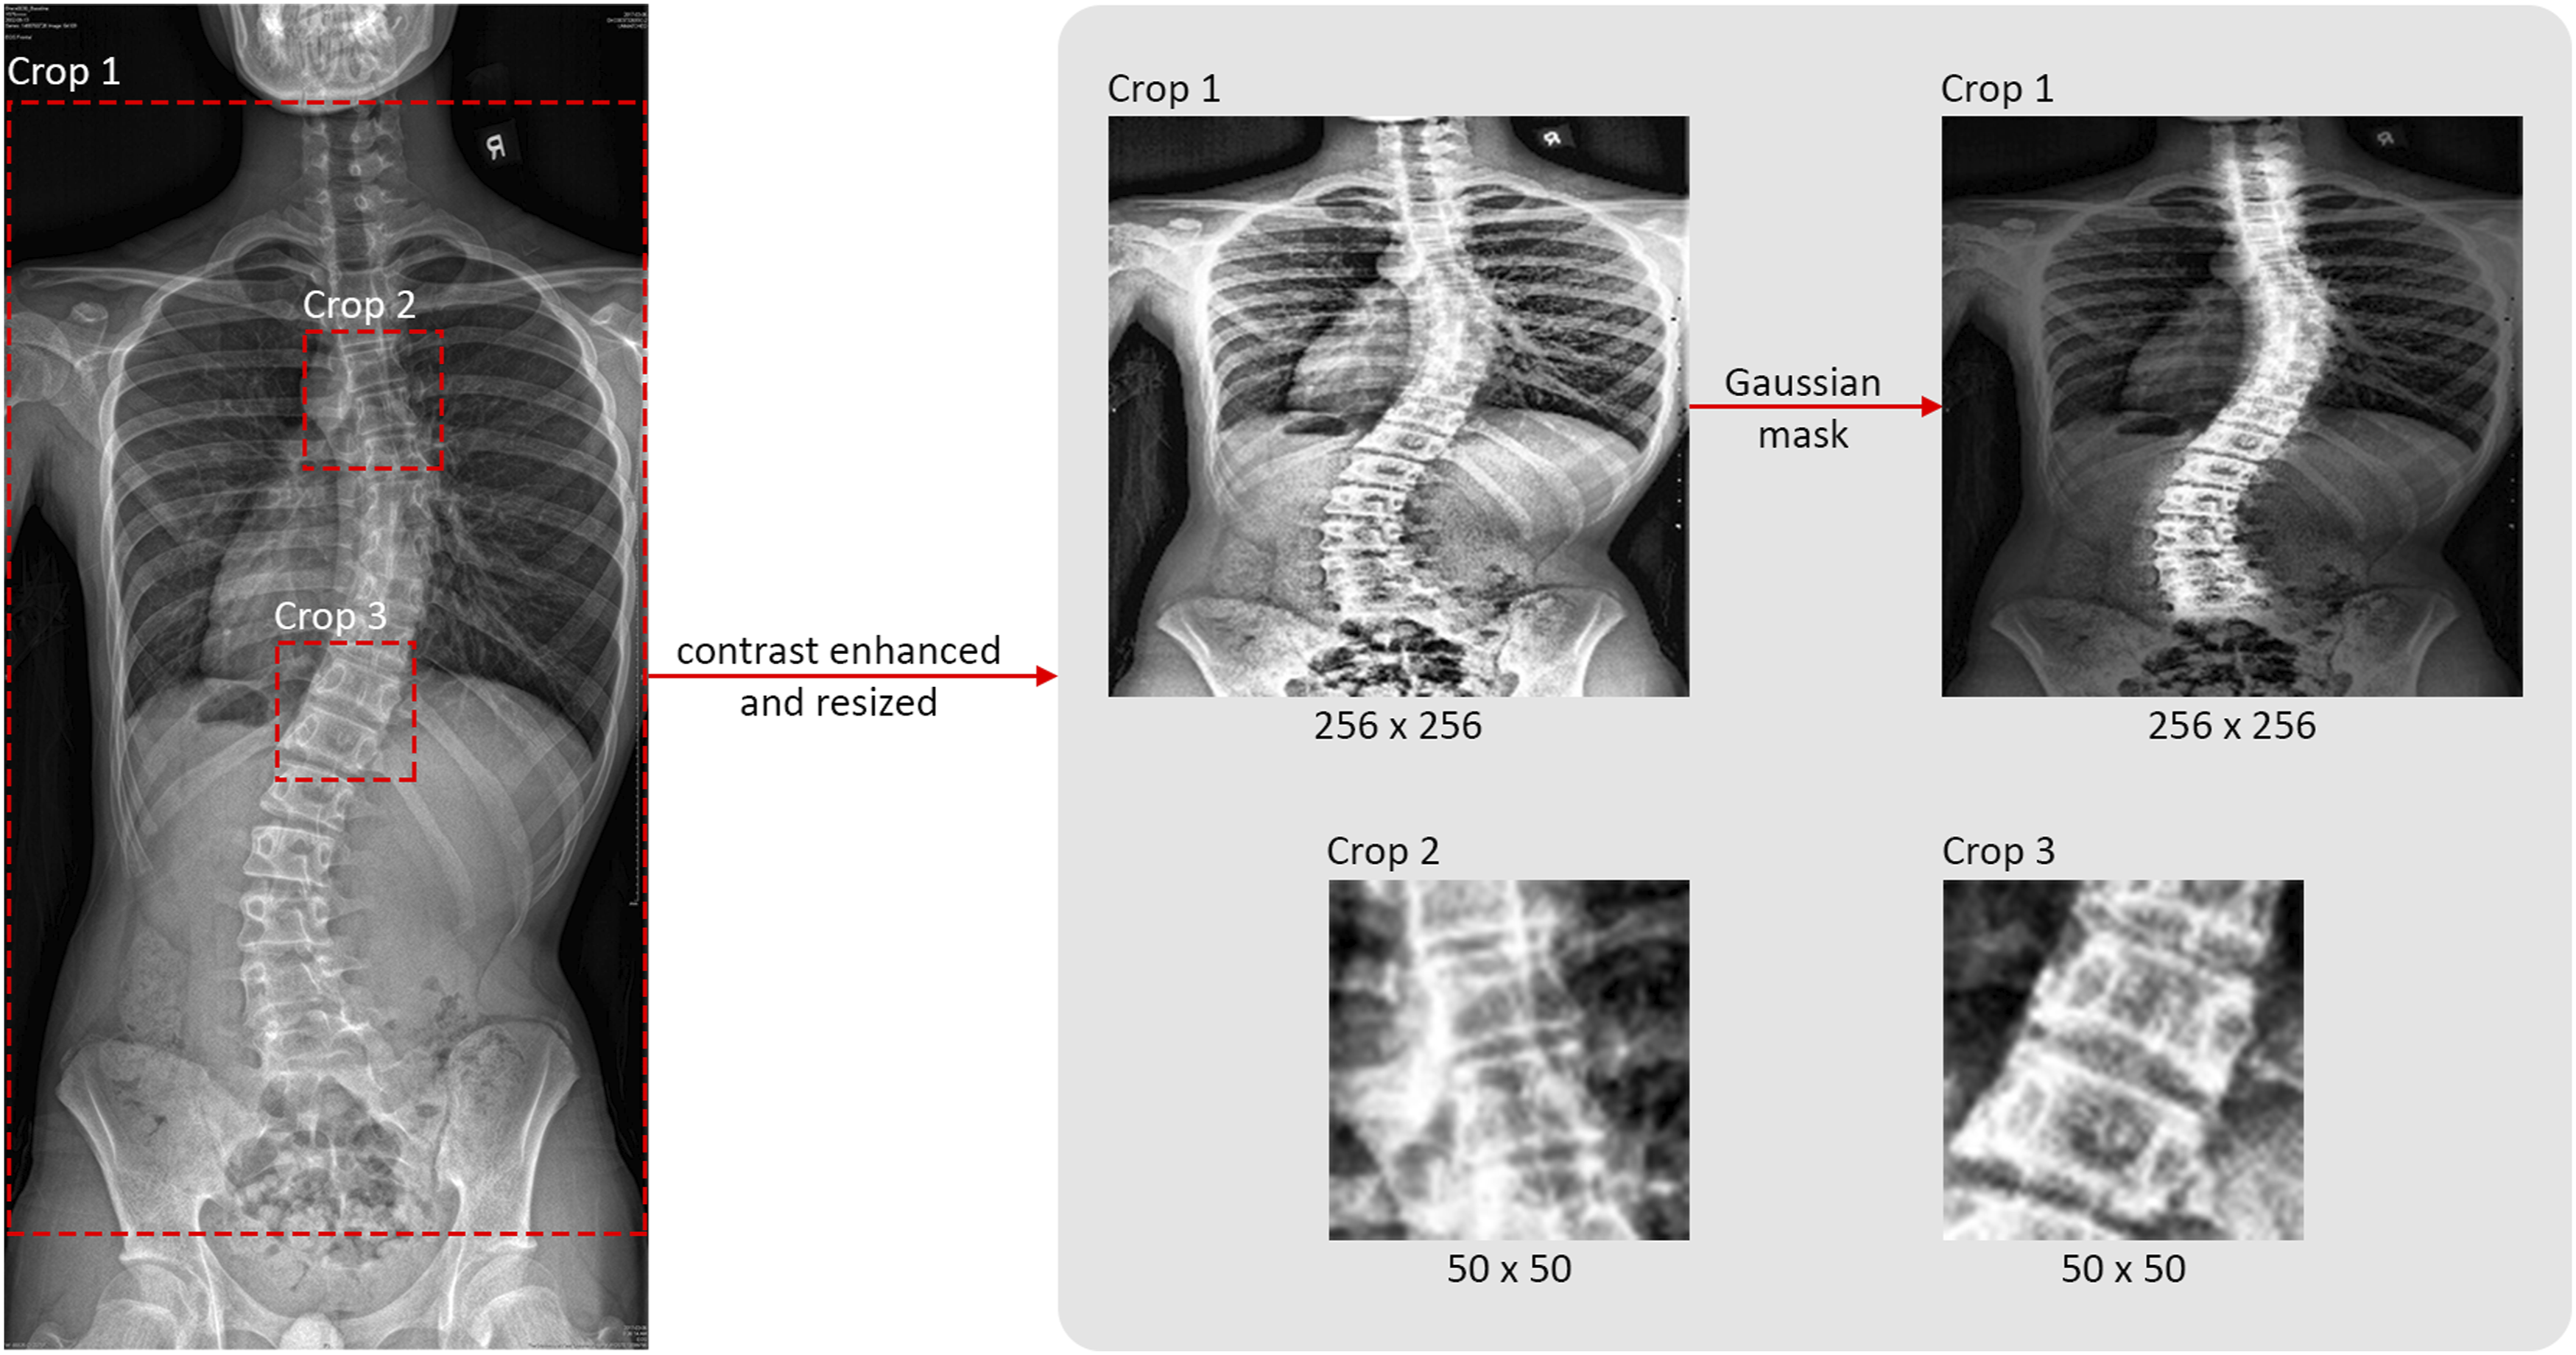
Third, due to the overwhelming amount of extra-axial information on the radiograph, for example the lung fields, the heart and the upper limbs, the endplate coordinates of all vertebral bodies generated by AlignProCARE were adopted to segment the spine and to create a gaussian mask that enhances its intensity in the whole-spine crop images.
Lastly, the whole-spine ROIs were resized to 256 × 256 square images and the end vertebra ROIs were resized to 50 × 50 square images. The ROIs were saved as single channel grayscale images in JPG format which then served as 2D inputs of the modified CapsuleNet model.
Clinical Parameters Preprocessing for Model Training
The clinical parameters used in this study include sex, age, weight, sitting height, standing height, arm span, Risser sign, distal radius and ulna classification for skeletal maturity assessment, 10 and bracing compliance. Categorical data were represented as 1D unit vectors, whereas numerical data were normalized to a number between 0 and 1.
One of the biggest potential challenges of this study was perhaps the issue of missing data. Unfortunately, the numerical parameters of this study were highly specific to adolescent growth which is time-dependent, and thus could not be re-recorded appropriately if missed. Nonetheless, data imputation was not indicated, and the missing data was handled by replacing them with the value -1 after normalization. This manipulation aimed to help the neural network recognize the presence of data that was well outside of the normal ranges.
All data was then concatenated into a single 1D vector with the same order for all patients; the specific order was randomly decided. These processed vectors then served as the 1D input of the modified CapsuleNet model.
Definition and Calculation of AIS Curve Progression for Model Training
The presence of AIS curve progression was defined by a minimum increase of 5° in major curve Cobb angle
26
from the time of diagnosis to any follow-up within the follow-up timeframe, which is at least three months in duration. Participants with less than 5° increase in major curve Cobb angle and those with curve correction within their follow-up timeframe are thus labeled as non-progression. Paired examples of each class are illustrated in Figure 4. The initial and final Cobb angles were calculated with the major curve endplate coordinates automatically generated by AlignProCARE after which the presence of progression could be easily determined. The progression status of each patient was labeled as [0, 1] for progression or [1, 0] for non-progression. This binary vector was the expected output of the modified CapsuleNet model.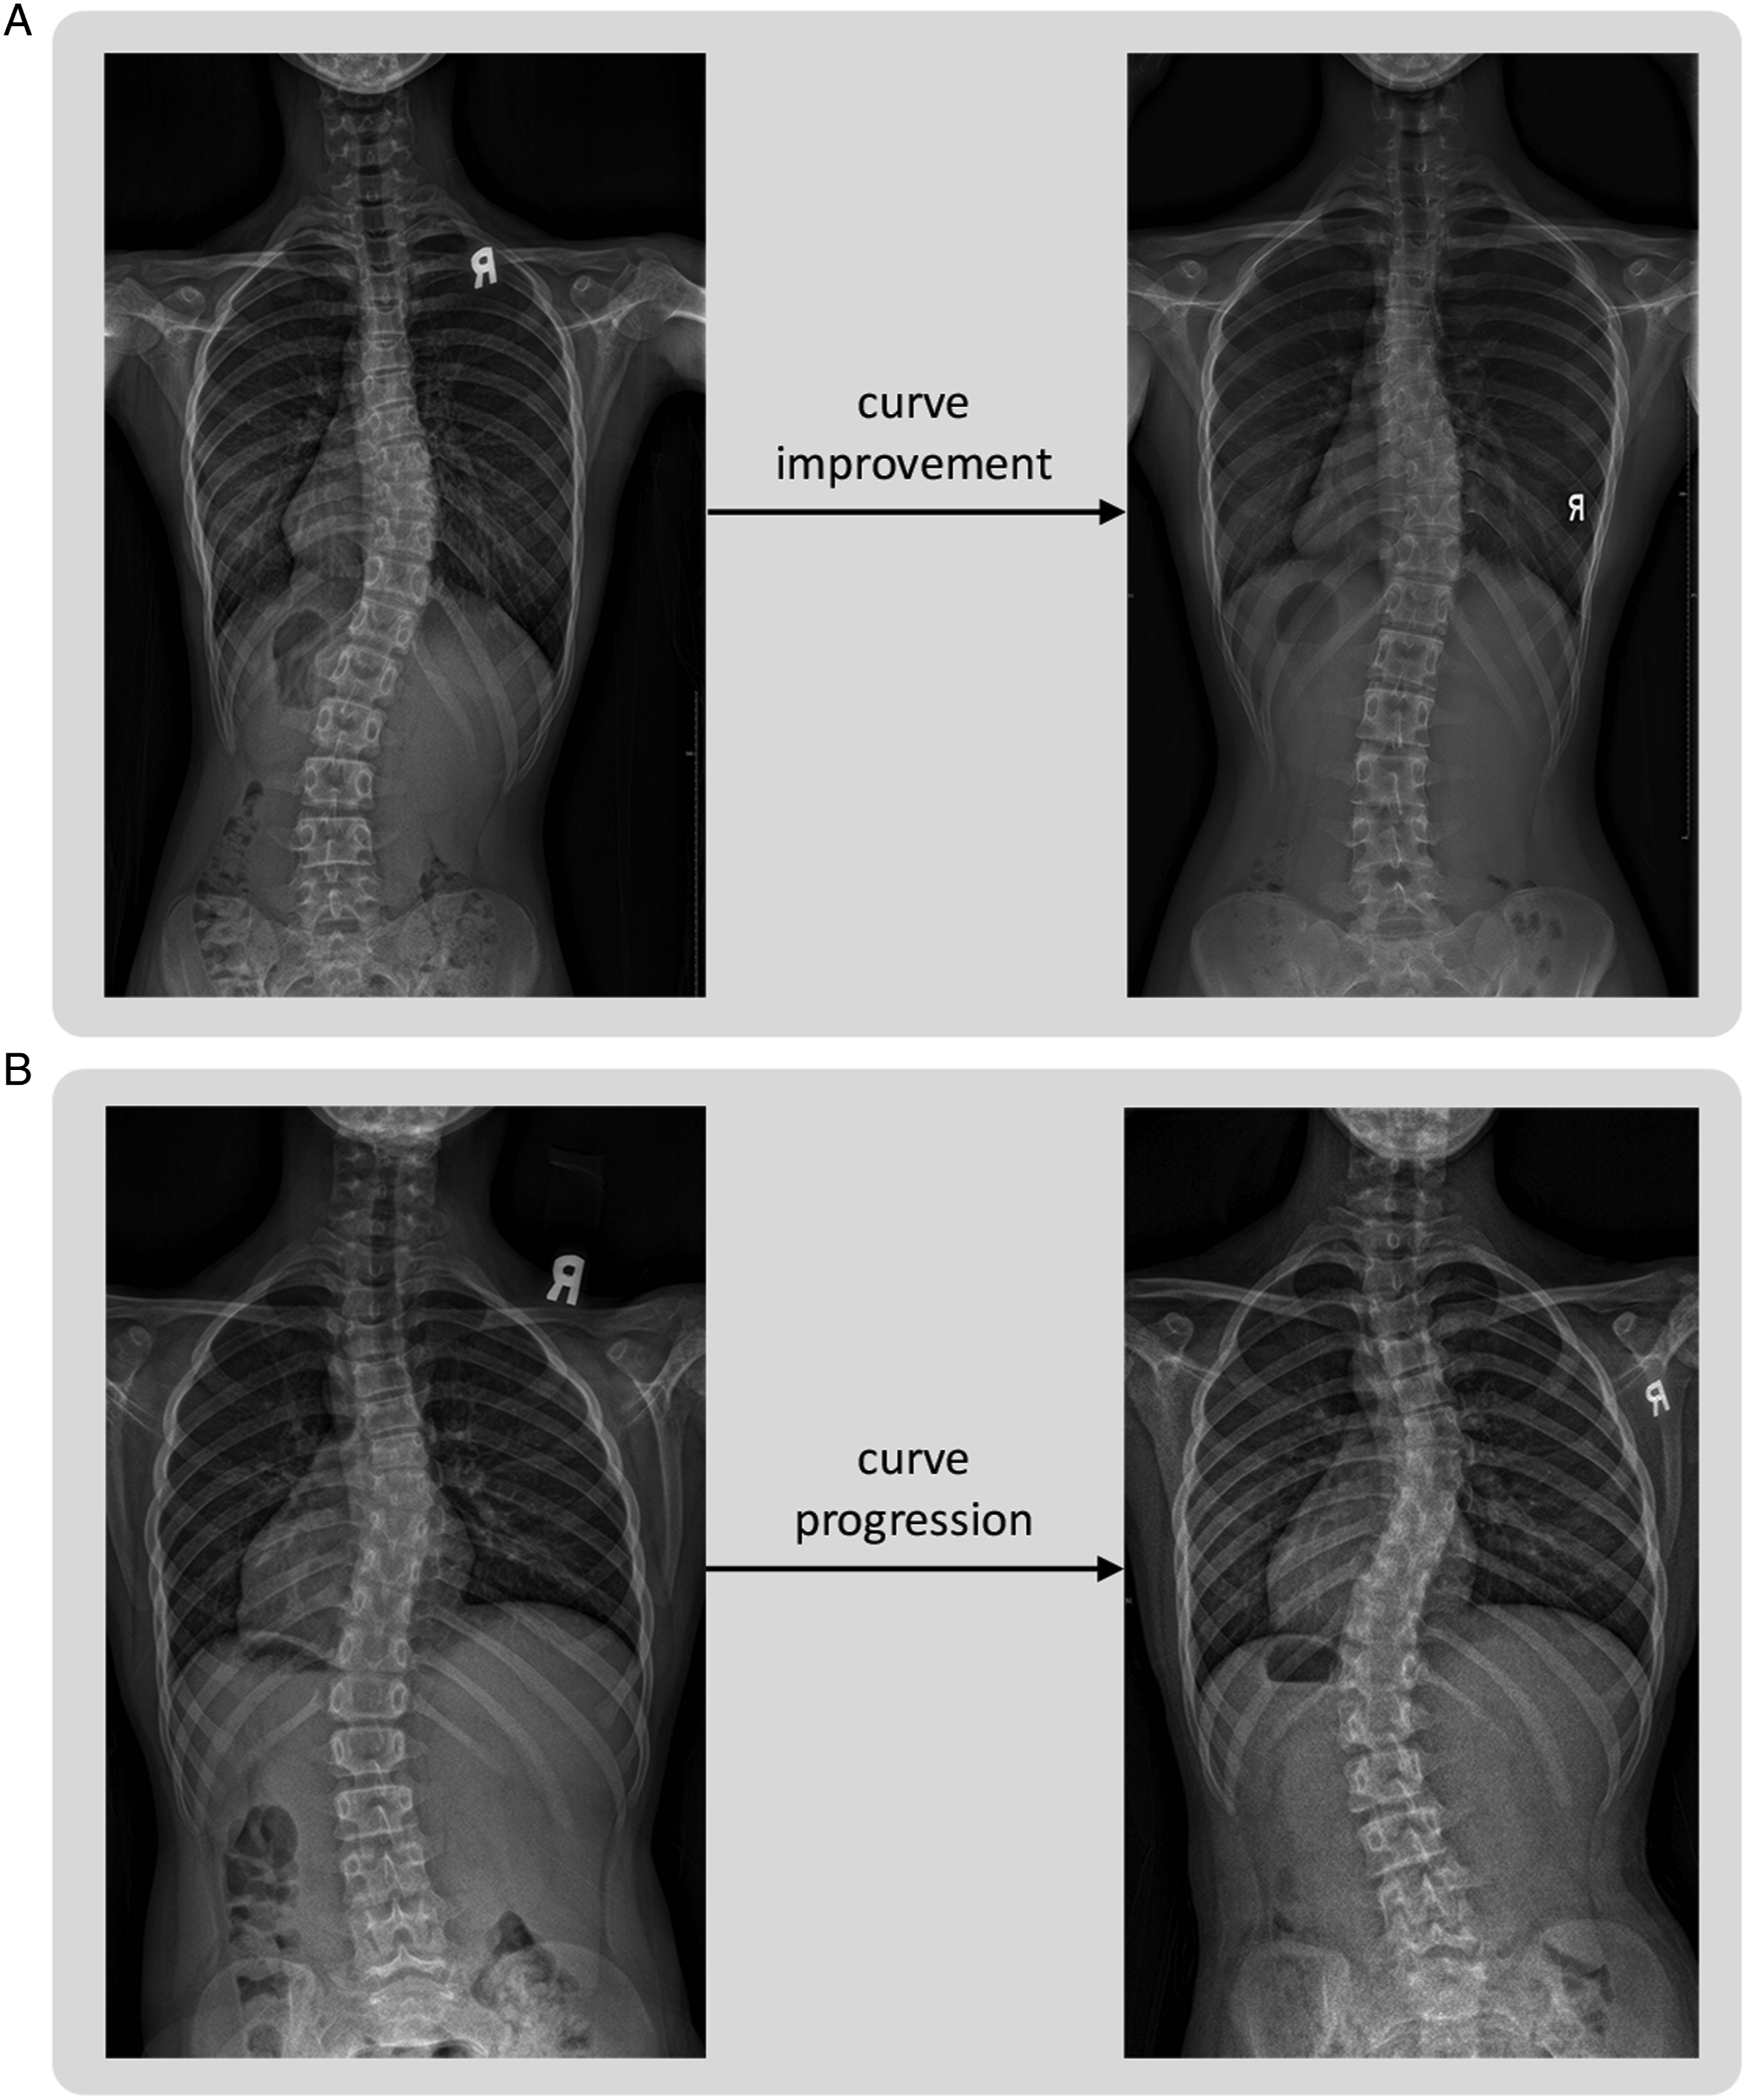
Prediction Model and Pipeline
CapsuleNet, developed by Sabour et al., 27 is believed to be suitable in extracting orientation-related features within the radiographs, including vertebral rotations and rib asymmetry, in addition to other general spatial features efficiently. The capsule design, dynamic routing and equivariance property enable CapsuleNet to extract more orientation information accurately and thus can make more accurate classifications of 2D images in spinal radiographs compared to conventional convolutional neural network (CNN) architectures.
Using CapsuleNet as the backbone, a new model is eventually developed by feeding preprocessed posteroanterior radiographs and clinical growth data to automatically predict the likelihood of AIS progression. The modified CapsuleNet of this study (Figure 5) had a four-channel multi-dimensional input and a binary output. The three 2D-input channels consisted of one 256 × 256 input for the whole-spine image and two 50 × 50 inputs for the end vertebra images. The end vertebra images were included to put more emphasis on the major curvature. The remaining 1D-input channel received the vector of clinical growth parameters. The modified CapsuleNet model adopted in this study. The major feature is the concatenation of the 1D inputs and 2D inputs before passing into the backbone of CapsuleNet. The 1D inputs consist of the clinical parameters whereas the 2D inputs consist of the three ROIs generated per radiograph. The 1D inputs are passed to a Dense layer first and repeated into 2D square matrices to expand in dimensions to meet those of the 2D ROIs. With the same dimensions, the once 1D parameters are now concatenated with the 2D ROIs. The concatenated tensor is first passed to a Conv2D layer for preliminary feature extraction, then into the PrimaryCapslayer where squashing takes place. The two 50 × 50 layers are concatenated before passing to the PrimaryCaps layer. The outputs of the PrimaryCaps layer are then all concatenated and passed to one capsule, ProgressionCaps, for routing. The length of the capsules is then calculated and presented as the main output of this model which represents the probability of IS progression.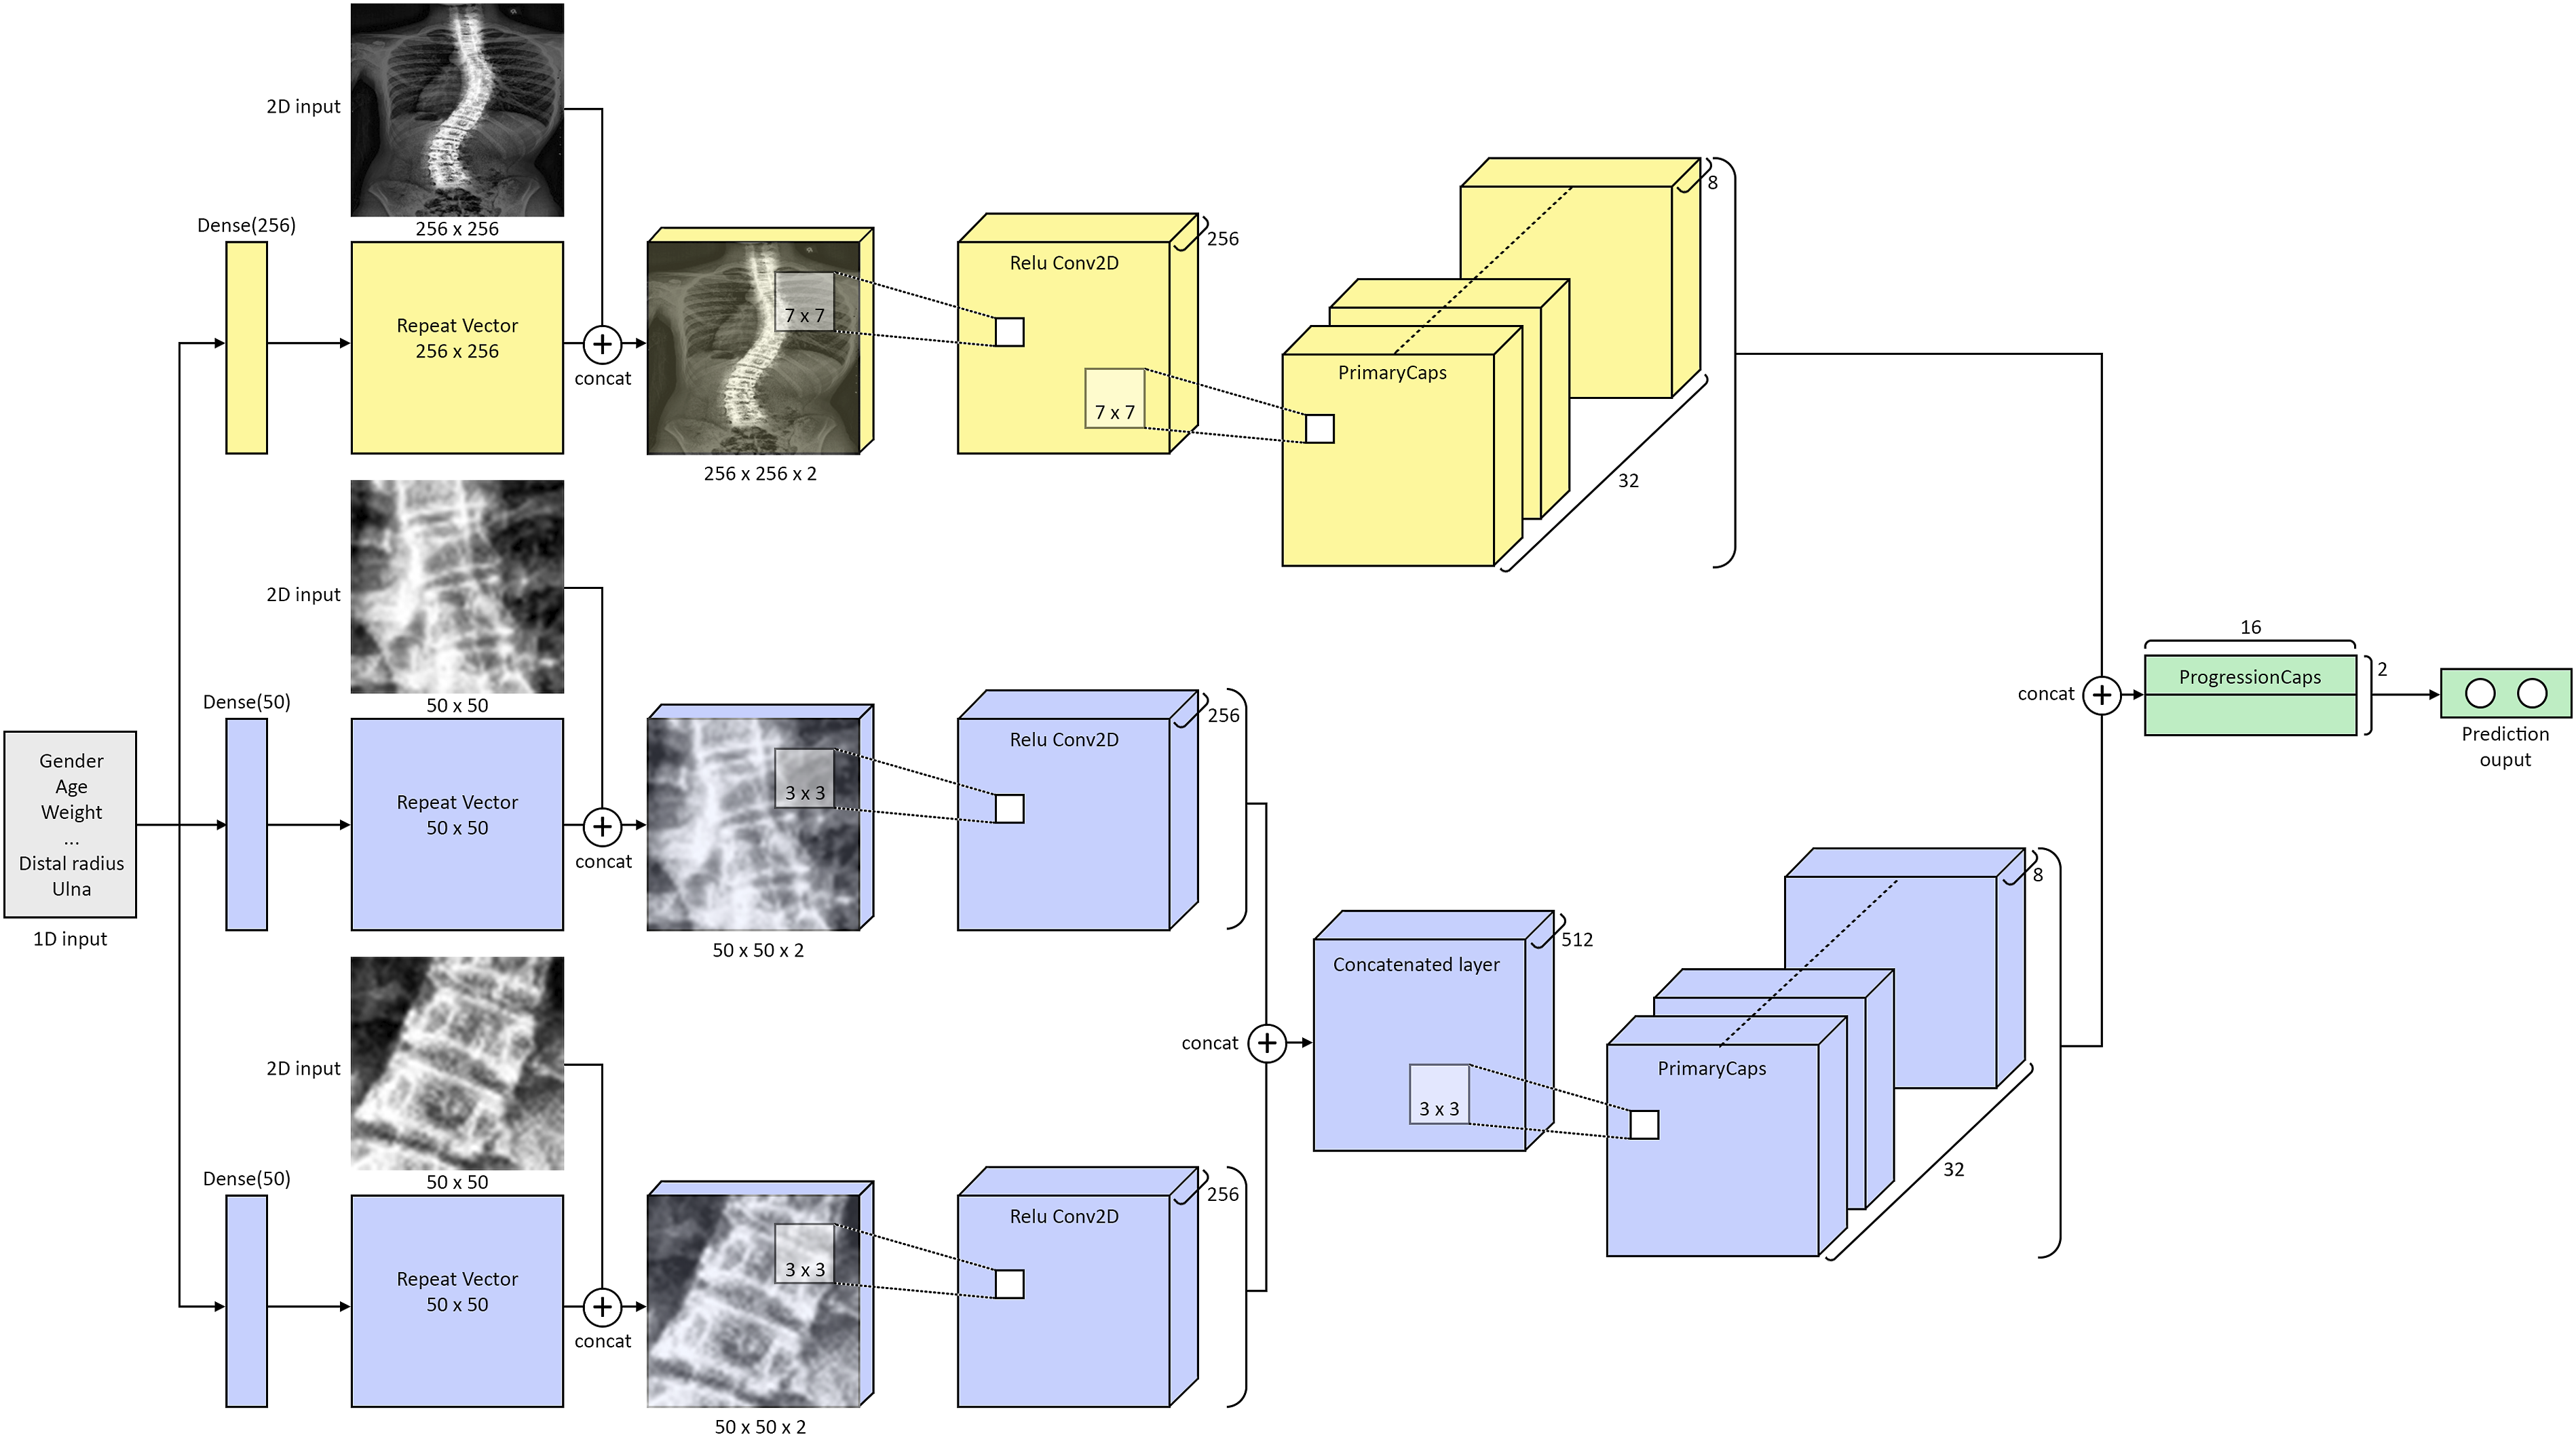
The 1D input was quickly passed into a fully connected layer to extract features and expanded in size up to 256 and 50 elements. The expanded vectors were then repeated to form 256 × 256 and 50 × 50 squares to match the dimensions of the whole-spine images and the end vertebra images respectively. Then, with synchronized dimensions, the images and the expanded clinical parameter layers were concatenated and organized into three main branches, one for each 2D ROI input. Each branch was followed by a convolutional layer with batch normalization and rectified linear unit activation. L2 regularization was also added to minimize overfitting. The two end vertebra branches were then concatenated into one and passed to an additional convolutional layer. Then, the two remaining branches were passed into separate Primary Capsule layers where corresponding features were extracted. The two sets of Primary Capsule outputs were then concatenated and passed into one Capsule Layer. Lastly, the votes from the routing-by-agreement mechanism were then summed and normalized by a squash function to output a likelihood vector. 27 The output vector of CapsuleNet was binarized into a [0, 1] or [1, 0] used for AIS progression prediction.
To start training the model, the dataset was split into a training set and test set with a four-to-one ratio with a training size of 371 and a test size of 92. All 2D input images were randomly augmented by (1) lateral flip, (2) rotation between -30° and +30° and (3) zoom between .8 to 1.2. The modified CapsuleNet model was trained for 100 epochs and at a learning rate of 1e-3, decaying at a rate of .9 per epoch. The Adam optimizer was employed, and cross categorical entropy loss function was used.
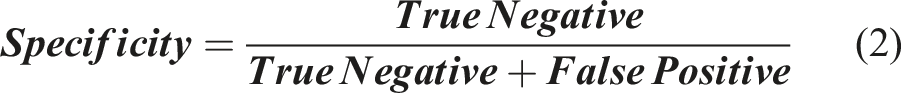
Evaluation Metrics
The development of the modified CapsuleNet model aims to screen for AIS patients with high risk of in-brace curve progression. In addition to high sensitivity and specificity, a reliable healthcare screening test should also have a good negative predictive value to confidently discharge patients without the condition screened. Nonetheless, for a comprehensive evaluation of model performance, the following metrics were generated: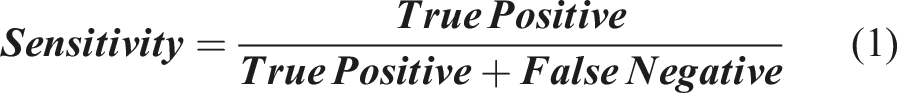


Results
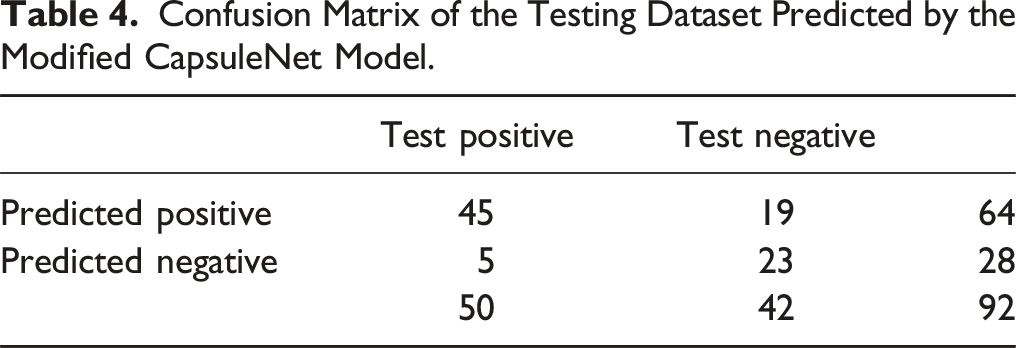
Confusion Matrix of the Testing Dataset Predicted by the Modified CapsuleNet Model.
Performance Metrics of the Modified CapsuleNet Model, ResNet Model and DenseNet Model.
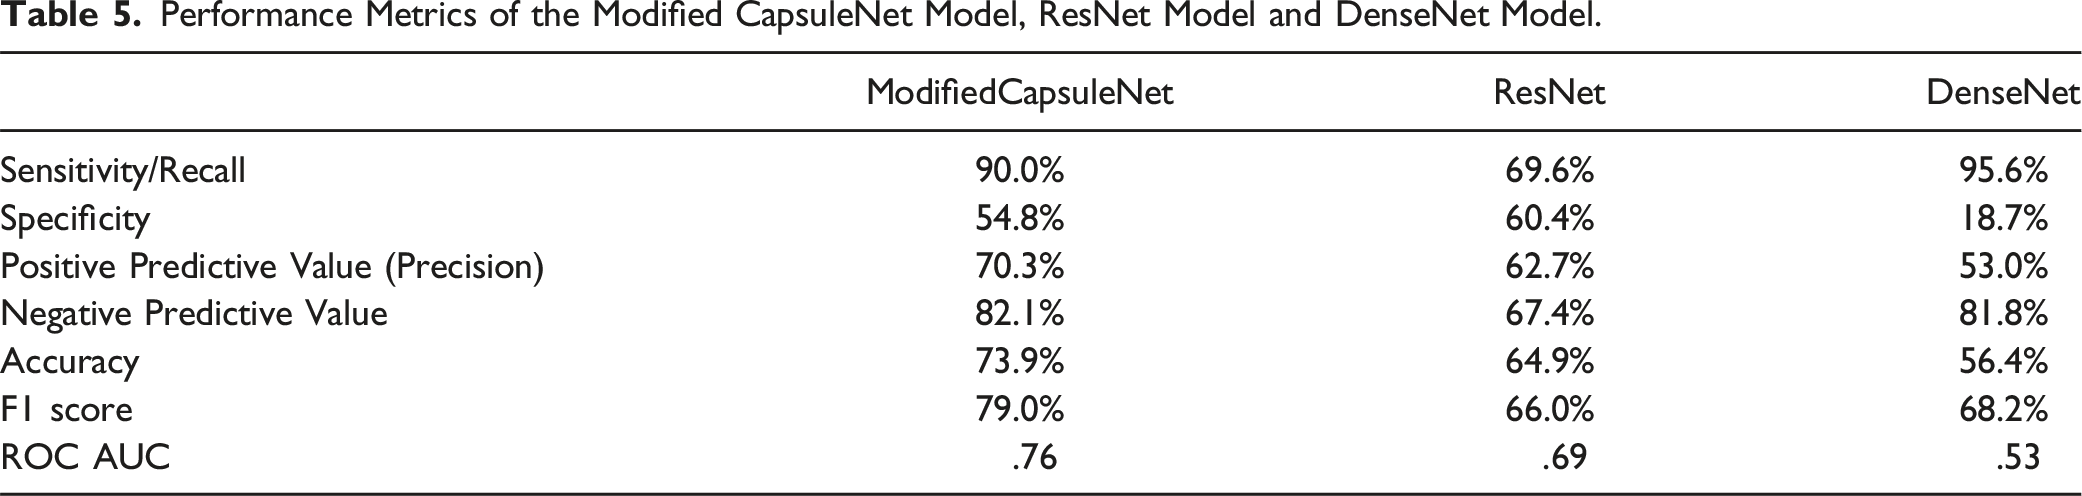
The modified CapsuleNet achieved an overall accuracy of 73.9% with a high sensitivity of 90% and a negative predictive value (NPV) of 82.1%. The ResNet and DenseNet models were trained in order to compare our modified CapsuleNet architecture with conventional CNNs and their performance metrics are juxtaposed in Table 5. The receiver operating characteristic (ROC) curves of the respective models are plotted in Figure 6. It is evident that the ROC curve of the modified CapsuleNet has a significantly larger area under the curve than the conventional CNNs. The ROC curve of the modified CapsuleNet model (blue line) has the largest area under the curve, outperforming the ResNet model (red line) and the DenseNet model (green line). This indicates that the modified CapsuleNet model is able to achieve a higer sensitivity with a smaller compromise in specificity.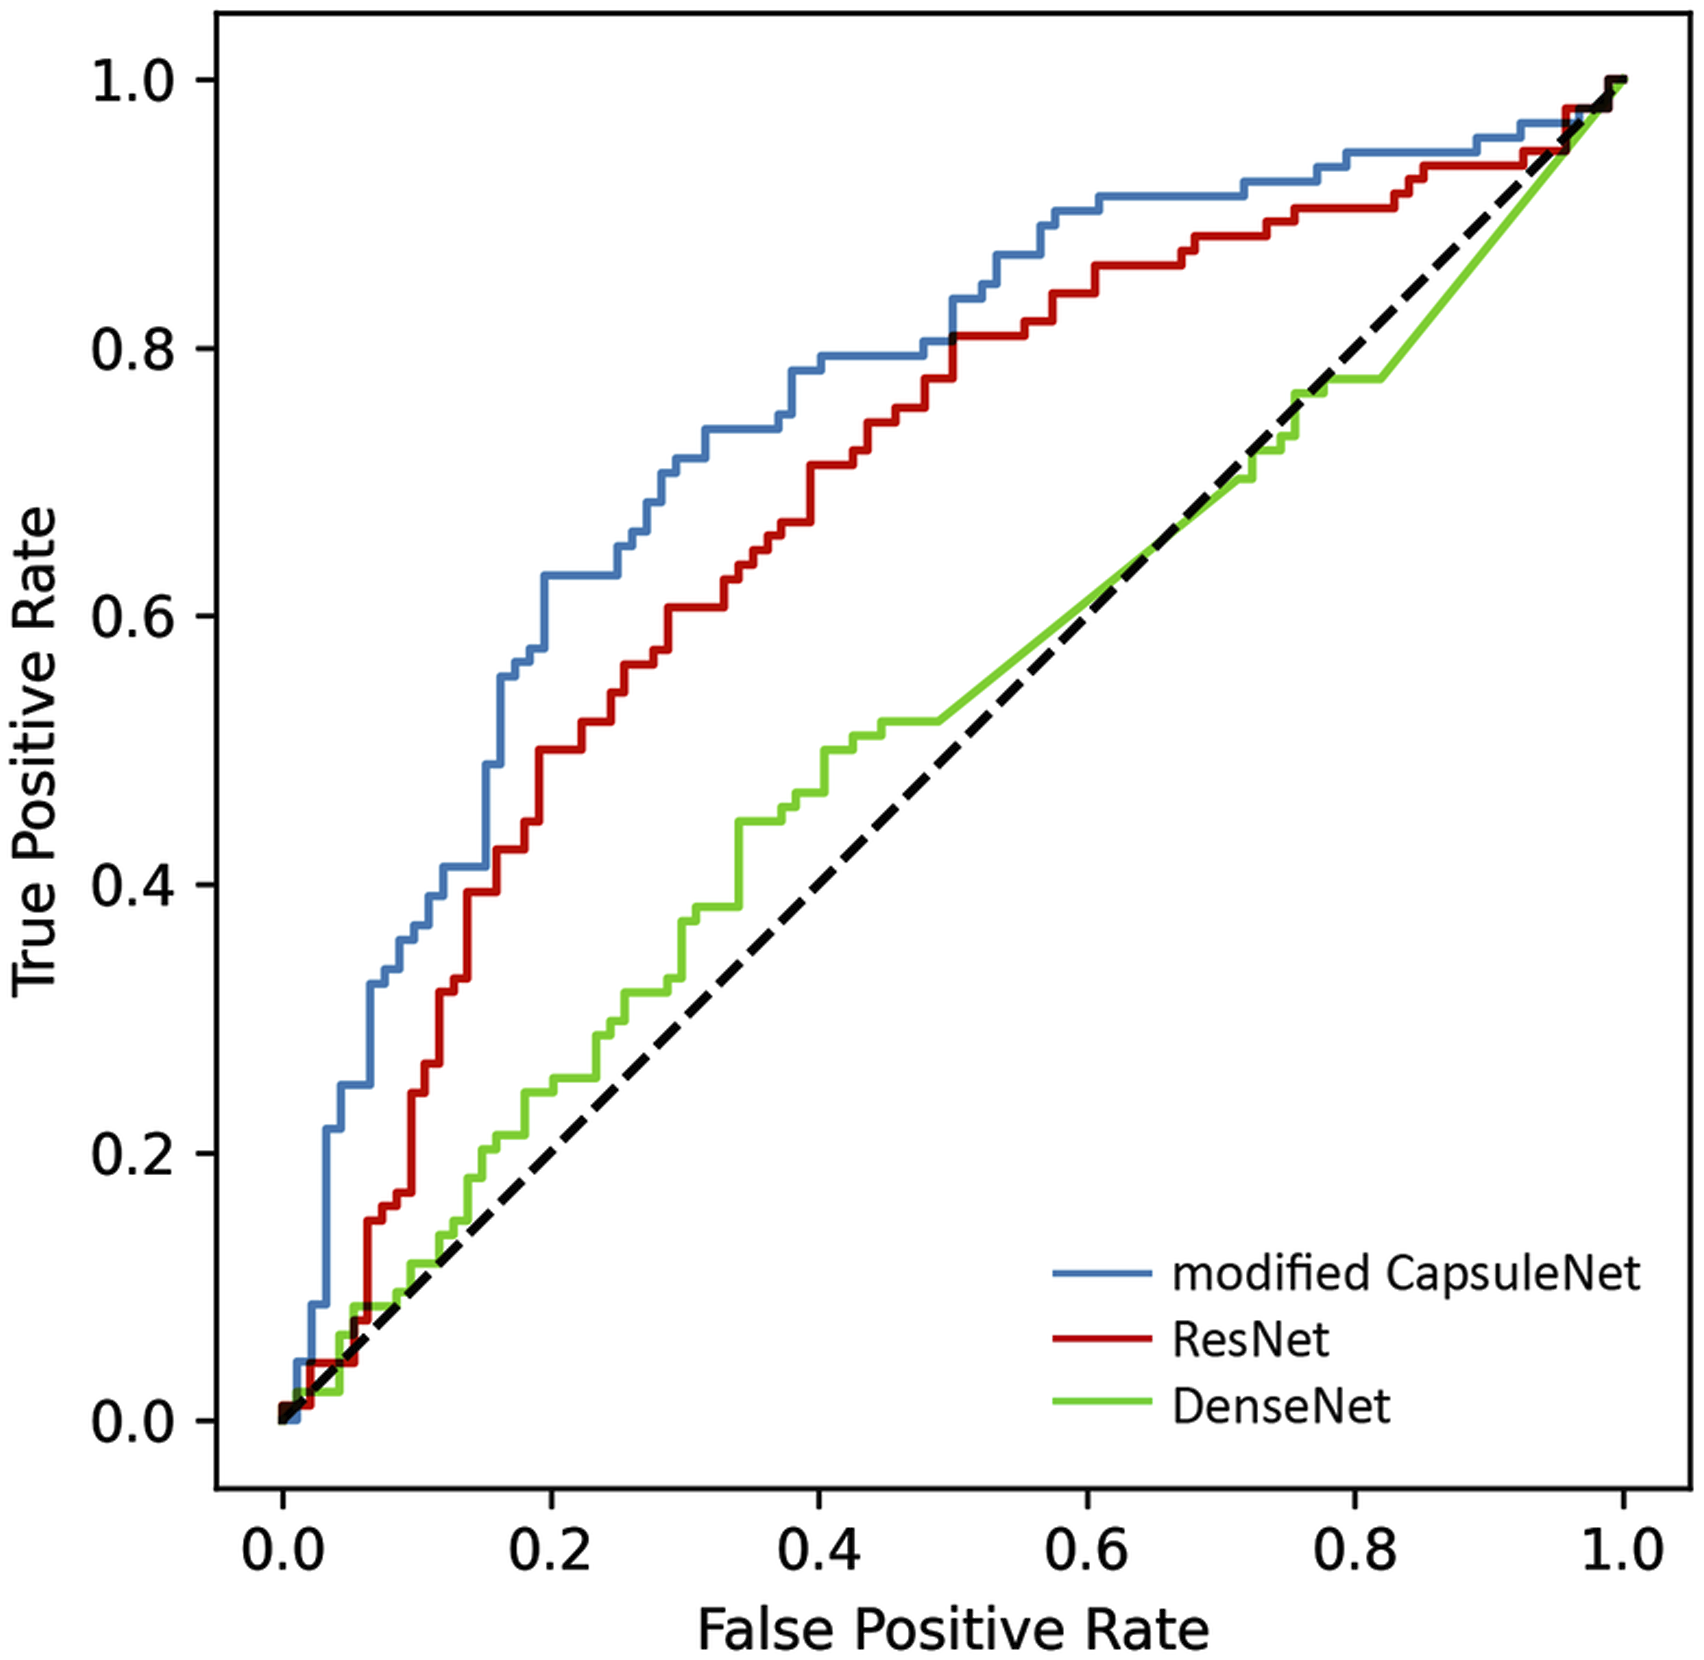
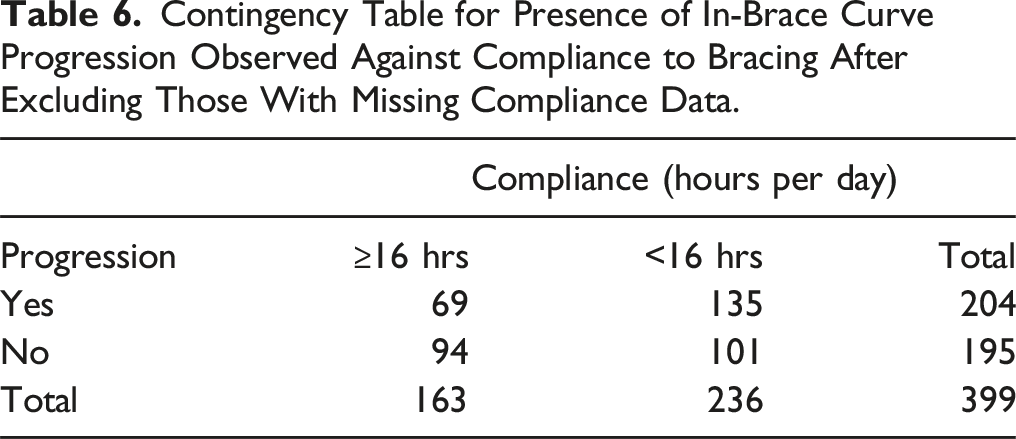
Contingency Table for Presence of In-Brace Curve Progression Observed Against Compliance to Bracing After Excluding Those With Missing Compliance Data.
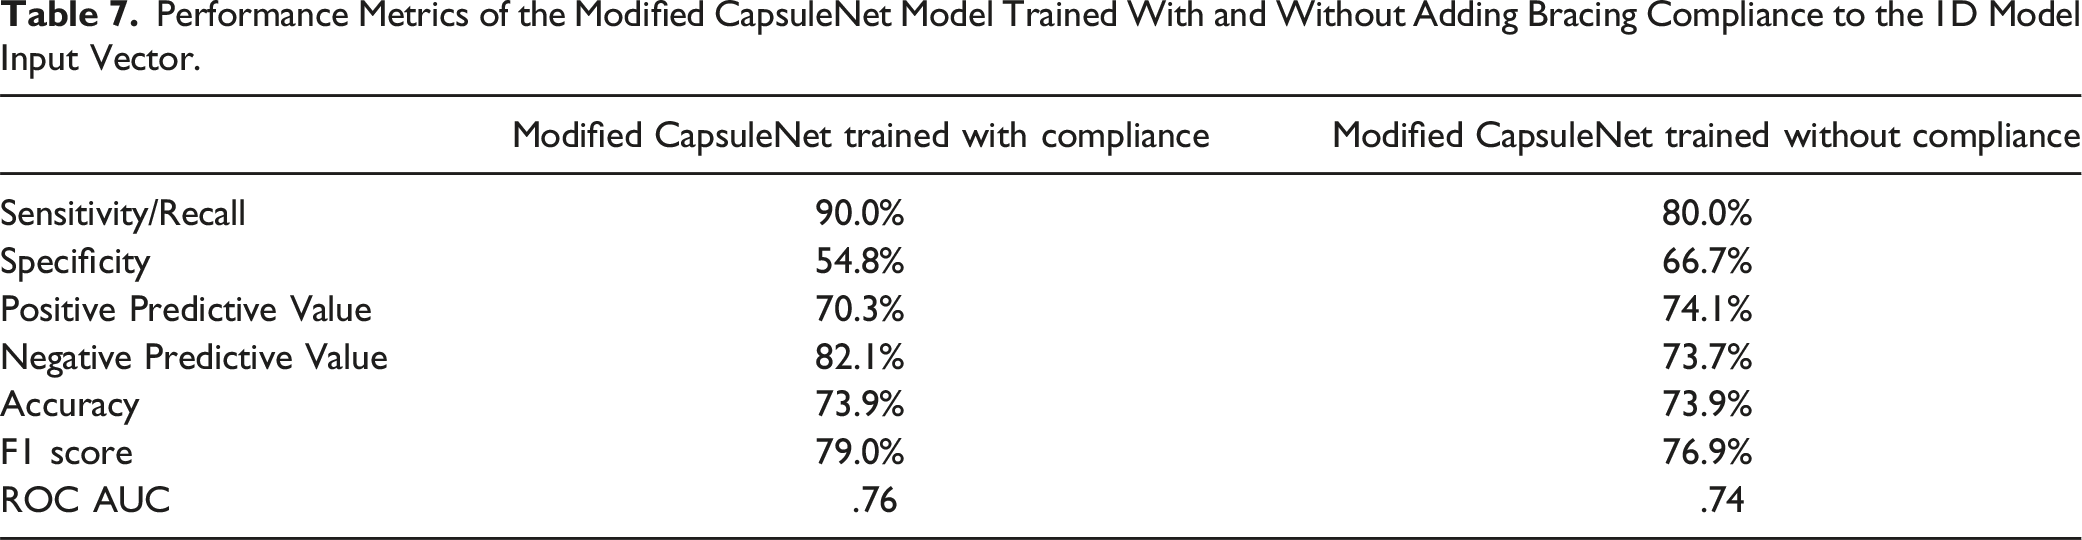
Performance Metrics of the Modified CapsuleNet Model Trained With and Without Adding Bracing Compliance to the 1D Model Input Vector.
Discussion
The prediction performance metrics of the generated model in this study show promising potential applications. The best metrics are sensitivity (90%) and NPV (82.1%), which outperformed a radiographs-only model. 23 As all recruited participants had already undergone treatment with bracing orthosis upon diagnosis, these results suggest that this model could be a great screening tool to confidently identify individuals without the risk of in-brace curve progression, who can be managed with bracing orthosis until their spine is fully developed. The straightforward pipeline also allows this model to be easily applied to supplement daily clinical practice in AIS management.
In addition to the conventional growth predictors, bracing compliance was included in the 1D input for model training. Patient compliance to bracing treatment is essential to successfully arrest curve progression. 28 However, in this study population, bracing compliance was poor, with only 163 (35.2%) participants wearing the braces for the accepted minimum of 16 hours per day, and 236 (50.9%) participants wearing the braces for less than 16 hours per day, as shown in Table 3. To determine whether including bracing compliance in model training was necessary, a brief analysis, excluding those for whom compliance hours were not recorded, was conducted by performing a chi-square test. The test yielded a P-value of .0035, indicating that curves were highly unlikely to progress independently of bracing compliance in this population. As a result, compliance data was added to the 1D inputs for model training, as seen in the set of performance metrics in Table 7, which demonstrates that adding compliance improved model performance. Therefore, the discussion below focuses on the model trained with bracing compliance included.
Moreover, the specific metrics have meaningful clinical implications. Firstly, the model’s high sensitivity of 90% and PPV of 70.3% mean that it has a low chance of missing a diagnosis of in-brace curve progression, and that management indicated has a good chance of benefiting patients who may still progress despite bracing. Therefore, in addition to offering immediate bracing, almost all patients with a predicted risk of in-brace curve progression can be reviewed more frequently or at least flagged for close observation. 29 More rigorous lifestyle modifications, including exercises and physiotherapy, can also be encouraged, 30 and bracing compliance should be ensured in patients at risk of progression. Specialists can also pay more attention accordingly when performing physical examinations and radiographic interpretations and further decide if it is necessary to monitor progression more closely only for those at risk, which will alleviate any busy clinic and reduce unnecessary healthcare costs. Additionally, it is economically favorable to offer bracing treatment at a higher frequency as such arrangement can reduce the rate of costly surgeries and potential complications29,31 by slowing down curve progression. Thus, from a health economics perspective, it is still feasible to commence bracing management on a patient if the model predicts a positive in-brace progression risk despite its relatively low specificity of 54.8%. Of course, the possible psychosocial and physical impacts of bracing should still be explored with the patients. 32 Integrating the model’s prediction with the clinician's expertise and experience can maximize the overall accuracy of AIS progression prediction in clinical practice and can limit the influence of false positives on the patients, ultimately minimizing unnecessary stress and lifestyle adjustments for patients and families as well as preventing unnecessary treatment and resource consumption.
Secondly, the relatively high NPV of 82.1% indicates that as long as the model labels a patient as “non-progression” at the first visit, there is a high probability that the patient will not undergo in-brace curve progression if given bracing. Consequently, healthcare resources can be redistributed to those more likely at risk and reassurance can be given to the patient and their family. With the help of the model, all these decisions can be made with the patients and families during the first visit to the clinic.
The integration of this model to routine consultations is straightforward and shows promise in assisting clinicians in the process of formulating a management plan for AIS patients by automating the prediction of the probability of in-brace curve progression. With the utilization of AlignProCARE in this study, the ROIs for the model can be automatically generated, making the entire prediction pipeline fully automated. Recently, there have been several genetic bioinformatics studies that explored the genetic variants associated with AIS manifestation. 33 Although several genes have been validated by literature, the incorporation of an expensive and time-consuming genetic study in a routine diagnosis pipeline may not be the most cost effective and convenient arrangement. Another study proposed a prediction pipeline involving 3D structural parameters, like plane of spinal torsion and disk wedging, which require 3D reconstruction of biplanar radiographs. 19 Not all clinics have access to an EOS system to take biplanar X-rays and possess the computation power to perform 3D reconstruction and analysis quickly. Although the posteroanterior radiographs of the participants in this study were collected with the EOS system which offers high resolution and great readability, this does not undermine the potential scalability of this model as only single-plane posteroanterior radiographs are required for prediction, which could be obtained by regular X-ray imaging systems. Nevertheless, a future study may be conducted with the modified CapsuleNet model to further evaluate the possibility of using conventional 2D radiographs as the 2D input.
Regarding the modified CapsuleNet model design used in this study, only the version using a hybrid input with 2D radiographs and 1D clinical parameters managed to perform at such a level of accuracy, sensitivity and negative predictive value. Using either inputs alone, 2D only or 1D data only, the overall performance accuracies are 54% and 57% respectively. In addition, several structural modifications were made to the CapsuleNet model backbone to improve the performance metrics. Neural networks with multiple input channels of the original and processed images have been shown to improve the segmentation accuracy of the target organ and tumor in computer tomography images compared to those with single inputs only. 34 Moreover, CapsuleNet performs better with images with lower complexity 35 but a typical frontal spinal radiograph is visually complicated and simply downsizing the whole-spine ROI would tremendously jeopardize the spatial resolution and information. Therefore, the end vertebral bodies of the major curvature, which are visually much less complex, were cropped into ROIs and used as supplementary 2D inputs together with the whole-spine ROI. In terms of the manipulation of multi-dimensional inputs, instead of merging the different dimensional inputs at the end by concatenation and adding fully connected layers thereafter, 36 this model mapped the 1D clinical data into 2D matrices that match the corresponding 2D radiograph input shapes (50 × 50 and 256 × 256) and were concatenated together before passing into the capsule layers. This early merge of the hybrid data improved the accuracy of the model as more features could be extracted by the early layers of the network to make a more accurate prediction. All these modifications in the design of the network architecture contributed to the final model presented in this study. The fact that our model is able to predict AIS progression with acceptable overall accuracy within the bracing population implies that the features associated with in-brace progression are present in the input data — both the 1D clinical growth parameters and the 2D radiographs, and the integration of these inputs is essential to making a reliable prediction.
The training outcome clearly indicates that the modified CapsuleNet model architecture outperformed conventional CNNs, like ResNet and DenseNet. Instead of using scalar-output feature detectors and max-pooling in conventional neural networks, CapsuleNet implements vector-output capsules and routing-by-agreement to increase the model efficiency and precision in learning the entities of each specific region of the image. 27 This advantage makes CapsuleNet a great candidate in detecting fine spatial information, specifically orientation information in this case, more accurately with better generalizability.
This study came with several limitations. The first challenge was the relatively small sample size. For example, in a recent study using a modified version of CapsuleNet to detect COVID-19 infection from chest X-rays, a total of 1342 images were used. 37 The second challenge was the amount of missing 1D clinical data. Data imputation is not appropriate in this case as the clinical data appears to be missing at random. 38 Since the recruitment of AIS patients commenced in 2016, the retrospective nature of the study did not allow the investigators to acquire a complete set of clinical data.
In order for the current modified CapsuleNet model to function as a reliable screening tool with enhanced sensitivity and especially specificity, several improvements to the current study should be implemented. As immediate next steps, more patients with AIS need to be prospectively recruited to generate a larger and complete dataset involving the accurate recording of at least the conventionally acknowledged risk factors for AIS progression 8 and skeletal maturity indicators, along with the radiographs. With a more comprehensive dataset, the feasibility of this automated multi-dimensional approach in predicting AIS progression can be further evaluated in a prospective clinical trial.
Conclusions
This study utilized a modified version of the CapsuleNet model to create an AI model that predicts in-brace AIS progression risk with a high sensitivity level at 90%. The results demonstrate the complementary nature of 2D radiographs and 1D clinical data in developing a reliable model for predicting progression risks. Using such an AI model in clinical practice as a preliminary screening tool would aid in the personalized management of AIS patients indicated for bracing. Patients without in-brace progression risk can be reassured and managed by bracing and other lifestyle modifications, while patients with suspected in-brace progression risk can receive first-line bracing treatment and can be monitored more closely with more frequent reviews on the braces to suppress progression and minimize the need for costly interventions. Thus, the results from the model offer additional insights for clinicians and assist in better personalizing the management of AIS patients indicated for bracing.
Footnotes
Declaration of Conflicting Interests
The author(s) declared no potential conflicts of interest with respect to the research, authorship, and/or publication of this article.
Funding
The author(s) disclosed receipt of the following financial support for the research, authorship, and/or publication of this article: This research was funded by Mid-stream research fund (MRP/038/20X) and HKU impact case development fund.