
Abstract
Background:
This study examines working hours, shift work, and remote work patterns by occupation and industry among U.S. full-time workers, along with the association between working and sleeping hours.
Methods:
Utilizing data from 2011 to 2020 American Time Use Survey, this national household survey examines how individuals aged 15 years or older in the United States spend their time within a 24-hour period.
Findings:
In 2011 to 2019, U.S. full-time workers averaged 8.1 hours of work and 7.8 hours spent sleep on workdays, increasing to 9.6 hours on non-workdays. Among all occupations, Emergency medical technicians and paramedics had the longest average working hours (10.4 hours). Protective services occupations had the highest percentage (41.7%) of workers reporting often working shifts other than daytime. Among all industries, truck transportation industry had the longest average working hours (9.2). Food services and drinking places industries had the highest percentage (28.6%) of workers reporting often working shifts other than daytime. Working hours showed a negative association with sleeping hours. In 2020, 34.0% of full-time workers reported remote work due to COVID-19, with the largest percentage (72.3%) occurring in business and financial operations.
Conclusions:
The study findings offer essential benchmarks for comparing working hours and schedules across diverse occupations and industries. These insights empower occupational health practitioners to advocate for prevention measures, addressing health concerns arising from prolonged working hours and shift work.
Background
Americans are known to work longer hours compared to those in other industrialized countries (Miller, 2024). In 2015, the average annual work hours for both full-time and part-time workers were 1,757 in the United States, 1,738 in Japan, 1,670 in the United Kingdom, and 1,354 in Germany (Clockify, 2021). Full-time workers in the United States generally follow a standard work schedule of 8 hours per day and 40 hours per week (U.S. Department of Labor [DOL], 2016). However, the Fair Labor Standards Act (U.S. DOL, 2009) does not impose a limit on the number of hours per day or per week for employees aged 16 years and older, except in certain regulated industries or occupations such as long-haul truck drivers, pilots, shipboard personnel on tankers, railroad conductors, medical residents, and flight crews for air-medical Emergency Medical Services (EMS) (Fass, 2015; SLLG, 2022). A study conducted by the American Medical Association Insurance in 2015 found that most physicians worked between 40 and 60 hours per week, with over a quarter of them reporting working more than 60 hours, and a small percentage (5%) averaging 80 hours or more (American Medical Association Insurance, 2015). In a national survey conducted by the National Institute for Occupational Safety and Health (NIOSH) in 2010, long-haul truck drivers in the United States reported working an average of 60 hours per week (Sieber et al., 2014). Another study focusing on active-duty officers in the Buffalo Police Department between 2004 and 2009 suggested that 32.3% of police officers worked more than 40 hours a week (Gu et al., 2012).
Working long hours can significantly impact the safety and health of workers (Fadel et al., 2023; Khan, 2018). According to the World Health Organization (WHO, 2021) and the International Labor Organization (ILO), in 2016, 745,000 people died from stroke and heart disease due to long working hours, averaging 2,041 deaths per day. Apart from cardiovascular diseases, studies have linked long working hours and inadequate sleep to type 2 diabetes (Darraj, 2023; Seo et al., 2022), poor mental health (Afonso et al., 2017; Harvard Medical School, 2019; Wong & Swanson, 2022), infectious diseases (Prather & Carroll, 2021), and injuries (Centers for Disease Control and Prevention [CDC], 2019; Ervasti et al., 2021).
Recognizing the importance of working hours, shift work, sleep, and fatigue for American workers and employers, NIOSH hosted the forum “Working Hours, Sleep & Fatigue: Meeting the Needs of American Workers & Employers” in September 2019 (Wong & Swanson, 2022). The forum aimed to bridge research gaps in the United States concerning working hours, sleep, and fatigue. Participants from labor, industry, academia, and government identified that most existing studies on long working hours and their impacts were based on small samples of workers from a specific occupation or industry. There is a lack of national baseline data to compare working hours across various occupations and industries (Wong & Swanson, 2022). This study aims to address the gap by assessing working hours and shift work by occupation and industry among American full-time workers. In addition, it evaluates remote work by occupation in response to the COVID-19 pandemic in 2020.
Methods
The study utilized data from the American Time Use Survey (ATUS) from 2011 to 2020 to examine the working hours, shift work, and remote work by occupation and industry among U.S. full-time workers. The ATUS, conducted annually by the U.S. Bureau of Labor Statistics (BLS, 2022b), aims to provide nationally representative estimates of how people allocate their time. The survey covers residents aged 15 years and older living in U.S. households, excluding active military personnel and individuals residing in institutions such as nursing homes and prisons. The ATUS data are public available and can be freely downloaded from the U.S. BLS website (ATUS home: U.S. Bureau of Labor Statistics [bls.gov]) or the ATUS-X site: https://www.atusdata.org (Flood et al., 2023). The utilization or analysis of the ATUS data does not necessitate Institutional Review Board (IRB) review. It is exempt from such review requirements.
The ATUS collects information on individuals’ time use between 4 a.m. on the previous day and 4 a.m. on the interview day. The survey selects a national household sample through a subset of households completing the eighth month interviews for the Current Population Survey (CPS), a monthly household labor force survey by the BLS (https://www.bls.gov/cps/). The ATUS sample households are selected to ensure that estimates will be nationally representative. Sample households for the survey are selected monthly and interviews are conducted continuously throughout the year.
Alongside time use data, ATUS collects demographic information, including gender, age, race, educational attainment, employment status, occupation, and industry. Occupation coding follows the 2010 Census Occupational Classification System for 2011 ATUS data and forward, while industry coding uses the 2012 Census Industry Classification System for 2014 ATUS data and forward. In this study, analyses related to occupation used 2011–2020 ATUS data, while analyses related to industry used 2014–2020 ATUS data. The 2010 Census Occupational Classification System categorizes occupations into 23 general occupational categories, while the 2012 Census Industry Classification System groups industries into 52 general industrial categories. More detailed information on ATUS can be found on the BLS website (https://www.bls.gov/tus).
ATUS occasionally includes additional questions alongside its core questions. In 2017 and 2018, ATUS added a question “On your job, do you usually work a daytime (defined as between six am and six pm) schedule or some other schedules?” This question was used in the study to assess percentage of workers who reported usually working non-daytime shifts by occupation and industry. In 2020, ATUS added a question asking whether respondents teleworked or worked from home for pay at any time during the previous 4 weeks due to the COVID-19 pandemic. This question was used by the study to assess percentage of workers who reported remote work due to the COVID-19 pandemic by occupation and industry.
The ATUS data contain weighed variables, such as TUFNWGTP, which was used to calculate national estimates of average working and sleeping hours in this study, as well as replicate weights (TUFNWGTP01-TUFFNWGTP160) for estimating standard errors. The ATUS User’s Guide provides detailed information on the weights, replicate weights, and methods for computing national estimates and standard errors (BLS, 2022b). Due to the impact of COVID-19, 2020 ATUS data were weighted differently and are not able to be combined with previous years to compute national estimates of average working and sleeping hours. In this study, 2011–2019 ATUS data were used for the estimates of average working and sleeping hours and 2020 ATUS data were used to compute the percentage of workers who reported remote work due to COVID-19 by occupation.
The study employed SAS 9.4 proc surveymeans (SAS Institute, 2022) for computing national estimates of average working and sleeping hours by occupation and industry, stratified by workdays and non-workdays. Workdays were defined by respondents reporting working hours on the diary day, while non-workdays were defined by the absence of reported working hours. Proc surveyfreq was utilized to compute the percentage of workers reporting non-daytime shifts and remote work by the general occupational or industrial categories. The analysis incorporated the 160 replicate weights provided by the BLS, using SAS’s Jackknife method for variance estimation. Linear regression was employed to examine the association between working hours and sleeping hours, with sleeping hours as the dependent variable and working hours, age, and sex as the independent variables. Unweighted data were used for the linear regression analysis.
Results
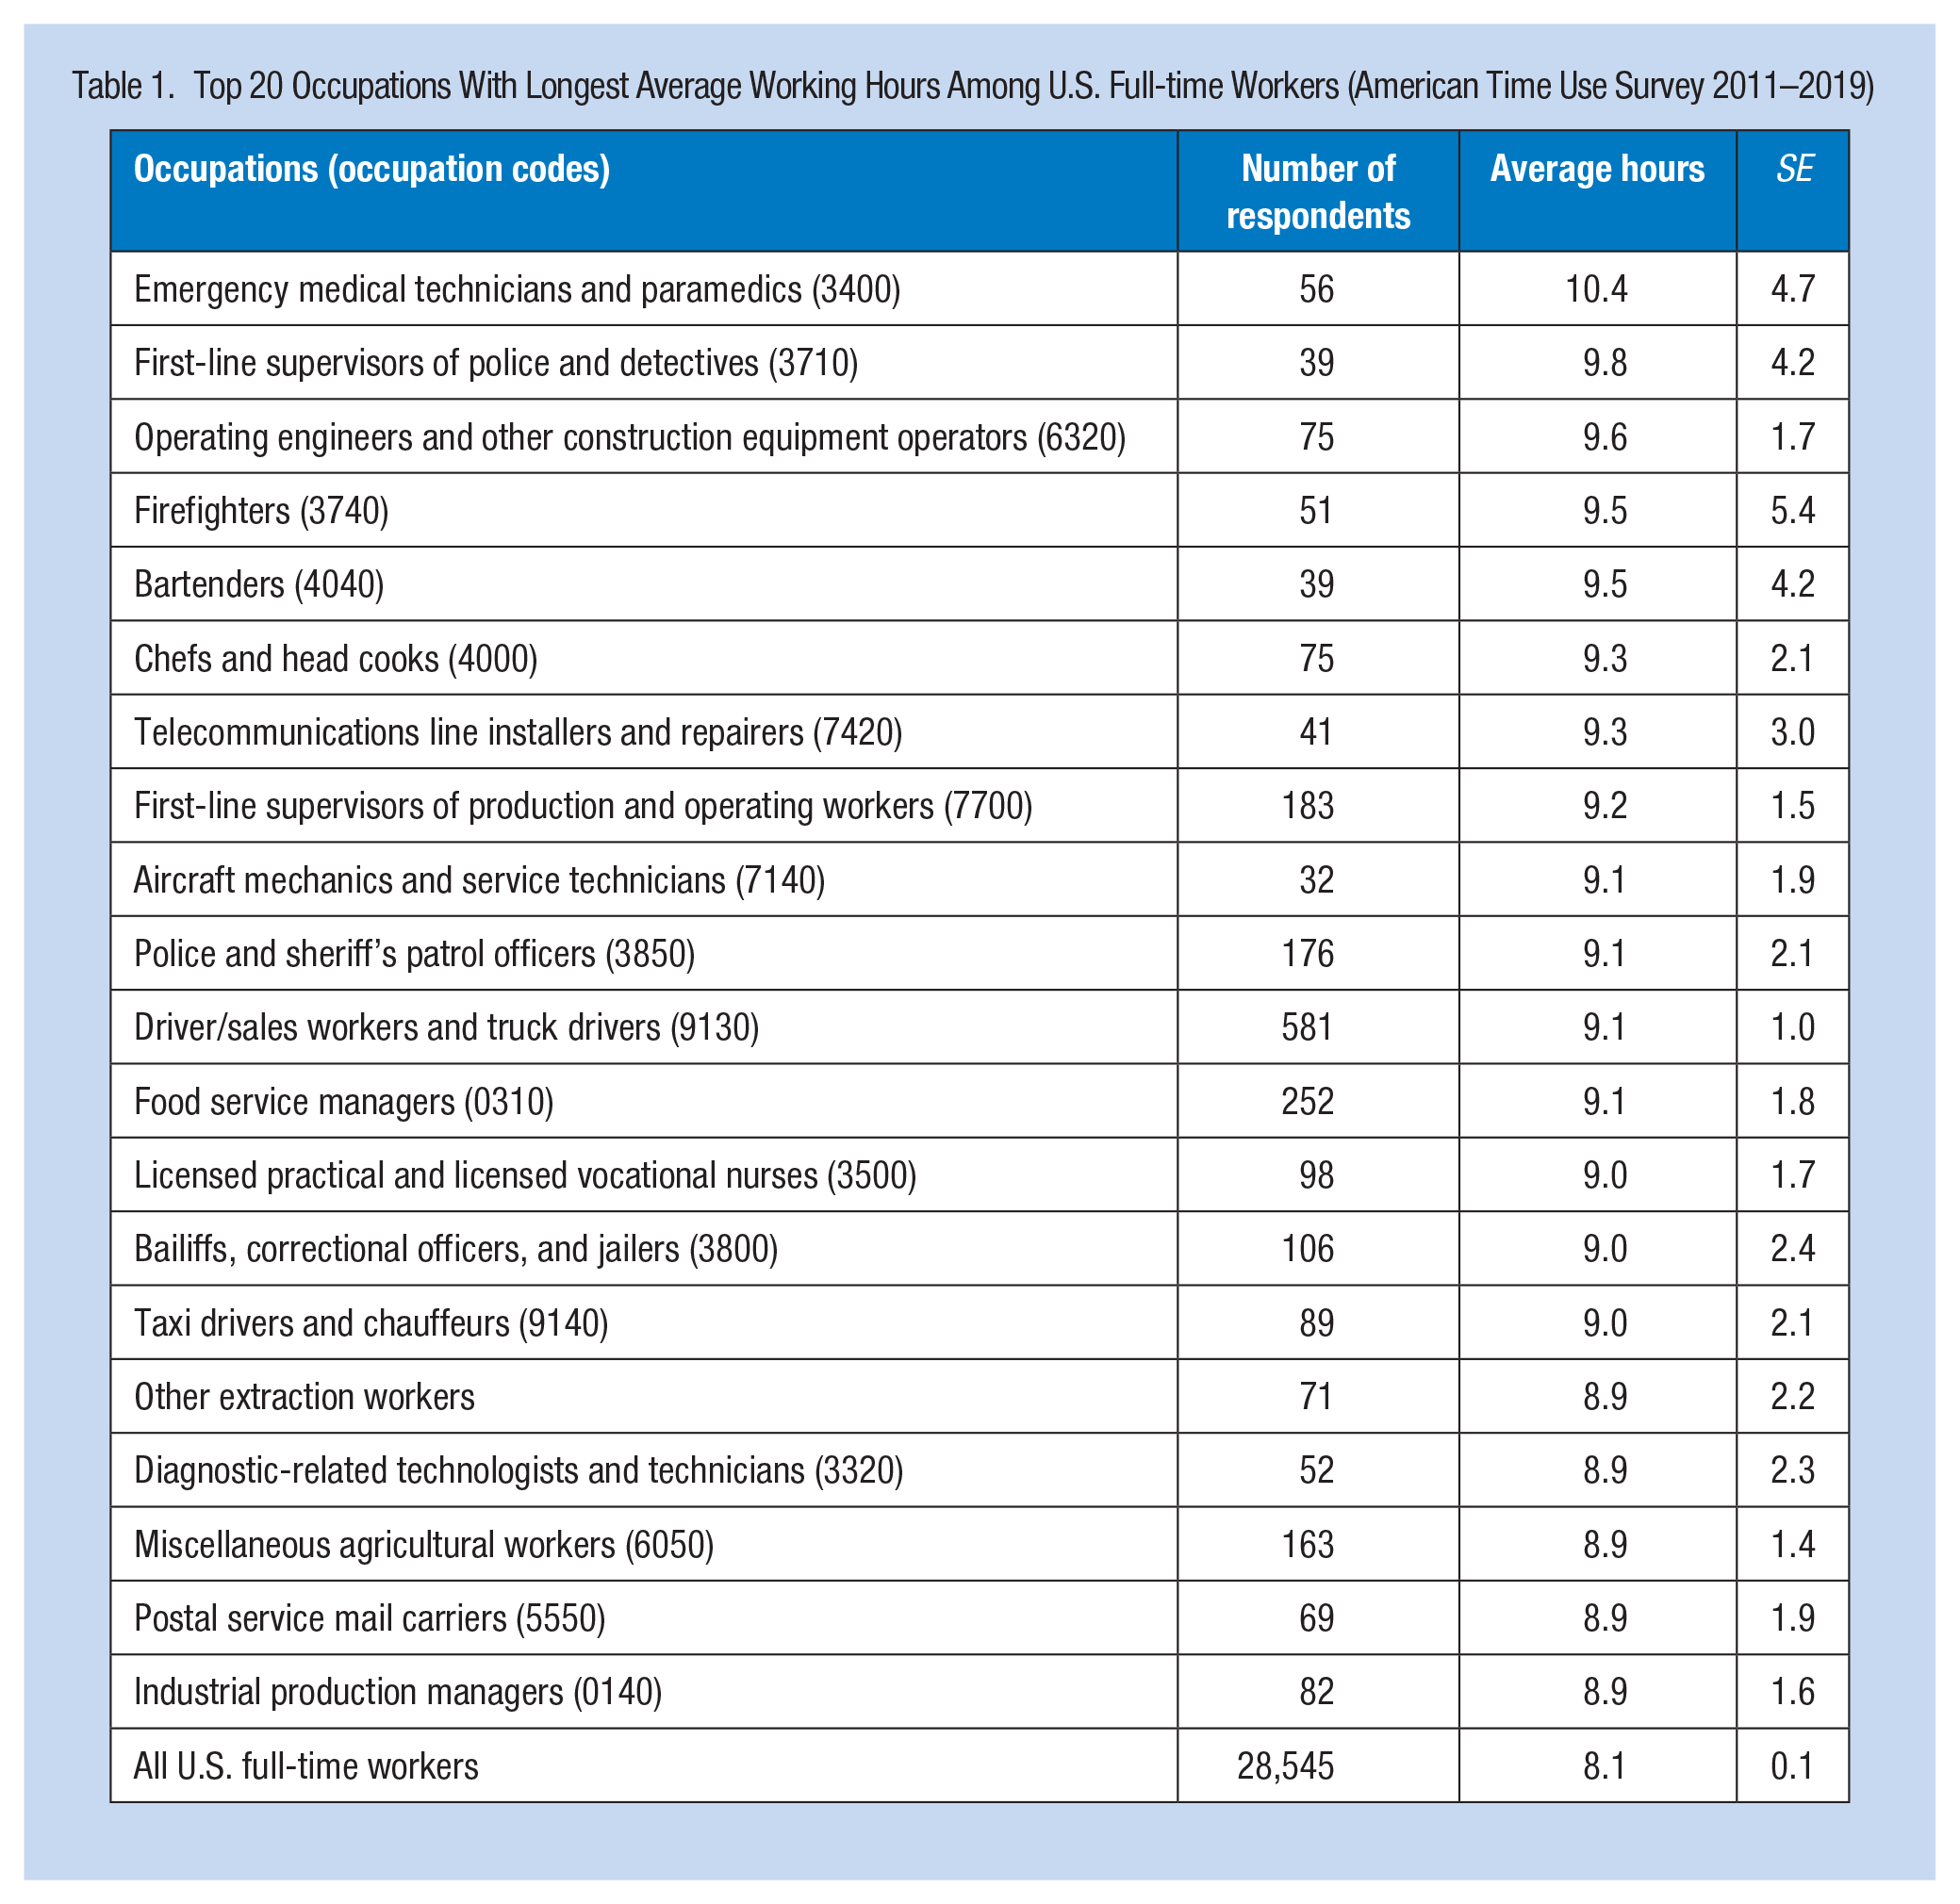
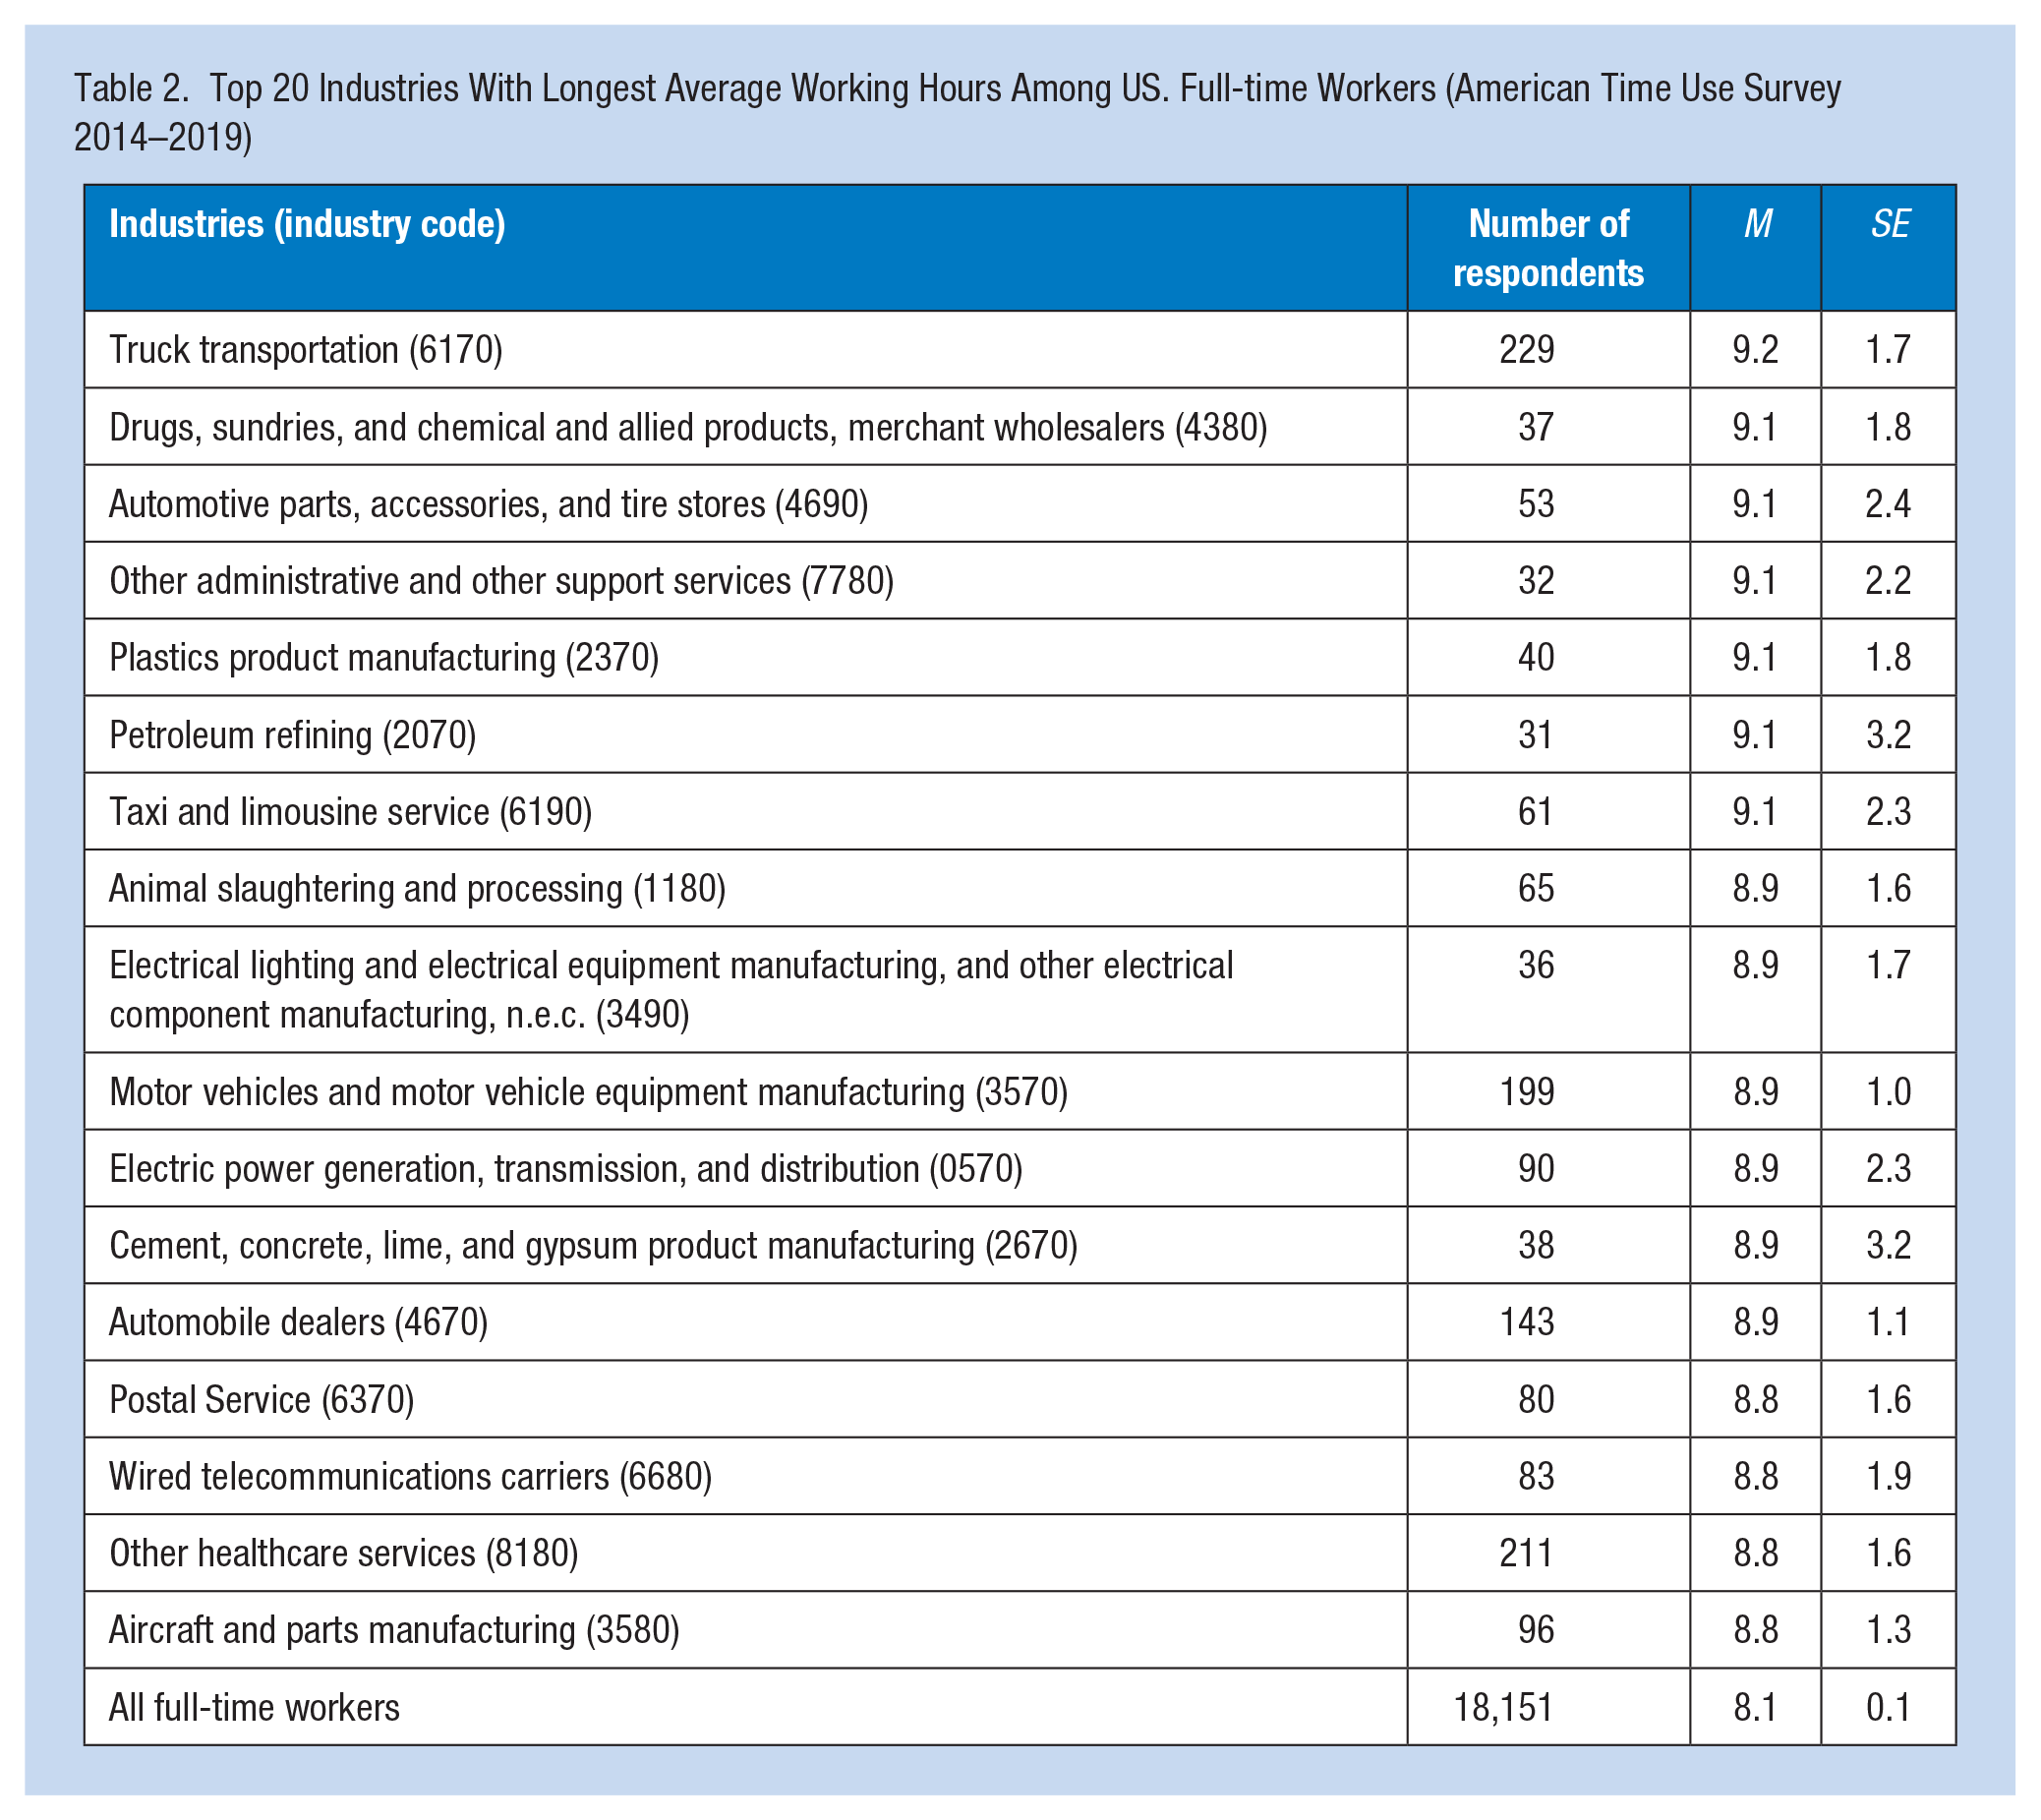
The average working hours reported by U.S. full-time workers during the years 2011–2019 was estimated to be 8.1 hours on a workday (Table 1). Working hours varied across different occupations and industries. Table 1 provides the top 20 occupations with the longest average working hours. Emergency medical technicians and paramedics had the longest average working hours (10.4 hours) among all occupations, followed by first-line supervisors of police and detectives (9.8 hours), operating engineers and other construction equipment operators (9.6 hours), and firefighters (9.5 hours). Table 2 presents the top 20 industries that had the longest estimated average working hours. Among all industries, truck transportation industry had the longest average working hours (9.2 hours).
Top 20 Occupations With Longest Average Working Hours Among U.S. Full-time Workers (American Time Use Survey 2011–2019)
Top 20 Industries With Longest Average Working Hours Among US. Full-time Workers (American Time Use Survey 2014–2019)
During the years 2017–2018, on average an estimated 13.8% of U.S. full-time workers reported usually working non-daytime shifts (Table 3). The percentage of workers who reported usually working non-daytime shift varied by general occupational and industrial categories. Protective service occupations had the largest percentage (41.7%) of workers reporting non-daytime shifts of all the general occupational categories, followed by personal care and service (36.2%) and transportation and material moving (31.9%). Among the general industrial categories, food services and drinking places had the largest percentage (28.6%) of workers reporting non-daytime shifts, followed by transportation and warehousing (28.0%), and hospitals (27.0%).
Percentage of Full-time Workers Who Reported Usually Working a Shift Other Than Daytime by Occupational and Industrial Category (American Time Use Survey 2017–2018)
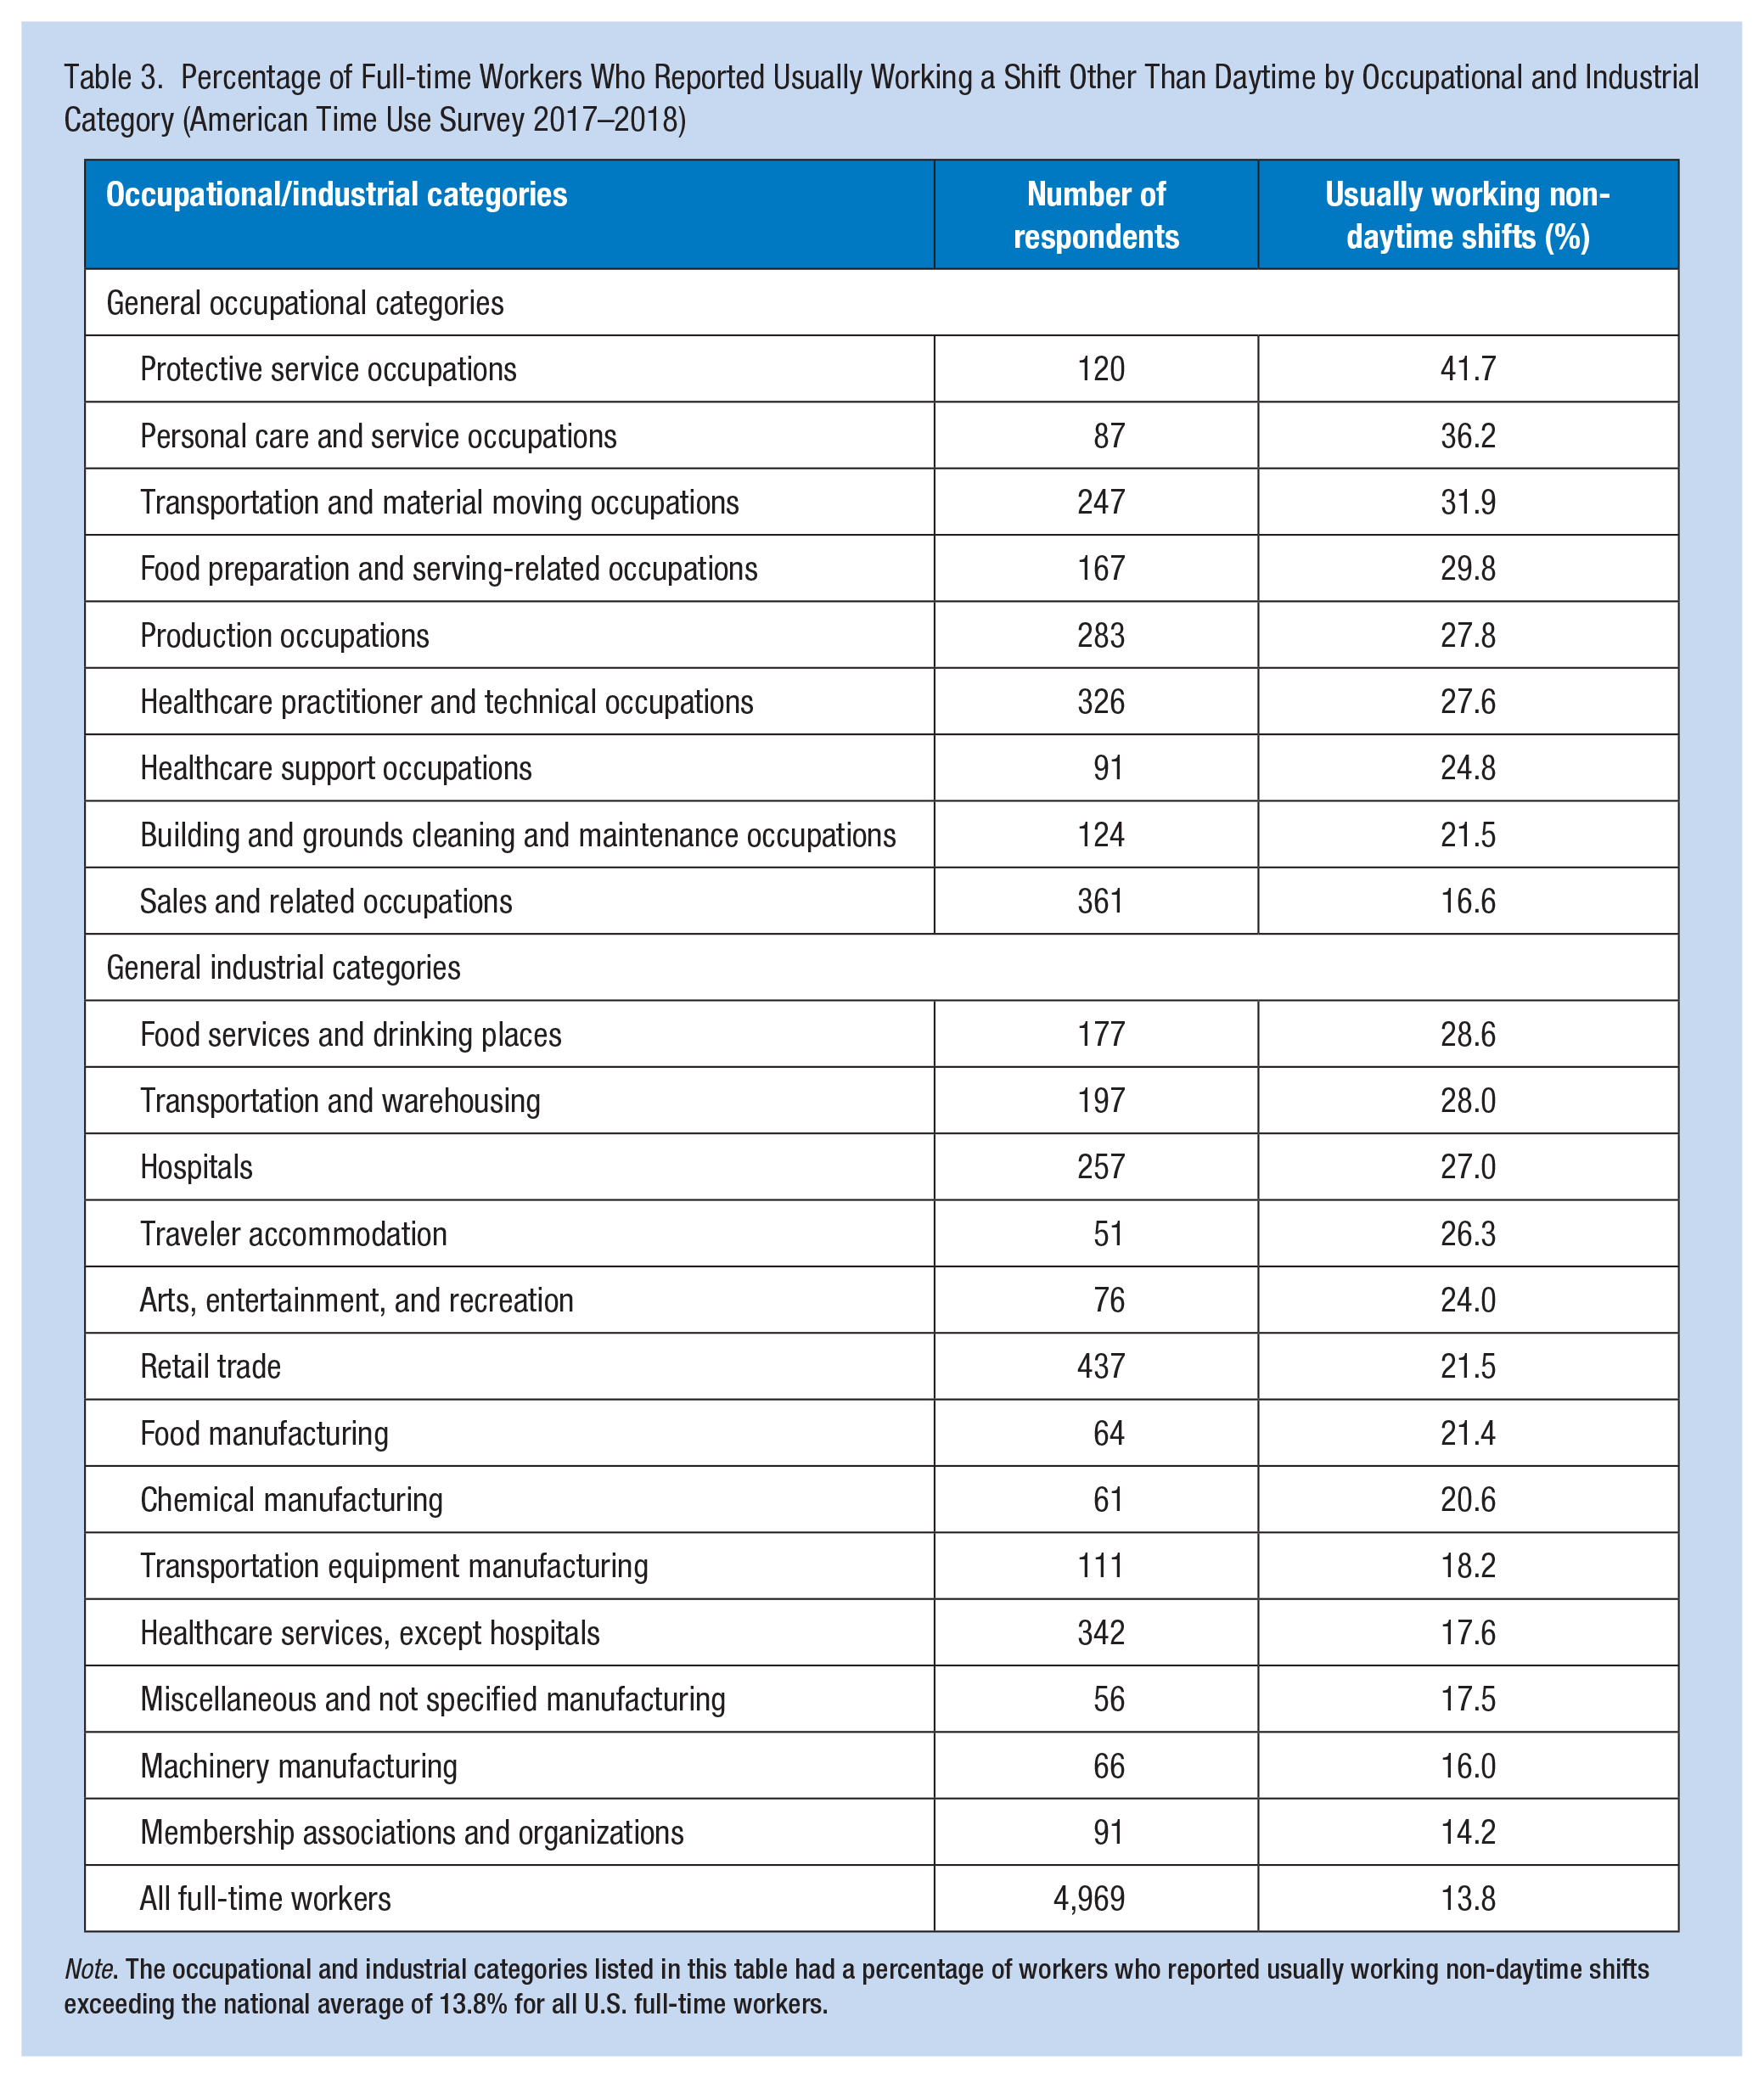
Note. The occupational and industrial categories listed in this table had a percentage of workers who reported usually working non-daytime shifts exceeding the national average of 13.8% for all U.S. full-time workers.
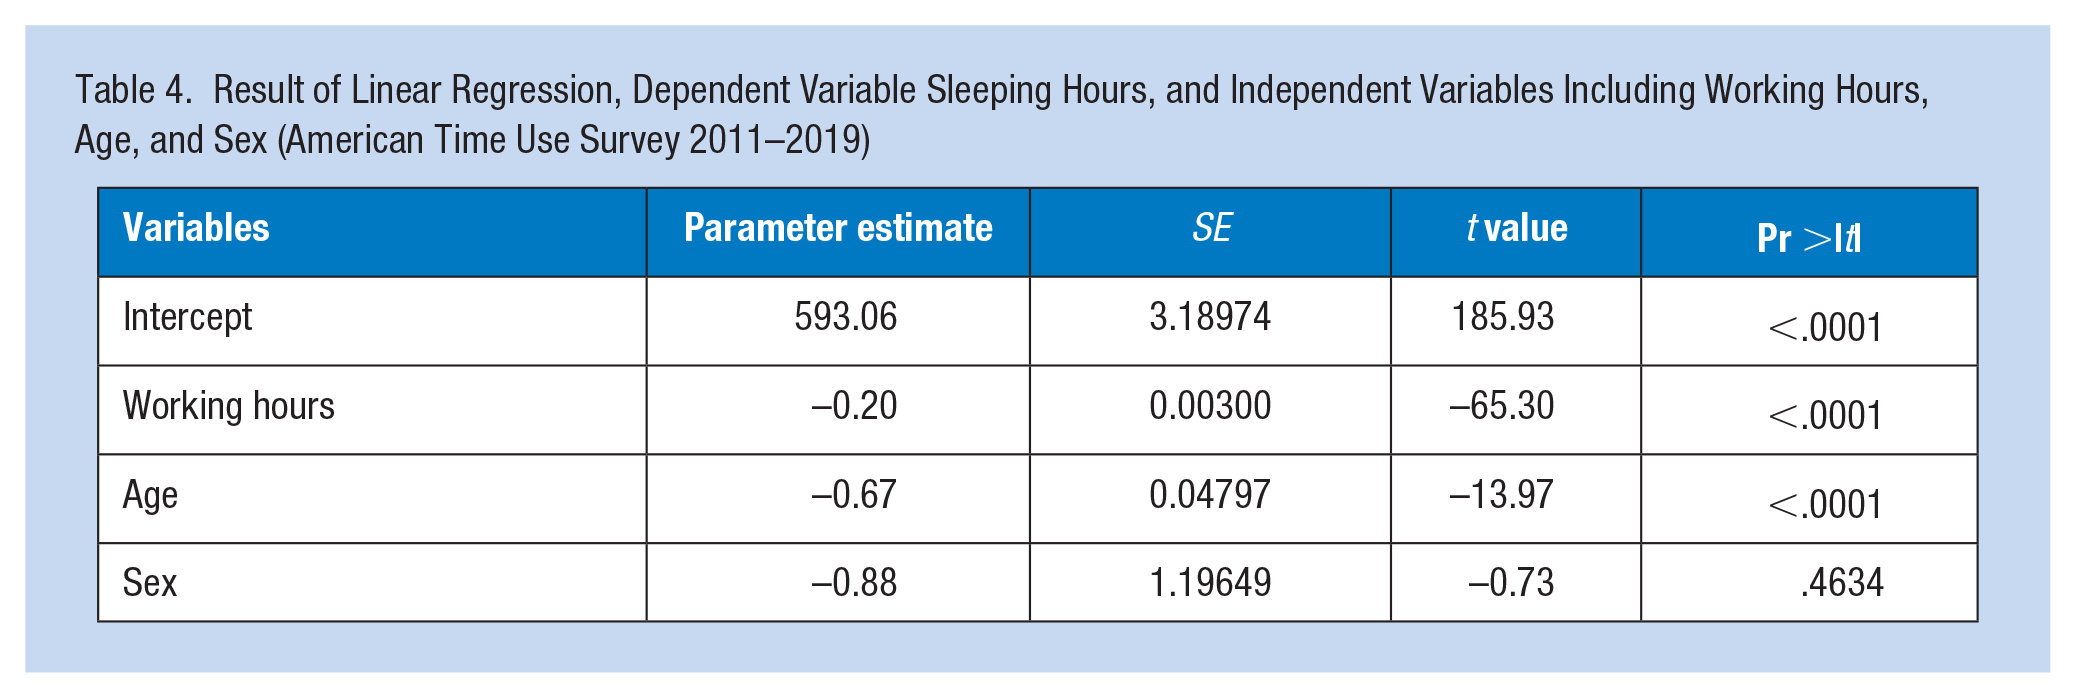
The estimated average sleeping hours for U.S. full-time workers during 2011–2019 were 7.9 hours on a workday and 9.3 hours on a non-workday. A linear regression analysis indicated that sleeping hours were negatively associated with working hours and workers’ age (Table 4).
Result of Linear Regression, Dependent Variable Sleeping Hours, and Independent Variables Including Working Hours, Age, and Sex (American Time Use Survey 2011–2019)
In 2020, an average of 34.0% of U.S. full-time workers reported remote work or work from home (WFH) due to the COVID-19 pandemic (Figure 1). Among the general occupational categories, business and financial operation occupations had the highest percentage (72.2%) of workers reporting remote work or WFH due to COVID-19, followed by computer and mathematical science occupations (60.5%). In contrast, only 1.6% of workers in protective service occupations and construction and extraction occupations reported remote work or WFH due to COVID-19.
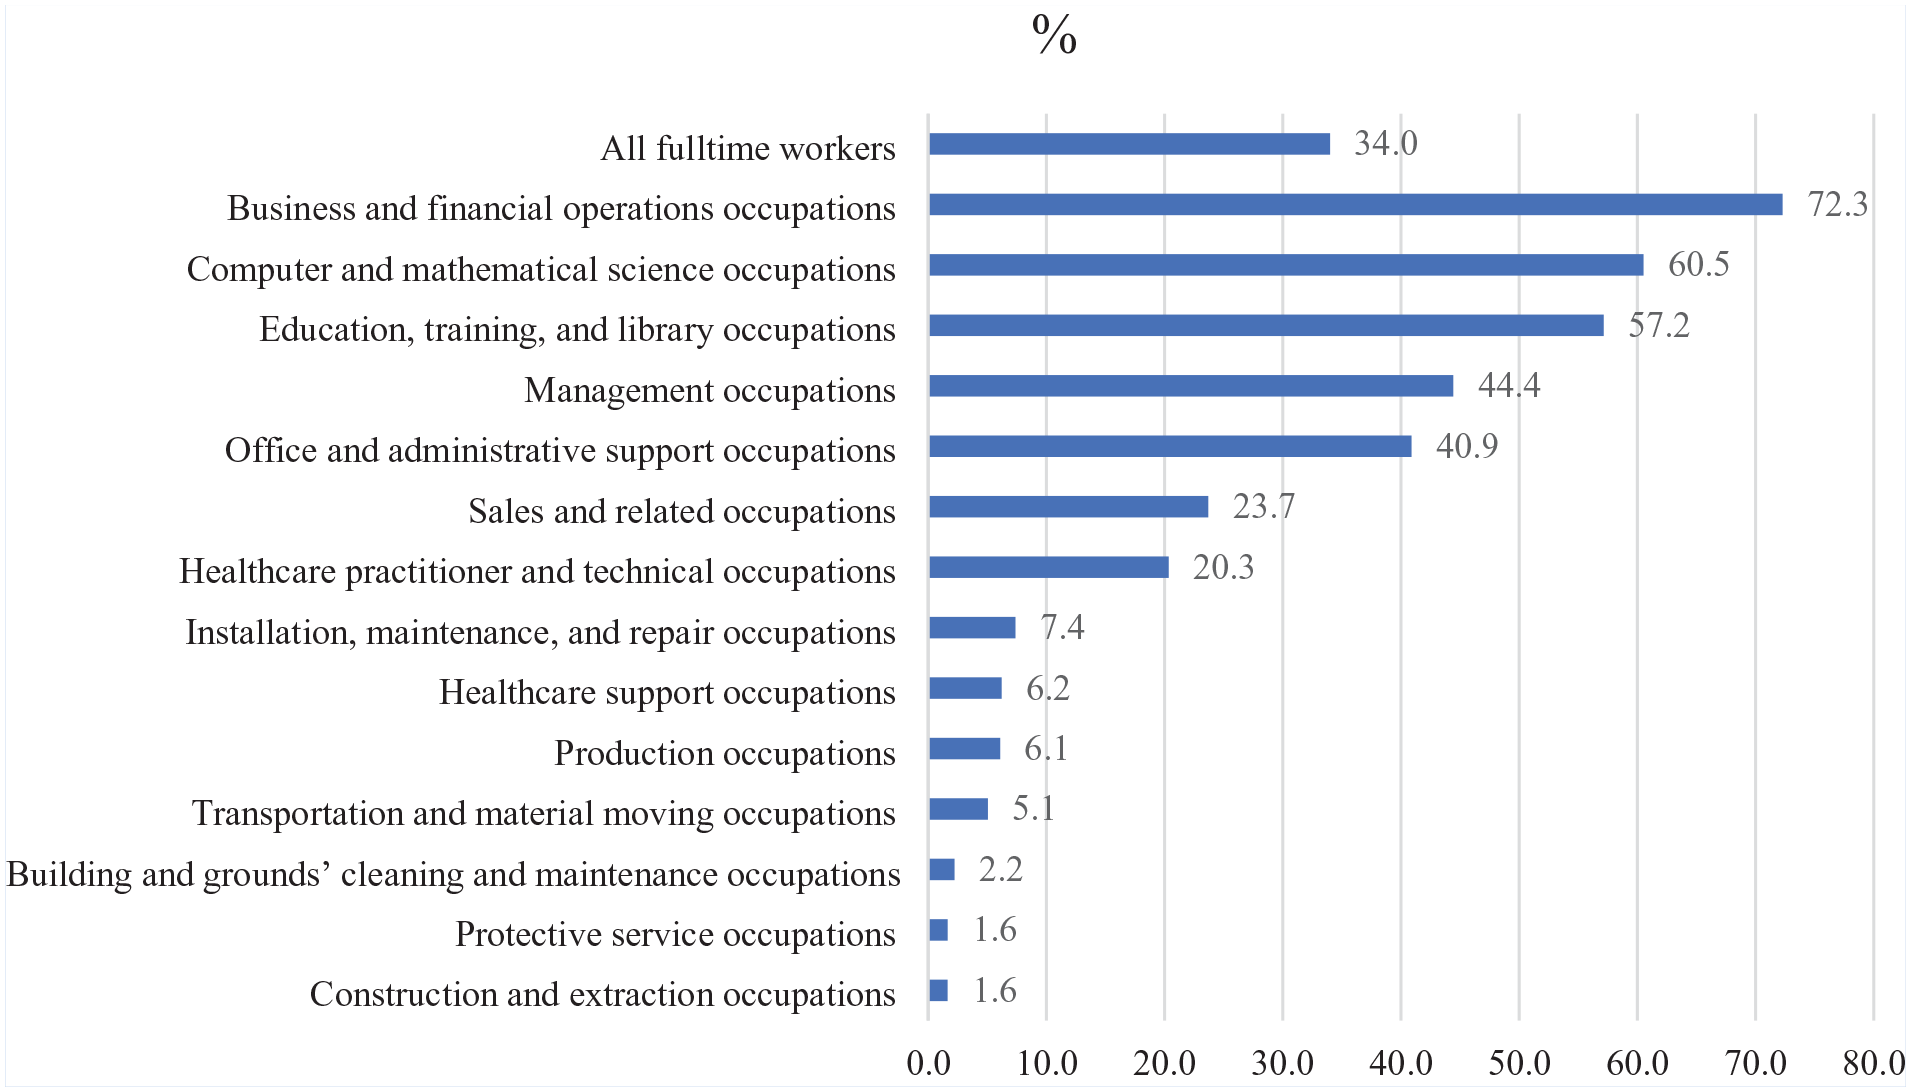
National Estimates of Percentage of Workers Who Reported Remote Working Due to COVID-19 by General Occupational Categories (American Time Use Survey 2020)
Discussion
The study findings identified occupations and industries characterized by extended working hours, alongside occupations of emergency medical technicians, first-line supervisors of police and detectives, and firefighters who are widely known for their long working hours, this research revealed lesser-known occupations like operating engineers and other construction equipment operators, bartenders, chefs and head cooks, and telecommunications line installers and repairers, all of whom work extended hours. In addition to the truck transportation industry that is well known for its long working hours, the research also brought to light lesser-known industries such as drugs, sundries, and chemical and allied products; merchant wholesalers, automotive parts, accessories, and tire stores; other administrative and other support services; and plastics product manufacturing where employees reported working long hours. The identification of these lesser-known or less-studied occupations and industries contributes significantly to our current knowledge of occupations and industries marked by prolonged working hours.
Consistent with the previous studies (Afonso et al., 2017; Basner et al., 2007, 2014), this study found a negative association between working and sleeping hours. Workers with longer working hours tended to have fewer sleeping hours. Unlike the previous studies (Basner et al., 2007, 2014), that categorized sleep duration as long and short sleepers, this study used continuous variables for both working and sleeping hours, while the earlier studies stratified their analyses by weekdays and weekend. Given that certain worker populations operate on weekends while others may have weekdays off, this analysis appropriately stratifies the data into workdays and non-workdays to account for potential variations in activity patterns and behaviors across different days of the week. Furthermore, while the earlier studies (Basner et al., 2007, 2014), encompassed the entire U.S. population (age 15 years and older, included workers and non-workers, part-time and full-time workers), this study focused exclusively on full-time workers. This study contributes additional dimensions to our understanding of the relationship between working and sleeping hours.
Results of this study suggested that on average 13.8% of U.S. full-time workers reported usually working non-daytime shifts during 2017–2018. The National Health Interview Survey (NHIS) Occupational Health Supplements in 2010 and 2015 also collected data on shift work and suggested that 7.4% of workers reported frequent night work (defined as 1 a.m. to 6 a.m.) and 26.6% reported shift work (defined as any alternative shift) (NIOSH, 2020b). There are two differences in the shift work estimates between ATUS and the NHIS occupational health supplement data: (1) the questions are not the same in the two surveys, ATUS question was daytime schedule (6 a.m. to 6 p.m.) versus some other schedules, while NHIS question was night work (defined as 1 a.m. to 6 a.m.) and (2) the population for this study were full-time workers while the respondents for the NHIS occupational health supplement questions were all adults currently employed (full-time and part-time workers).
Shift work can have a considerable impact on worker safety and health (Choi et al., 2014; Institute of Occupational Safety and Health, 2022; McHugh et al., 2020, 2021; NIOSH, 2020a). The study results identified occupations and industries where a substantial number of workers reported non-daytime shifts. Occupations like firefighters, protective service, and transportation and material moving not only had a large percentage of workers on non-daytime shifts but also had prolonged working hours. The findings from this study highlight the urgency of periodizing research and prevention efforts to mitigate the health and safety impacts associated with prolonged working hours and shift work within these specific occupations.
The COVID-19 pandemic led to a significant increase in WFH (BLS, 2022a, 2022c; Ng et al., 2021). Results of this study suggested that prevalence of WFH varied across occupations and industries. Business and financial operation occupations had the largest percentage (72.3%) of workers reporting remote work, while protective service and construction occupations had much lower rates (1.6%). WFH blurred the boundary of work and personal life and has disrupted people’s way of life. WFH can be beneficial or detrimental to workers’ health. Studies (Niebuhr et al., 2022; Xiao et al., 2021) suggested that WFH changed workers’ lifestyle, such as physical activity, eating habits, and social aspects of WFH including who is living in the home, distractions while working, and communication with co-workers. The physical aspects of the home workspace can also have implications on workers’ safety and health. In addition, WFH can also have unintended implications to workers’ family members. With WFH likely to play a prominent role in the future for workers in the United States, research is needed to investigate which aspects of WFH may be beneficial or detrimental to the health and safety of workers to support the design of “best practices” to provide a positive WFH experience and to optimize the benefits of WFH on workers’ health and safety.
There are limitations in using ATUS to assess working hours. First, ATUS collects only a 1-day diary spanning from 4 a.m. to 4 a.m. This timeframe may not fully capture the working hours for occupations that extend beyond these limits. For instance, occupations like firefighters often work in shifts such as 24–48, where they work for 24 hours and then have 48 hours off (Choi et al., 2014; Raiford, 2024). In such case, ATUS might only record a fraction of their actual working hours. If a firefighter works from 10 a.m. to 10 a.m. the next day, ATUS would either capture 16 hours (from 10 a.m. to 4 a.m. the following day) or 6 hours (from 4 a.m. to 10 a.m. the same day), leading to underestimation of their working hours and potentially large standard error in the estimated mean. Consequently, interpreting ATUS estimates for average working hours for occupations like firefighters, emergency medical technicians and paramedics, and first-line supervisors of police and detectives should be approached with caution.
Another limitation is the potential bias in ATUS data collection against occupations that are challenging to reach or are more likely to refuse survey participation, such as long-haul truck drivers who spend extended periods working and sleeping on the road. These individuals can be difficult to reach and survey.
Despite these limitations, ATUS is a population-based nationally representative sample, making it a unique source for comparing working and sleeping hours across various occupations and industries. American Time Use Survey collects data on diverse activities, including work, socializing, commuting, eating, drinking, sleeping, sports, exercise, recreation, and education. Examination of how workers allocate their time among these activities contributes to a richer understanding and more meaningful evaluation of the impact of work organization on worker safety and wellbeing. For example, comparing time allocation between workers who WFH and workers who work on-site can provide valuable insight into the effects of WFH. Moreover, ATUS data are collected on an ongoing basis, allowing for the study of changes in time allocation patterns over different time intervals. For example, examining shifts in working and sleeping hours among commercial truck drivers before and after the implementation of revised Hours-of-Service regulations offers valuable insights into the impact of these regulations.
Implications for Occupational Health Practice
The study’s findings provide important benchmarks for understanding working hours and work schedules across various occupations and industries. These results hold significant relevance for the daily practice of occupational health practitioners, enabling them to pinpoint worker groups exposed to prolonged working hours and shift work. A deep understanding of workers’ exposures empowers occupational health practitioners to gain better insight to the underlying causes of workers’ health conditions. Armed with this knowledge, occupational health practitioners can proactively advocate for and implement effective prevention measures, such as fatigue management programs, to mitigate potential health effects associated with extended work hours and shift work.
Applying Research to Occupational Health Practice
In summary: This study analyzed data from American Time Use Survey. Its findings offer important benchmarks for comparing working hours and work schedules across various occupations and industries. These results can serve as invaluable tool in identifying worker groups at higher risk for health and safety issues due to extended work hours and shift work. Armed with this understanding, occupational health nurses can proactively advocate for and implement effective fatigue management programs to address these concerns.
Footnotes
Author’s Note
This study used American Time Used Survey (ATUS) 2011–2020 data. The ATUS data are public available and can be freely downloaded from the U.S. Bureau of Labor Statistics (BLS) website, specifically, from ATUS home: U.S. Bureau of Labor Statistics (bls.gov). The utilization or analysis of the ATUS data does not necessitate Institutional Review Board (IRB) review. It is exempt from such review requirements.
Conflict of Interest
The author(s) declared no potential conflicts of interest with respect to the research, authorship, and/or publication of this article.
Funding
The author(s) received no financial support for the research, authorship, and/or publication of this article.