
Abstract
Anthropogenic carbon emissions and air pollutant emissions often share common sources. Designed to mitigate carbon emissions, an emission trading scheme (ETS) may also reduce air pollutant emissions, thereby generating health co-benefits from improved air quality. Nevertheless, such health co-benefits are often overlooked in ETS evaluations. This paper aims to bridge this research gap by quantifying the health co-benefits of the ETS resulting from the reduction of PM2.5 and O3 pollutions in China over the period from 2025 to 2060, using a Computable General Equilibrium (CGE) model. The model results indicate that both PM2.5 and O3 pollutions negatively impact labor input and thus economic output, with the impact of PM2.5 pollution more pronounced than that of O3 pollution. The ETS slightly alleviates the negative economic consequences of air pollution. Although the ETS incurs abatement costs, leading to a short-term reduction in GDP, this negative effect is relieved in the long term. Considering the health co-benefits derived from reduced air pollution, the negative economic consequences of the ETS are lessened, even though these co-benefits cannot fully offset the abatement costs.
Introduction
In the face of global warming, there is an urgent need to mitigate carbon emissions to slow down the pace of temperature rise. Regrettably, policymakers are often reluctant to set ambitious mitigation targets; these reluctances stem from their concerns about the costs of mitigation, while they overlook the potential benefits of emission mitigation. In the realm of policy benefits, health co-benefits are substantial and have the potential to offset a significant portion of the costs associated with mitigation efforts (Kim et al., 2020). Given that carbon emissions and air pollutant emissions often share the same sources (Workman et al., 2019), mitigating carbon emissions is beneficial to lowering air pollutant emissions, thereby generating health co-benefits from the reduction of air pollution. The magnitude of health co-benefits is enormous and may be comparable in scale to climate benefits during emission mitigation (Chen & Wang, 2022).
Despite strong scientific evidence demonstrating the existence of health co-benefits in climate change mitigation (Karlsson et al., 2020), health co-benefits are often given insufficient attention in policy evaluations. For instance, Dong et al. (2017) argued that the Chinese carbon tax would result in GDP losses without considering the health co-benefits of the tax. The underestimation of health co-benefits is mainly due to the nature of clean air. The non-rivalrous and non-excludable characteristics of clean air create challenges in measurement, rendering difficulties in the internalization of health co-benefits from improved air quality.
Some previous researchers measured the health co-benefits of vague mitigation policies. For example, Wang, Xie, et al. (2022) quantified the ozone-related co-benefits of a stringent Chinese mitigation policy aimed at keeping global warming below 2°C, finding that the avoided ozone-related mortality could save $3 billion and $10 billion in 2030 and 2050, respectively. Xie et al. (2018) calculated the health co-benefits of the emission mitigation under the 2°C goal, concluding that the generated co-benefit would be approximately $2.8 trillion in Asia. Although these researchers provided thought-provoking findings, the mitigation policies they considered were rather ambiguous and lacked specific policy details. In practice, a single policy is rarely sufficient to achieve mitigation targets, which are typically achieved through a combination of policies; therefore, it is more meaningful to investigate the health co-benefits of specific policies rather than broad and undefined ones. In addition, the simulated policies in Wang, Xie, et al. (2022) and Xie et al. (2018) were assumed to be implemented under ideal conditions. Following the US withdrawal from the Paris Agreement, the 2°C warming target may not be easily attainable. Hence, it is worthwhile to explore the health co-benefits of a real climate policy with the detailed contents.
Being one of the most widely implemented climate policies globally, emission trading scheme (ETS) may generate considerable health co-benefits from the reduced toxic air pollutants (Basaglia et al., 2024). Regrettably, few prior studies have incorporated health co-benefits into ETS evaluations. Motivated by a paucity of previous research on assessing ETS’s health co-benefits, we attempt to enrich the literature by unveiling how ETS contributes to the reduction of air pollution in monetary values. The main objective of this paper is to analyze the health co-benefits of the ETS from the reduction of fine particulate matter (PM2.5) and tropospheric ozone (O3). PM2.5 is a concerning air pollutant, as it is linked to an increased risk of all-cause mortality (Pope et al., 2020) and premature deaths from various endpoints (Apte et al., 2015). O3 is another harmful pollutant, as it causes significant harm to the human body at high exposure levels (Fan et al., 2021).
This article makes several important contributions to the existing literature. Firstly, we have endogenized the health co-benefits in the ETS research framework, thereby reducing biases in ETS evaluations. By incorporating health co-benefits that may partially offset policy implementation costs, we enhance the appeal of ETS to policymakers. Secondly, we have meticulously detailed the health co-benefits associated with the reductions in PM2.5-related and O3-related morbidity and mortality during ETS implementation. By calculating the magnitudes of these co-benefits, we have elucidated the roles that health co-benefits play in shaping the socioeconomic effects of ETS. Lastly, we have provided a paradigm for other researchers to study the health co-benefits of ETS in other regions. This paradigm is expected to have a broad applicability, given that ETS is a popular climate policy, and air pollution is a global issue.
China is chosen as the research area for two reasons: Firstly, as the largest emitter of greenhouse gases globally, the country has implemented the Chinese National ETS (CNETS), which has become the largest carbon market in the world (Ren et al., 2024). Nevertheless, the health co-benefits of the CNETS need to be explored. Secondly, with the dense population and high proportion of coal in the energy consumption, China is one of the most polluted countries globally (Li et al., 2019). Particularly, air-pollution-related mortality ranks among the top causes of death in China (Lelieveld et al., 2015).
The remainder of this article is organized as follows: The literature review section provides an overview of prior findings and specifies the research gap. The method section outlines the model structure, the quantification method for health co-benefits, and the scenarios that have been designed. The result section presents the primary outcomes of the model employed in this paper, with tables and figures utilized for clarification. In the discussion section, we compare our main findings with the relevant literature and identify limitations that could be addressed in future research. Finally, the conclusion and policy implication section summarizes the key points of this paper and offers insights for policy formulation.
Literature Review
The Porter hypothesis posits that well-designed environmental regulations can spur innovation and boost productivity (Rassier & Earnhart, 2015). As an environmental regulation, ETS contributes to the improvement of green total factor productivity, and thus it is a valuable tool for promoting green growth (Hui & Choi, 2024). In the context of health co-benefits, the Porter hypothesis holds, as the health co-benefits derived from ETS can improve labor health and thus enhance labor productivity.
As a concerning air pollutant, PM2.5 poses substantial health risks. Exposure to PM2.5 pollution may lead to lung and respiratory diseases, increase plaque formation in blood vessels, affect autonomous nervous systems, and trigger premature deaths (Chen & Wang, 2022). Numerous previous studies have already proved the existence of PM2.5-related health co-benefits in ETS implementations. For instance, Chen and Wang (2022) found that the ETS would effectively abate PM2.5-related labor loss and thus increase labor input for economic output; in the long term, the ETS would generate more health co-benefits from the reduction of PM2.5 pollution than the carbon tax. Zheng and Dong (2025) also found that the pilot ETS implemented in China significantly reduced PM2.5 concentrations, thereby posing beneficial influences on air quality.
O 3 is another concerning air pollutant, as exposures to tropospheric ozone are linked to both short-term and long-term respiratory and cardiovascular diseases (Malashock et al., 2022). The O3-related health co-benefits of ETS were relatively underexplored in the literature, but many previous studies confirmed the O3-related co-benefits of climate change mitigation. For example, Wang, Xia, et al. (2022) showed that implementing stringent mitigation policies could prevent approximately 15,800 and 35,550 O3-related premature deaths globally in 2030 and 2050, with 78% and 76% of these avoided deaths occurring in China. Weng et al. (2023) found that reducing O3 precursor emissions through climate policies would significantly alter surface O3 pollution in China.
Some studies simultaneously examined PM2.5-related and O3-related health co-benefits of climate change mitigation. Xie et al. (2019) empirically found that the stringent mitigation measure in China could reduce PM2.5 and O3 concentrations by around 75% and 20% in 2030; therefore, the health co-benefits primarily stem from the reduction of PM2.5 concentrations. This finding is consistent with the previous research indicating that PM2.5 contributes more to premature deaths than O3 (Lelieveld et al., 2015). Although PM2.5 reduction is the primary source of health co-benefits, O3-related co-benefits cannot be overlooked in policy evaluations. This is because after excluding the impact of PM2.5 pollution, O3 concentrations were statistically significantly associated with circulatory and respiratory mortality (Turner et al., 2016).
The health co-benefits of ETS are confirmed in the ex-post analysis by Basaglia et al. (2024), who utilized the national inventories of air pollutant emissions in EU countries. Basaglia et al. (2024) empirically found that the sizable reduction of air pollution by the EU ETS has translated into large health co-benefits. Unfortunately, almost no previous researchers have performed ex-post analyses to unveil health co-benefits associated with the CNETS conspicuously. Starting in 2021, the CNETS was implemented for a short period; with limited documented data, researchers are unable to perform ex-post analyses on the health co-benefits of the CNETS. By overcoming the issues of data unavailability, ex-ante analyses are useful to estimate health co-benefits as they prospectively inform policymakers of potential ETS contributions (Qiu et al., 2020). We aim to perform an ex-ante analysis to measure the health co-benefits of the ETS designed to simulate the CNETS. This forward-looking measurement uncovers the potential role of ETS in reducing air-pollution-related economic loss, which implies the significance of endogenizing ancillary benefits in ETS modeling.
In this article’s ex-ante analysis, a computable general equilibrium (CGE) model is adopted to simulate the operation of the Chinese economic system, considering the negative influence of air pollution. In the CGE framework, air pollutant emissions are assumed to change proportionally to carbon emissions, considering that these two emissions often have the same anthropogenic sources (Workman et al., 2019). More accurate measurements of the relationship between air quality and emission mitigation could be provided by atmospheric chemistry models. Clayton et al. (2024) employed a European atmospheric chemistry model to calculate the health co-benefits of a low-carbon future in the shared socioeconomic pathway (SSP) scenarios. Nevertheless, the emission mitigation outlined in the SSP scenarios may not be easily achieved, considering recent climate inaction globally. The US withdrawal from the Paris Agreement decreases the possibility of achieving warming targets as it increases the cost of emission abatement in the rest of the world (Chen et al., 2018). Owing to the uncertainties in global climate action, it is more meaningful to study regional ETS absent from global mitigation efforts.
Method
Economic activities are accompanied by carbon emissions and air pollutant emissions; these negative externalities cannot be regulated by the market mechanism and thus cause market failures. By internalizing the social costs of carbon emissions and air pollutant emissions, governmental policies are essential to address the externality issue. Particularly, as a popular and effective climate policy, ETS abates carbon emissions by increasing the cost of nonrenewable energy consumption. Sourced from fossil energy exploitation, air pollutant emissions are indirectly curbed by ETS, which generates health co-benefits from improved air quality. As positive externalities, health co-benefits are difficult to measure and thus usually overlooked in previous ETS evaluations. Neglecting health co-benefits induces the underestimation of ETS benefits, which causes biased policy evaluations.
This paper attempts to quantify the health co-benefits of the designed ETS from decreasing air pollution. Air pollution causes morbidity and mortality, thereby adversely impacting labor input and thus economic output. Deriving from the reduction of air-pollution-related economic loss, health co-benefits are measured in the ex-ante research framework. Owing to its capability of tracing economy-wide impacts of policy shocks, the CGE model facilitates the quantification of health co-benefits as it captures the economic changes caused by the ETS-induced reduction of air-pollution-related morbidity and mortality. In the result section, health co-benefits are presented as the differences in the economic indices between the CGE-simulated scenarios with and without the ETS implementation.
Figure 1 presents the content of this article’s research framework. Labor is an essential input factor of economic output. Given that economic growth requires energy combustion, it is inevitably accompanied by carbon emissions and air pollutant emissions. As these two emissions are often from the same sources (Workman et al., 2019), air pollutant emissions are assumed to be proportional to carbon emissions. This assumption also holds in unexpected events, like the COVID-19 lockdown, which synergistically reduced greenhouse gas emissions and air pollutant emissions (Zhang et al., 2021). Nevertheless, this assumption ignores the complicated and nonlinear interactions between air quality and climate change mitigation policies (Clayton et al., 2024). To accurately quantify the interactions, researchers may run atmospheric chemistry models; however, such models are not compatible with the CGE research framework.

Research framework.
In this article, the considered air pollutants are PM2.5 and O3. Air pollutant emissions are the main causes of air pollution, which induces morbidity and mortality, as detailed in sections “PM2.5-Related Morbidity and Mortality” and “O3-Related Morbidity and Mortality.” Air-pollution-related morbidity and mortality reduce laborers’ work time, thereby decreasing labor input; in other words, work time mediates the relationship between air pollution and labor input. In Figure 1, we have established a balancing loop: Increasing labor input induces higher economic output, which is accompanied by rising air pollutant emissions and thus air pollution; air pollution reduces laborers’ work time, thereby negatively impacting labor input and thus economic output. By causing morbidity, air pollution incurs health expenditure and thus crowds out household consumption on other items; it eventually impacts economic growth since consumption is one of the main contributors to GDP growth.
The ETS plays a significant role in abating carbon emissions and thus curbing fossil energy combustion, which leads to the reduction of air pollutant emissions and thus generates health co-benefits from decreased air pollution. The ETS may negatively affect economic output because it discourages the exploitation of nonrenewable energy and thus interrupts the market mechanism in resource allocation. Nevertheless, the ETS may also boost economic growth since it promotes green innovation and industrial upgrading.
CGE Model
Stemming from the general equilibrium theory of Walras, CGE models endogenize all the relevant variables in a series of equations and thus fully capture the effects of policy shocks. Unlike partial equilibrium models, CGE models have the abilities to trace the economy-wide effects that involve inter-sector interactions (Cao et al., 2021). These abilities are particularly useful in the context of assessing ETS since carbon pricing directly affects the major energy sectors, which are upstream suppliers of energy inputs, leading to sizeable effects on the downstream energy end-use sectors (Cao et al., 2021).
In this article, a dynamic recursive CGE model is employed to study the health co-benefits of ETS. This is because static CGE models can only quantify the interrelations between macro variables in the short term (usually 1 year), but they cannot measure the macroeconomic effects of governmental policies, which usually last for more than 1 year (Bhattarai et al., 2018). Capturing the cumulative characteristics of economic activities, dynamic recursive CGE models can be employed to study the long-term effects of governmental policies (Chi et al., 2014). Particularly, such CGE models are capable of quantifying health co-benefits since the adverse consequences of air pollution, like cardiovascular diseases, are associated with long-term exposures to ambient air pollution (Hu et al., 2024).
This article’s CGE model is named the China Energy, Economy, and Demography (CEED) 2.0 model, following our previous work (Chen et al., 2025). This model covers the period from 2025 to 2060. This model’s social accounting matrix (SAM), as detailed in Table S1 in the Supplemental materials, is constructed based on the China Input-Output (IO) Table 2020.
This article’s sectoral division is presented in Table S2 in the Supplemental materials. Although the original China IO Table 2020 comprises 153 sectors, the Chinese economy in this article is represented by 29 sectors following the sectoral aggregation and disaggregation process. Notably, the electricity sector is disaggregated into one transmission-distribution subsector and eight generation subsectors, using the method outlined in Chen (2022). This disaggregation aims to distinguish the generation subsectors that rely on renewable energy from those that exploit fossil fuels. Given their minimal anthropogenic emissions, the renewable-based subsectors should not be constrained but rather encouraged by ETS. As shown in Table S1, the 29 sectors are categorized into one primary sector (agriculture), 26 secondary sectors, and two tertiary sectors (transport and service). Despite providing transport services, the transport sector is separated from the service sector since traffic flow is one of the major sources of emissions.
The CEED 2.0 model quantifies the relationships among the economic entities and their connections to the environment in the following blocks: the production, income-expenditure, trade, ETS-environment, and dynamic blocks.
The production block centers on the commodity production, assuming that each sector produces a single type of commodity. A Leontief function is employed to model the primary production relationship between intermediate input and added value. Other production relationships are quantified using the constant elasticity of substitution (CES) functions, as detailed in Chen (2024). The CES elasticity parameters are derived from Chen (2022), who validated their robustness. How the given values of the CES elasticities affect the model results is studied in this article’s sensitivity analysis. In the sensitivity tests, the parameters are assumed to change by ±10%, ±20%, and ±50% (Chen, 2022); subsequently, the changes of the indices are compared to the corresponding changes of the parameters. Only when indices’ changes are much lower than the corresponding parametric changes will we confirm the robustness of the model results.
The income-expenditure block delineates the financial inflows and outflows of the domestic entities. The representative household derives income from labor compensation, capital return, and income transfer (Chen & Wang, 2023a). The household income is allocated towards commodity consumption and consumption tax. In contrast, the representative enterprise receives income solely from capital return (Chen & Wang, 2023b). The enterprise’s expenditures encompass labor compensation, production tax, and income transfer. The representative government’s income sources include tax payment and ETS revenue (Chen & Wang, 2023b). The government’s expenditures are directed toward commodity consumption and income transfer. Savings serve to balance the budgets of these entities: a positive value indicates that an entity’s income exceeds its expenditure, while a negative value signifies that expenditure outstrips income.
The trade block elucidates the mechanism of international trade. The representative foreigner derives its income from the sale of commodities consumed domestically. This income is subsequently utilized to purchase commodities produced domestically. The rationale behind international trade is grounded in the Armington assumption, which posits that commodities produced in different countries are imperfect substitutes (Chen & Wang, 2023c). Foreign savings play a crucial role in balancing the budget of the foreigner.
The ETS-environment block illustrates the environmental consequences of domestic anthropogenic activities, excluding those from foreign sources. Domestic economic output relies on the input of fossil energy, which inevitably leads to the emissions of greenhouse gases and air pollutants. Specifically, PM2.5 and O3 pollutions are known to cause morbidity and mortality, thereby imposing adverse socioeconomic impacts. While the ETS is primarily implemented to curb the rapid increase in carbon emissions, it also restricts the combustion of nonrenewable energy and thus indirectly curtails air pollutant emissions. Hence, the ETS ultimately enhances air quality and reduces the economic costs associated with air pollution.
The dynamic block outlines the settings of the dynamic variables in the business-as-usual (BAU) scenario, though the projected growth trajectories of these variables are influenced by the ETS. In the BAU scenario, price projections are derived from the long-term baseline forecasts in the OECD database. The growth rate of energy consumption adheres to the projections detailed in the International Energy Outlook 2023. The GDP growth rate follows the trajectory provided by OECD’s long-term GDP forecast. Demographic projections are sourced from the medium-variant projections in the World Population Prospects (WPP) 2024.
The CEED 2.0 model is constructed based on the following assumptions: Firstly, the model assumes no labor training costs and capital installation costs; therefore, ETS enables labor and capital to move freely among the domestic sectors (Chen, 2024). Secondly, labor and capital are assumed to be immobile between China and the rest of the world. While this assumption was rational during the strict COVID-19 lockdown, it remains valid even after China’s reopening in 2023. This is because international movements of labor and capital are relatively minimal compared to the overall domestic supplies of labor and capital. Thirdly, full employment is assumed, with labor supply equal to labor input, but we do not consider involuntary unemployment resulting from air-pollution-related morbidity. Lastly, technological progress reduces the negative environmental impacts of economic activities (Zhou & Choi, 2025). In this article, the impact of technological progress is measured by autonomous energy efficiency improvement (AEEI), as detailed in Chen (2024).
Policy Detail
In this article, the ETS is designed to cover the secondary industrial sectors and the transport sector. This design aligns with the expansion of the CNETS’s sectoral coverage to include non-electricity sectors. As the electricity subsectors utilizing renewable energy are assumed to have zero carbon emissions (Chen & Wang, 2023b), these subsectors are exempt from the ETS.
In the designed ETS, the carbon quotas allocated to the regulated sectors are determined by subtracting the annual quota decline from the sectoral emissions in 2020. This approach is consistent with the CNETS’s quota allocation, which was based on firms’ emissions in 2020 (MEEPRC, 2020). The annual quota decline factor is set at 10%, reflecting the tightening implementation of the ETS. Initially, the free quota ratio (FQR) is set at 90%, meaning that 90% of the allocated quotas are provided free of charge (Lin & Jia, 2018). Given that the FQR of the EU ETS has gradually decreased over time, the FQR of the designed ETS is set to decrease by 10% annually in 2025 to 2060. In addition to free quotas, the remaining quotas are allocated through auctions, with the auction price assumed to equal the trading price (Chen, 2023).
The quota trading price is fixed at the current CNETS price, namely 90
The ETS generates revenues through the auctioning of carbon quotas and the imposition of penalties for emission non-compliance (Chen & Wang, 2023c). Since revenue recycling is beyond the research scope of this paper, ETS revenues are assumed to be retained in the governmental budget (Chen & Wang, 2023b).
PM2.5-Related Morbidity and Mortality
To the best knowledge, there are no official projections of PM2.5 concentrations in China in 2025 to 2060; in this article, the projected PM2.5 concentrations are defined in Equation 1. PMC
t
stands for PM2.5 concentrations; PMC2020 denotes the PM2.5 concentrations in 2020. According to the Annual Report on the State of China’s Ecological Environment 2020, the average PM2.5 concentrations in Chinese cities and towns were 33

PM
2.5-related morbidity is defined in Equations (2) and (3), according to Xie et al. (2016). The subscript pmb refers to a PM2.5-related morbidity endpoint.


PM
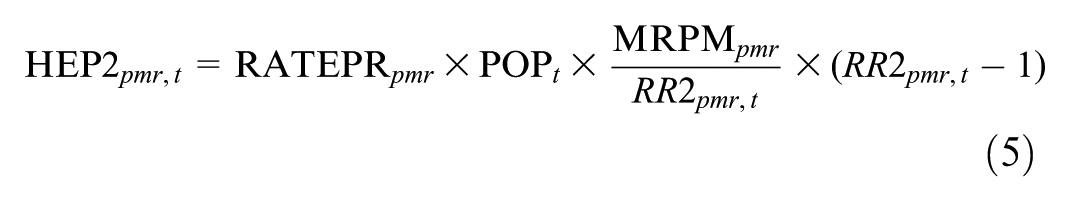
2.5-related mortality is defined in Equations (4) and (5). The subscript pmr denotes a PM2.5-induced disease, namely acute lower respiratory infection (ALRI), chronic obstructive pulmonary disease (COPD), ischemic heart disease (IHD), lung cancer (LC), and stroke (SK; Burnett et al., 2014).

O3-Related Morbidity and Mortality
As there are no official projections of China’s O3 concentrations in 2025 to 2060, the projected O3 concentrations are defined in Equation 6. OZC
t
stands for O3 concentrations;

In Equation 6, the O3 concentrations from O3-related precursor emissions are assumed to change based on the base-year level. As air pollutant emissions and CO2 emissions often originate from the same sources, O3-related precursor emissions (OZE
t
) are assumed to change proportionally to carbon emissions (TCE
t
); therefore, we can get
Equations (7) and (8) present the quantification method of O3-related morbidity. The subscript omb refers to an O3-related morbidity endpoint, whose value is listed in the first column of Table S6 in the Supplemental materials.


O
3-related mortality is defined in Equations (9) and (10).


Impacts of PM2.5 and O3 Pollution
How PM2.5 and O3 pollutions impact laborers’ work time is defined in Equations (11) and (12), respectively. WHLPM
t
and WHLOZ
t
mean work hour loss from PM2.5 and O3 pollutions. PWH is annual work hours, and it is calculated as


In the BAU scenario, full labor employment is assumed, and the impact of air pollution is not considered; therefore, labor input (

Medical service price (MSP
t
) denotes the aggregate price of outpatient and hospital admissions, and it is calculated based on the quantification method in Kim et al. (2020), as shown in Equation (15). PGDP
t
is per capita GDP. MSP
t
is assumed to be linearly correlated with PGDP
t
; it can be explained by PGDP
t
using a linear regression (Xie et al., 2019).

Health expenditure on air-pollution-related morbidity (HEAPM t ) is defined in Equation (16). Given household income unchanged, HEAPM t crowds out household expenditures on other items; therefore, it decreases commodity consumption and deteriorates household welfare. In this paper, as medical service is provided by the service sector, HEAPM t is added to the output of the service sector.

Equation (17) defines the value of a statistical life (VSL
t
; Kim et al., 2020). WTP refers to willingness to pay; its value was approximately .25 million USD in China (Xie et al., 2019), which can be transformed to 1.72 million CNY in the 2020 price level.


Scenarios
Table 1 provides a summary of the scenarios designed in this article. The business-as-usual (BAU) scenario does not account for the impact of air pollution and the implementation of the designed ETS. The PM2.5-pollution (PMP) scenario considers the impact of PM2.5 pollution without implementing the ETS. The O3-pollution (OZP) scenario examines the impact of O3 pollution in the absence of the ETS. The air-pollution (AIP) scenario takes into account the impacts of both PM2.5 and O3 pollutions without ETS implementation. The ETS-implementation (ETI) scenario features the implementation of the ETS without considering air pollution. The PM2.5-ETS (PME), O3-ETS (OZE), and Air-ETS (AIE) scenarios share the same air pollution settings as the PMP, OZP, and AIP scenarios but differ in policy implementation; in the PME, OZE, and AIE scenarios, the designed ETS is implemented.
Designed Scenarios.

Result
Impact of Air Pollution
In Figures 2 to 4, the legends “PM2.5 Pollution,”“O3 Pollution,” and “Air Pollution” correspond to the differences in the PMP-BAU, OZP-BAU, and AIP-BAU scenarios, respectively. By comparison, the curves labeled “PM2.5 Pollution,”“O3 Pollution,” and “Air Pollution” in Figures S1 to S3 in the Supplemental materials illustrate the differences in the PME-ETI, OZE-ETI, and AIE-ETI scenarios.
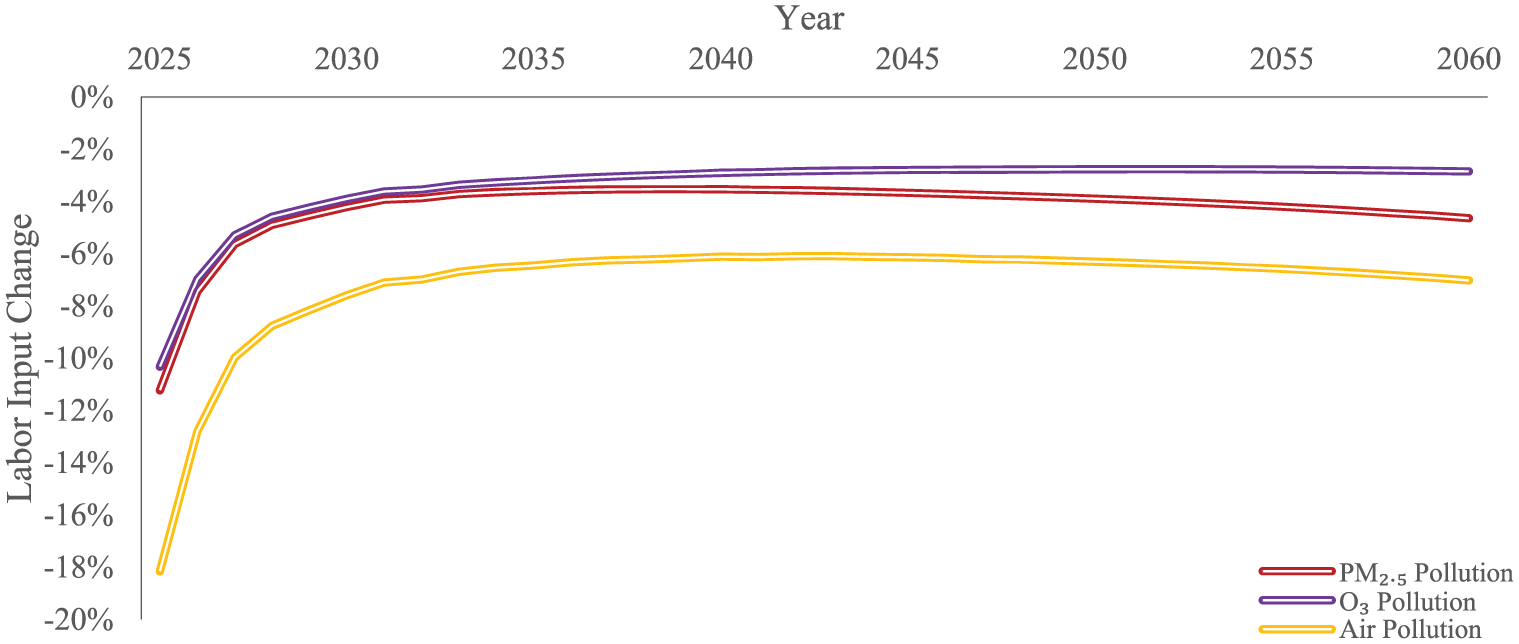
Impact of air pollution on labor input without ETS implementation.

Impact of air pollution on GDP without ETS implementation.

Impact of air pollution on carbon emissions without ETS implementation.
Figures 2 and S1 depict the influence of air pollution on labor input in the absence and presence of the ETS implementation. As shown in these figures, both PM2.5 and O3 pollutions reduce labor input, with the former having a more pronounced impact than the latter. This is because air pollution leads to morbidity and mortality, which adversely affect labor health and productivity, thereby diminishing laborers’ working time. The impact of air pollution, defined as the combined effect of PM2.5 and O3 pollutions, is more pronounced than that of a single air pollutant. From 2025 to 2030, the labor input loss from air pollution is expected to decrease sharply, but it will become stable in the long term. The magnitude of this air-pollution impact is somewhat lower during the ETS implementation compared to the case without policy implementation. The underlying mechanism is that the ETS restricts nonrenewable energy exploitation, thereby reducing air pollutant emissions. Nevertheless, the shapes of the curves in Figure S1 are quite similar to those in Figure 2, which suggests that the ETS has a minimal effect on this air-pollution impact.
The impact of air pollution on economic growth is illustrated in Figures 3 and S2. Air pollution leads to GDP loss for two primary reasons: firstly, it reduces labor input, which is essential for economic output; secondly, it generates additional health expenditure, which crowds out private consumption. PM2.5 pollution incurs greater economic loss than O3 pollution over time, indicating that PM2.5 is a more concerning air pollutant. The curves in Figures 3 and S2 have similar shapes but differ in their positions. This result suggests that while the ETS slightly relieves this air-pollution impact, it cannot eliminate the economic loss induced by air pollution.
Figures 4 and S3 examine the relationship between air pollution and carbon emissions. Air pollution leads to a reduction in greenhouse gas emissions because it hampers economic growth, which in turn decreases fossil fuel combustion and subsequently lowers carbon emissions from human activities. The ETS reduces the magnitude of this air-pollution impact on carbon emissions. Nevertheless, the minimal differences observed in Figures 4 and S3 suggest that the ETS plays a modest role in moderating the relationship between air pollution and carbon emissions.
Figures 5 and S4 display the health expenditure on air-pollution-related morbidity (HEAPM). Although the impact of air pollution on GDP is expected to stabilize after 2030, HEAPM is projected to increase over time. This increase is attributed to economic growth, which leads to rising per capita GDP and, consequently, higher medical price, thereby expanding HEAPM. PM2.5 pollution induces a higher HEAPM than O3 pollution. The gap between these two pollutants is minimal in 2025 but widens over the research period. Comparing Figures 5 and S4 reveals that the ETS slightly reduces HEAPM, though this effect is relatively negligible.

HEAPM without ETS implementation (unit: 109 CNY).
Figures 6 and S5 in the Supplemental materials illustrate the impact of air pollution on the monetary value of air-pollution-related mortality (MVAPM). These figures reveal that PM2.5 pollution induces a significantly higher MVAPM than O3 pollution, which explains why the curve for air pollution closely resembles the curve for PM2.5 pollution. The upward trend in MVAPM is attributed to economic growth, which drives up per capita GDP and thus the value of a statistical life. Although the effect of the ETS on MVAPM is minimal and barely perceptible, it does contribute to a slight reduction in MVAPM.
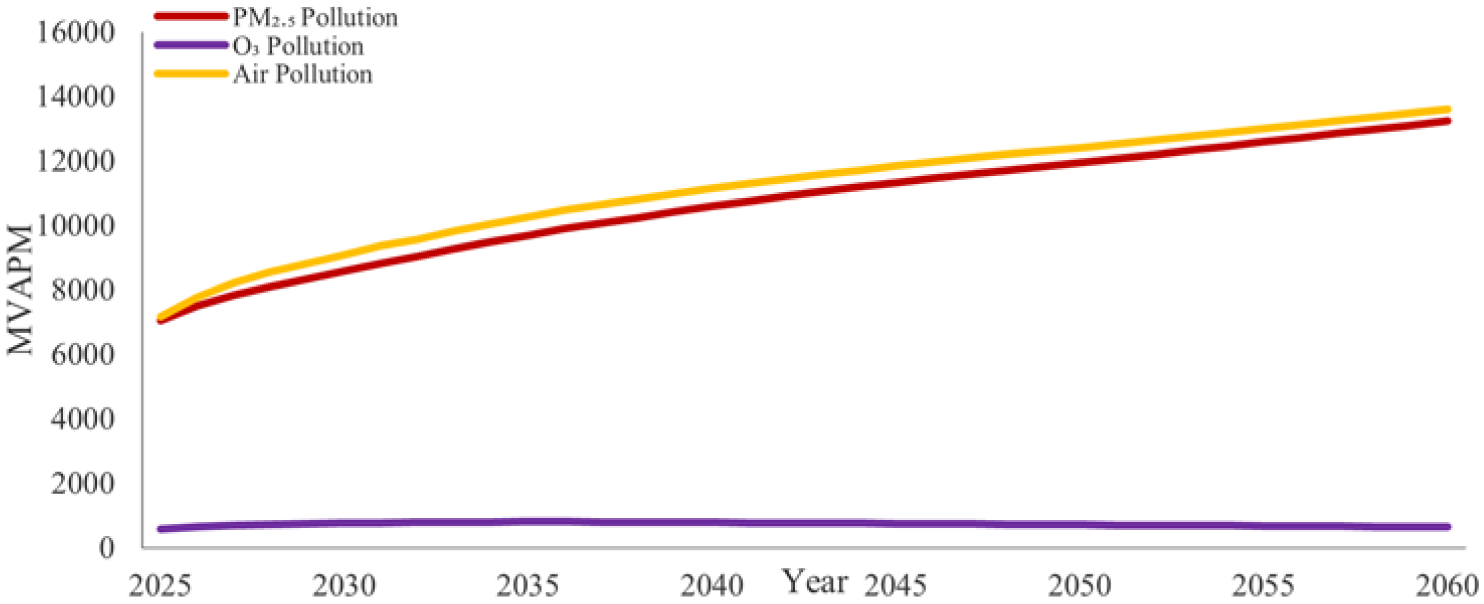
MVAPM without ETS implementation (unit: 109 CNY).
ETS Effect
In Tables S7 to S11 in the Supplemental materials, the terms “No Air Pollutants,”“PM2.5,”“O3,” and “Air Pollutants” stand for the differences between the ETI-BAU, PME-PMP, OZE-OZP, and AIE-AIP scenarios, respectively.
Table S7 shows the effect of the ETS on labor input when air pollution is considered as a moderator. In the short term, the ETS reduces labor input because it induces an economic downturn and thus diminishes the demand for labor. Nevertheless, this negative effect declines in the long term as the ETS promotes the low-carbon transition and fosters the development of a green economy. The health co-benefits resulting from reduced air pollution partially offset the labor loss caused by the ETS, as improved air quality enhances labor health and thus increases work time, thereby mitigating the negative effect of the ETS on labor input. The health co-benefits, measured in labor input, are depicted in Figure S6 in the Supplemental materials. According to Figure S6, the health co-benefits from O3 reduction are greater than those from PM2.5 reduction. Notably, these health co-benefits decline sharply over time following the implementation of the ETS.
Table S8 explains how the ETS affects GDP. The ETS incurs abatement costs and exerts a negative effect on GDP in the short term. This negative effect gradually diminishes in the long term as the ETS fosters green innovation, which compensates for its initial disruption to the market mechanism. The health co-benefits resulting from reduced air pollution mitigate GDP loss during the policy implementation. This is because the improved air quality, attributable to the ETS, increases labor input and thus supports economic growth. The health co-benefits, measured in GDP, are depicted in Figure 7. The health co-benefits from O3 reduction are greater than those from PM2.5 reduction. These health co-benefits gradually fade over time, owing to the decreasing effect of the ETS on carbon (air pollutant) emissions.

Health co-benefits of ETS measured by GDP (unit: 109 CNY).
Table S9 presents the effect of the ETS on carbon emissions, with air pollution acting as a moderator. The ETS reduces carbon emissions by discouraging the exploitation of fossil fuels. The effect of the ETS on emissions is much larger than its effect on GDP, indicating that the ETS decreases carbon intensity (emissions per unit of GDP). Considering health co-benefits, the emission abatement achieved by the ETS appears to be less substantial. The economic intuition is that increasing labor input from improved air quality stimulates economic growth, which consequently increases the combustion of fossil fuels and thus greenhouse gas emissions, thereby diminishing the emission mitigation effect of the ETS.
How the ETS affects HEAPM is shown in Table S10. By discouraging nonrenewable energy consumption, the ETS indirectly reduces air pollutant emissions, thereby alleviating air pollution and consequently lowering HEAPM. The ETS has the most significant percentage effect on O3-related health expenditure, while its percentage effect on overall air-pollution-related health expenditure is the smallest. Conversely, the absolute effect of the ETS, as depicted in Figure 8, differs from the percentage effect. According to Figure 8, the health co-benefits, measured by the reduction in HEAPM, are the highest for air pollution, followed by O3 and PM2.5.

Health co-benefits of ETS measured by HEAPM (unit: 109 CNY).
Table S11 illustrates the effect of the ETS on MVAPM. By indirectly reducing air pollutant emissions, the ETS alleviates air pollution and thus saves MVAPM. The ETS has the most significant percentage effect on O3-related mortality; however, it has the smallest absolute effect on O3-related mortality, as demonstrated in Figure S7 in the Supplemental materials. The ETS saves more PM2.5-related mortality than O3-related mortality. Overall, the ETS brings about the highest health co-benefits measured in GDP, followed by MVAPM and HEAPM.
Sensitivity Test
In this article, the sensitivity tests are performed based on the case in the AIE scenario in 2060. Tables S12 to S24 in the Supplemental materials shows the results of the sensitivity tests on the CES elasticity parameters, concentration-response functions, and health valuations. According to Table S12, the changes of the indices are much lower than the corresponding changes of the CES elasticities; therefore, the model results are quite insensitive to the given values of the CES elasticities.
Table S13 implies that the value of HEAPM is sensitive to
Tables S20 and S21 imply that no indices are unduly influenced by CRFOR and ACM. According to Tables S22 and S23,
In summary, the calculated values of labor input, GDP, and carbon emissions are inelastic to the given values of the exogenous parameters. The values of HEAPM and MVAPM are sensitive to some parameters in the concentration-response functions and health valuations.
Discussion
The results of the CGE model imply that PM2.5 pollution causes greater economic loss than O3 pollution. Ambient particulate matter pollution ranks fourth out of 67 risk factors after high blood pressure, tobacco exposure, and a diet low in fruits in China (Wu et al., 2017). Hence, recognized as a primary air pollution (Chen & Wang, 2022), PM2.5 pollution causes more economic loss in China. This finding has been empirically proven by many previous studies. For instance, Wang et al. (2025) analyzed the spatial and temporal distribution patterns of PM2.5 and O3 pollutions in China, revealing that the economic costs associated with PM2.5 and O3 pollutions were 214.31 and 94.53 billion CNY, respectively. By 2030, PM2.5 pollution could lead to a GDP loss of 2.0%, while O3 pollution would result in a GDP loss of only 0.09% (Xie et al., 2019).
The ETS alleviates the negative impacts of air pollution because it increases the cost of nonrenewable energy exploitation and thus indirectly reduces air pollutant emissions, thereby mitigating labor loss caused by air pollution. This finding aligns with Li et al. (2018), who discovered that the national health co-benefits from improved air quality would partially or fully offset the costs of pricing energy-related carbon dioxide emissions in China. Similar health co-benefits were observed in South Korea, where achieving mitigation targets would save lives from air-pollution-related premature mortality, reduce health expenditure, and lower the loss of work hours (Kim et al., 2020).
The ETS abates carbon emissions, but this emission abatement comes at the cost of labor input loss and GDP loss in the short term. The economic intuition explaining the negative economic effect is that the ETS disrupts the market mechanism for resource allocation and thus causes deadweight loss. Nevertheless, such economic loss diminishes in the long term, as the ETS stimulates economic growth by encouraging green innovation. Considering the health co-benefits from reduced air pollution, the negative economic consequences of the ETS are further lessened. Health co-benefits partially offset the abatement cost of the ETS because improved air quality enhances labor health, thereby increasing labor input and stimulating economic growth. Previous evidence supports the idea that health co-benefits save the implementation cost of ETS. For example, Liu et al. (2021) found that the ETS-induced reduction in PM2.5 concentrations saved the Chinese GDP by $41.38 billion annually.
The ETS generates more health co-benefits from O3 reduction than from PM2.5 reduction, when measured in terms of labor input, GDP, and health expenditure. The underlying mechanism is that the contribution of the primary sources to PM2.5 pollution is lower than that of precursor emissions to O3 pollution; by abating air pollutant emissions, the ETS decreases more O3 pollution and thus generates more O3-related health co-benefits. Nevertheless, the ETS is more effective in reducing PM2.5-related mortality than O3-related mortality. This is because PM2.5 pollution causes much more premature mortality than O3 pollution in China (Wang, Hu, et al., 2022); therefore, the ETS reduces more PM2.5-related mortality than O3-related mortality. Similar findings could be found in Li et al. (2019), who discovered that in a policy scenario aligned with China’s commitment to peak carbon emissions, the number of avoided premature deaths from O3 reduction is approximately 60% of that from PM2.5 reduction by 2030.
The health co-benefits of the ETS are expected to decrease over time and will become minimal in 2060. This is because the simulated ETS in this paper is not stringent enough to effectively abate carbon emissions in the future. If the quota trading price was higher, the ETS would generate more health co-benefits. Such evidence could be found in the EU ETS, which brings about sizable health co-benefits (Basaglia et al., 2024). Achieving the global warming targets requires the massive abatement of greenhouse gases, and thus it leads to a significant reduction of air pollution. For instance, the emission mitigation following the SSP1-2.6, SSP2-4.5, and SSP3-7.0 scenarios will cause the European PM2.5 concentrations to decrease by 52%, 34%, and 18% in 2050 compared to the 2014 level (Clayton et al., 2024).
Despite the interesting findings, this article has several limitations that should be addressed in future research. Firstly, since air pollutant emissions and carbon emissions often originate from the same sources (Workman et al., 2019), the former is assumed to change proportionally to the latter. Unfortunately, this assumption oversimplifies the intricate relationship between air pollution and anthropogenic climate change. Secondly, air pollutant concentrations are assumed to correlate positively with air pollutant emissions. Yet, this positive correlation may not always exist. For instance, during the COVID-19 lockdown in China, precursor emissions significantly decreased, while O3 concentrations paradoxically increased (Tian et al., 2024). Thirdly, we have modeled the health co-benefits from the reduction of PM2.5 and O3 pollutions only, but the ETS may also generate ancillary benefits from reducing the concentrations of other air pollutants, such as SO2 and NO x . Fourthly, the quantification methods of HEAPM and MVAPM need to be improved, as these indices are sensitive to some parameters in the concentration-response functions and health valuations. Lastly, we have only quantified the health co-benefits in China, where the ETS is implemented. As clean air is a public good, emission mitigation could have transboundary health co-benefits (Wang, Xie, et al., 2022); therefore, the health co-benefits of the ETS may have been underestimated in this article.
Conclusion and Policy Implication
This article employs a dynamic recursive CGE model, named the China Energy, Economy, and Demography (CEED) 2.0 model, to investigate the health co-benefits resulting from the reduction of PM2.5 and O3 pollutions during the ETS implementation. The model results indicate that both PM2.5 and O3 pollutions contribute to morbidity and mortality, thereby exerting negative impacts on labor input and thus economic output. Notably, the socioeconomic impact of PM2.5 pollution is more pronounced than that of O3 pollution. The ETS, primarily designed to mitigate carbon emissions, has the health co-benefits from alleviating the negative economic consequences of air pollution. These health co-benefits are due to the fact that the ETS curbs nonrenewable energy consumption, thereby reducing air pollutant emissions. Although the ETS incurs abatement costs, leading to a short-term reduction in GDP, this negative effect is relieved in the long term as the ETS fosters the development of a green economy. Considering the health co-benefits derived from reduced air pollution, the negative economic consequences of the ETS are lessened, even though these co-benefits do not fully compensate for the abatement costs. The ETS generates more O3-related co-benefits measured in labor input, GDP, and health expenditure; by comparison, it yields more PM2.5-related co-benefits measured in mortality.
These findings suggest that air pollutants have devastating economic consequences, with the impact of PM2.5 pollution more significant than that of O3 pollution. The ETS emerges as a viable policy option to relieve the negative socioeconomic impacts of air pollution. To increase the health co-benefits of ETS, for researchers, it is essential to broaden the scope of health co-benefits by including the co-benefits from the reduction of air pollutants other than PM2.5 and O3 in policy evaluations. For policymakers, a more stringent ETS design with fewer allocated carbon quotas may suppress more nonrenewable energy combustion, which abates more air pollutant emissions and thus generates more health co-benefits. If ETS revenues are utilized to support the deployment of renewable energy, the exploitation of fossil fuels is further discouraged, thereby expanding the health co-benefits of ETS.
Supplemental Material
sj-docx-1-sgo-10.1177_21582440261421993 – Supplemental material for The PM2.5-Related and O3-Related Health Co-Benefits of Emission Trading Scheme: A Case Study in China
Supplemental material, sj-docx-1-sgo-10.1177_21582440261421993 for The PM2.5-Related and O3-Related Health Co-Benefits of Emission Trading Scheme: A Case Study in China by Shuyang Chen in SAGE Open
Footnotes
Ethical Considerations
This article does not contain any studies with human or animal participants.
Consent to Participate
There are no human participants in this article and informed consent is not required.
Funding
The author received no financial support for the research, authorship, and/or publication of this article.
Declaration of Conflicting Interests
The author declared no potential conflicts of interest with respect to the research, authorship, and/or publication of this article.
Data Availability Statement
Additional data will be available upon reasonable requests.
Supplemental Material
Supplemental material for this article is available online.
References
Supplementary Material
Please find the following supplemental material available below.
For Open Access articles published under a Creative Commons License, all supplemental material carries the same license as the article it is associated with.
For non-Open Access articles published, all supplemental material carries a non-exclusive license, and permission requests for re-use of supplemental material or any part of supplemental material shall be sent directly to the copyright owner as specified in the copyright notice associated with the article.