
Abstract
Gross domestic product (GDP) depends on myriad factor and financial intermediaries especially banks play a very important role in economic growth and development of a country. They not only lend loans rather also generate liquidity—which is very important for the smooth functioning of an economy. Therefore, this study explores the channels through which bank liquidity creation affects GDP. It uses the data from listed and unlisted Chinese banks ranging from the year 2006 to 2017. The results of the analysis reveal that the liquidity creation by Chinese banks significantly negatively affects economic output. The magnitude of the impact of small-bank liquidity creation is greater than the large banks. Variation in the GDP is explained by current and previous year’s liquidity creation. Cat-fat measure of liquidity creation affects GDP directly as well as through consumption, investment, government expenditure, and net exports channels; however, cat-nonfat measure affects economic output directly and through all aforementioned channels except net exports. Overall, the findings support the hypothesis that liquidity creation affects the economy directly as well as through different channels.
Introduction
Gross domestic product (GDP) of a country depends on a myriad of factors. A number of existing studies have analyzed the impact of many different factors on economic growth (Agrawal & Khan, 2011; Anghelache et al., 2015; Boukhatem & Ben Moussa, 2018; Comunale, 2017; Jiménez-Rodríguez & Sánchez, 2005; Lardic & Mignon, 2006). There are also a number of studies which relate finance with economy in general (e.g., Arcand et al., 2015; Bekaert et al., 2005; Demirgüç-Kunt & Maksimovic, 1998; Greenwood & Jovanovic, 1990; King & Levine, 1993) and banks in particular (e.g., Black & Strahan, 2002; Cetorelli & Strahan, 2006; Jayaratne & Strahan, 1996; Krishnan et al., 2015; Rice & Strahan, 2010). Bank loans are considered to be the engines of growth (e.g., Levine & Zervos, 1998) and especially the loans lent by small banks (Berger & Bouwman, 2017; Kashyap & Stein, 1997). At the same time, banks are also considered to be the source of economic distress (Acharya & Naqvi, 2012; Berger & Bouwman, 2009, 2017; Chatterjee, 2018; Diamond & Rajan, 2003). So, there exists a linkage between bank performance and economic growth.
Before the research paper of Berger and Bouwman (2009), different researchers used various measures of bank output to relate banks with economic growth (e.g., Deyoung et al., 2004; Duchin & Sosyura, 2014; Laeven & Levine, 2009). However, after Berger and Bouwman (2009), different studies have used their liquidity creation (LC) measures to find the relationship between bank activity and economic growth (Berger & Sedunov, 2017; Chatterjee, 2018; Davydov et al., 2018). Berger and Sedunov (2017) argue that LC is a better measure of bank output than total asset (TA) or grand total asset (GTA) because it not only takes on-balance sheet activities into consideration rather it also accounts for off-balance sheet guarantees, lines of credit and derivatives, and so on. The importance of off-balance sheet activities can be highlighted by the conclusion drawn by Berger and Bouwman (2017) that off-balance sheet activities are source of half of the total liquidity created by U.S. banks.
Berger and Sedunov (2017) tried to explore the relationship between LC and real economic output using data from U.S. banks. They used LC measures proposed by Berger and Bouwman, (2009) and concluded that LC positively affects real economic output and that LC by small banks matters more for GDP per dollar than large banks. Their study also determined that LC by small banks affects GDP through bank-dependent industries, that is, LC affect GDP through investment channel but the study is silent about the other channels through which LC by banks may affect economic output. As GDP can also be measured by the combination of consumption, investment, government expenditure, and net exports, so this study will analyze the impact of LC on GDP overall, and on every individual component of GDP. The relationship between LC and different factors of GDP will enhance our understanding of the channels through which LC affects economic output. It will highlight the most important and least important channels through which bank LC affects GDP. The results will help policymakers to make better policies for improving economic output through banks.
This study uses the data from 377 listed, unlisted, national, regional, and city-level Chinese banks to find the answers to our questions. Chinese banks have been studied due to number of reasons. First, China is the economy having weaker capital markets and stronger banks and the policy loans by the banks have played a pivotal role in the economic development of the country. Second, the Chinese banking system have the comprehensive data set for the analysis of aforementioned relationships. Third, most of the studies related to LC and GDP focus on developed countries, and there is scarcity of studies exploring the relationship between LC and GDP of developing economies. This study uses data from Chinese banks to fill the aforementioned void in the literature. Fourth, the use of data from Chinese banks will help us to understand how the LC by highly regulated banking system affect GDP in the country, growing at a very rapid pace.
The results reveal that LC does affect economic output in case of china as well. However, the relationship between GDP per capita and LC is inverse. Contradiction of the findings of this study with that of Berger and Sedunov (2017) may be due to two reasons. First, this study uses lagged values of independent variables rather than current values. Second, United States and China are at two different stages of economic growth. Results of mediation test show that LC cat-fat measure affects GDP directly as well as through consumption, government expenditure, and net exports channels, and cat-nonfat measure affects GDP directly as well as through consumption, investment, and government expenditure but not through net exports. The impact of small-bank LC on GDP is relatively stronger than the large-bank LC, and current year’s GDP depends on current and previous year’s LC only. Second lag of LC is insignificant determinant of current year’s economic output. The findings of this study support the hypothesis that bank LC affects economy directly as well as through consumption, investment, government expenditure, and net exports channels.
The rest of the manuscript is designed as follows. Section “Literature Review and Research Hypothesis” provides a critical analysis of existing literature. Section “Research Design” is about data and methodology. Section “Results and Discussion” presents the findings, and section “Conclusion and Future Research” concludes.
Literature Review and Research Hypothesis
LC is one of the major tasks performed by banks. A lot of researches have been done in this area; however, most of the studies before Berger and Bouwman (2009) were theoretical in nature, and their LC measurement methods were not that comprehensive. So, the empirical evidence of LC was limited (Deep & Schaefer, 2005; Diamond & Dybvig, 1983). A surge in the LC literate has been recorded after the paper of Berger and Bouwman (2009). Different dimensions of LC have been explored since then, for example, LC and bank capital, LC and central bank policies, LC and economic output, LC and risk, LC and governance, and so on, some of the most relevant studies have been discussed below.
Berger and Bouwman (2009) built upon the foundations laid by Deep and Schaefer (2005). Later study criticizes the liquidity transformation gap measure of former study, calculated by difference between liquid liabilities and liquid assets normalized by TAs. By comparing liquidity measures, Berger and Bouwman (2009) proves that their LC measure is better and comprehensive than that of Deep and Schaefer (2005). Many studies conducted after Berger and Bouwman (2009) used their LC measures, which implies that the LC proxies proposed by them are better compared to any other study. Initial studies regarding, on and off-balance sheet measures of LC measure liquidity created by banks over the period, its determinants and most importantly the relationship between bank capital and LC (Berger & Bouwman, 2009; Distinguin et al., 2013; Horváth et al., 2014; Lei & Song, 2013; Rauch et al., 2011). Two different findings have emerged from these studies. First is known as financial fragility—crowding out hypothesis and the other is known as risk absorption hypothesis.
Some other studies have also explored the impact of central banks policies especially monetary policy on LC. Berger and Bouwman (2017) found that monetary policy has significant but minor impact on LC by small banks during normal times and even weaker during crisis. However, they did not find any significant relationship between LC by large banks and monetary policy, suggesting that monetary policy tool may be used to tame the LC by small banks but not the large banks. In another study, Berger et al. (2016) found that regulatory intervention by central bank results in lower LC but capital support does not. So, it is evident from the above studies that central bank policies may change the behavior of banks regarding LC to a certain extent, that is, central bank may regulate economy by affecting LC.
Some of the studies which are more relevant to this study are the ones which explore the relationship between LC and economic output (Berger & Sedunov, 2017; Chatterjee, 2018; Davydov et al., 2018; Fungacova et al., 2013; Fungacova et al., 2013). Chatterjee (2018) used LC as a predictor of recession and found that lower on-balance sheet LC can predict recession four quarters before its occurrence. His study came up with an interesting finding that off-balance sheet LC does not predict recession. The study also found that aggregate LC declines during and five quarters after the crisis. In a similar kind of study, Davydov et al. (2018) found that LC is pro-cyclical, that is, LC may amplify business cycles. A similar kind of proof was provided by Berger and Sedunov (2017) which concluded that LC positively affect real economic output. On the basis of the above studies, we hypothesize that more LC results in higher GDP and vice versa. So, our first hypothesis is
As China is the largest country by exports and known as the factory of the world, so net exports to GDP ratio and foreign exchange rate are very important in determining the GDP of the country. That is why, this study uses these variables as control variables to determine the impact of LC on GDP/Capita. Net exports is the difference between exports and imports of a country. Higher value of net exports mean, country is exporting more and importing less, and higher exports come from higher production that ultimately leads to higher GDP. So from the above argument, we expect net exports to have positive relationship with GDP. Our second null hypothesis is as follows.
As per the basic concepts described in many books of Economics, the exports, imports, foreign exchange rate, and GDP are very much related to each other. The common belief is that the exports of a country increases when its currency depreciates, citrus paribus. Similarly, imports increase when the currency appreciate against foreign currencies, keeping other things constant. Generally speaking, currency appreciation and GDP/capita are positively correlated. So, on the basis of the above arguments, we propose our third null hypothesis.
Berger and Sedunov (2017) also found that small-bank LC generates more GDP per capita compared to large banks; however large-bank LC matters more overall. The study proposed that small-bank LC affects GDP through investment channel. This finding gave us the motivation to explore the remaining channels of consumption, government expenditure, and net export through which LC may affect GDP. So, to fill the aforementioned gap, this study explores the channels through which LC affects economic output. Following the expenditure measure of LC, we establish the following hypotheses regarding the channels through which LC affects GDP.
Some other studies have explored the relationship of LC with corporate governance, diversification, merger and acquisition, risk, and so on. Supporting the findings of Berger and Bouwman (2009), Fungáčová and Weill (2012) concluded that consolidation results in higher LC rather than privatization. Exploring the relationship of LC with corporate governance, Huang et al. (2018) concluded that bank CEO optimism positively affects LC during normal times and even more during crisis. Finally, supporting the findings of Fungáčová and Weill (2012) and Hou et al. (2018) concluded that diversification reduces LC, that is, consolidation enhances LC. They also found that the relationship between LC and diversification is unidirectional.
Research Design
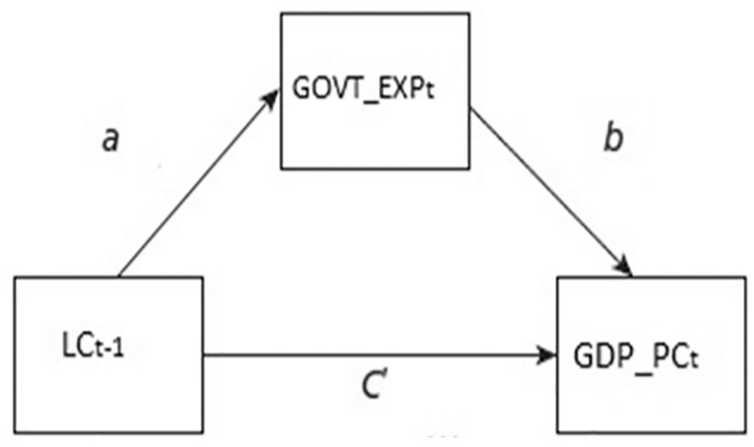
This study uses the data from 377 listed, unlisted, national, regional, and city-level Chinese banks ranging from the years 2006 to 2017. Bank-related data were obtained from Moody’s BankFocus database, and the data for macroeconomic variables were extracted from World Development Indicators (WDI) of The World Bank. The main dependent variable of this study is GDP per capita, and the main independent variable is bank LC. The independent variable was calculated by following Berger and Bouwman (2009), the details of the calculations are given in Table 1.
Liquidity Classification of Bank Activities and Formulas to Calculate Liquidity Creation of a Bank. Panel A Shows that the Bank Activities Are Classified as Illiquid, Semiliquid, and Liquid. The Weights Used to Calculate Liquidity Creation Are Given In Parenthesis. Panel B Represents Three Different Formulas of Liquidity Creation.
Source. Adopted from Lei and Song (2013). LC = liquidity creation.
Panel A of the Table 1 presents the variables required for the calculation of LC, and panel B explain the formulas to calculate Cat-fat and cat-nonfat measures of LC. Assets and liabilities have been divided into three categories each, and according to these measures of Berger and Bouwman (2009), a bank creates one dollar of liquidity when it converts one dollar of liquid liabilities to one dollar of liquid assets or when it converts one dollar of illiquid assets into one dollar of liquid liabilities. On the contrary, a bank destroys one dollar of liquidity when it converts one dollar of liquid assets into one dollar of illiquid liability or equity or when it converts one dollar of illiquid liability or equity into one dollar of liquid assets. The bank neither create nor destroy liquidity when it converts one dollar of illiquid asset into one dollar of illiquid liability or equity or when it does the other way around. To get rid of outliers, LC values were winsorized at first and 99th percentiles.
To match the annual frequency of GDP per capita, total annual LC by all Chinese banks was measured, and it was standardized by annual TAs of the whole banking sector. To avoid the potential issue of endogeneity, GDP per capita was regressed on lagged value of LC and other control variables. Following regression models were used to calculate the coefficients


where GDP_PC stands for GDP per captia, α0 is the coefficient of regression, and βs are the coefficients of independent variables. LC stands for cat-fat and cat-nonfat measure of LC; FXR stands for foreign exchange rate of Chinese Yuan to USD; Nx_GDP stands for net exports to GDP ratio and the subscripts t and t−1 denotes current and previous year’s values respectively. ε represents the error term. Following Berger and Sedunov (2017) and Agrawal and Khan (2011), ordinary least square was used to analyze the impact of LC on economic output. Following Berger and Sedunov (2017), we repeated the above analysis for small and large banks, decided on the basis of their TAs, to know whether the impact of LC on GDP differs by bank categories or not? Among our sample of 377 banks, 221 banks ranked small and 156 came out to be large. To know that how prevalent is the impact of LC on GDP, we ran the following regression model as well


All the symbols and their interpretation is same as stated above. Following (Agrawal & Khan, 2011; Berger & Sedunov, 2017), we have also used ordinary least square technique to measure the coefficients of these equations.
To identify the channels through which LC affects economic output, we run the mediation tests. The possible channels include consumption, investment, government expenditure, and net exports. These channels are based on the expenditure approach for the measurement of GDP. According to this approach, total GDP of a country is the combination of all aforementioned channels and the formula is

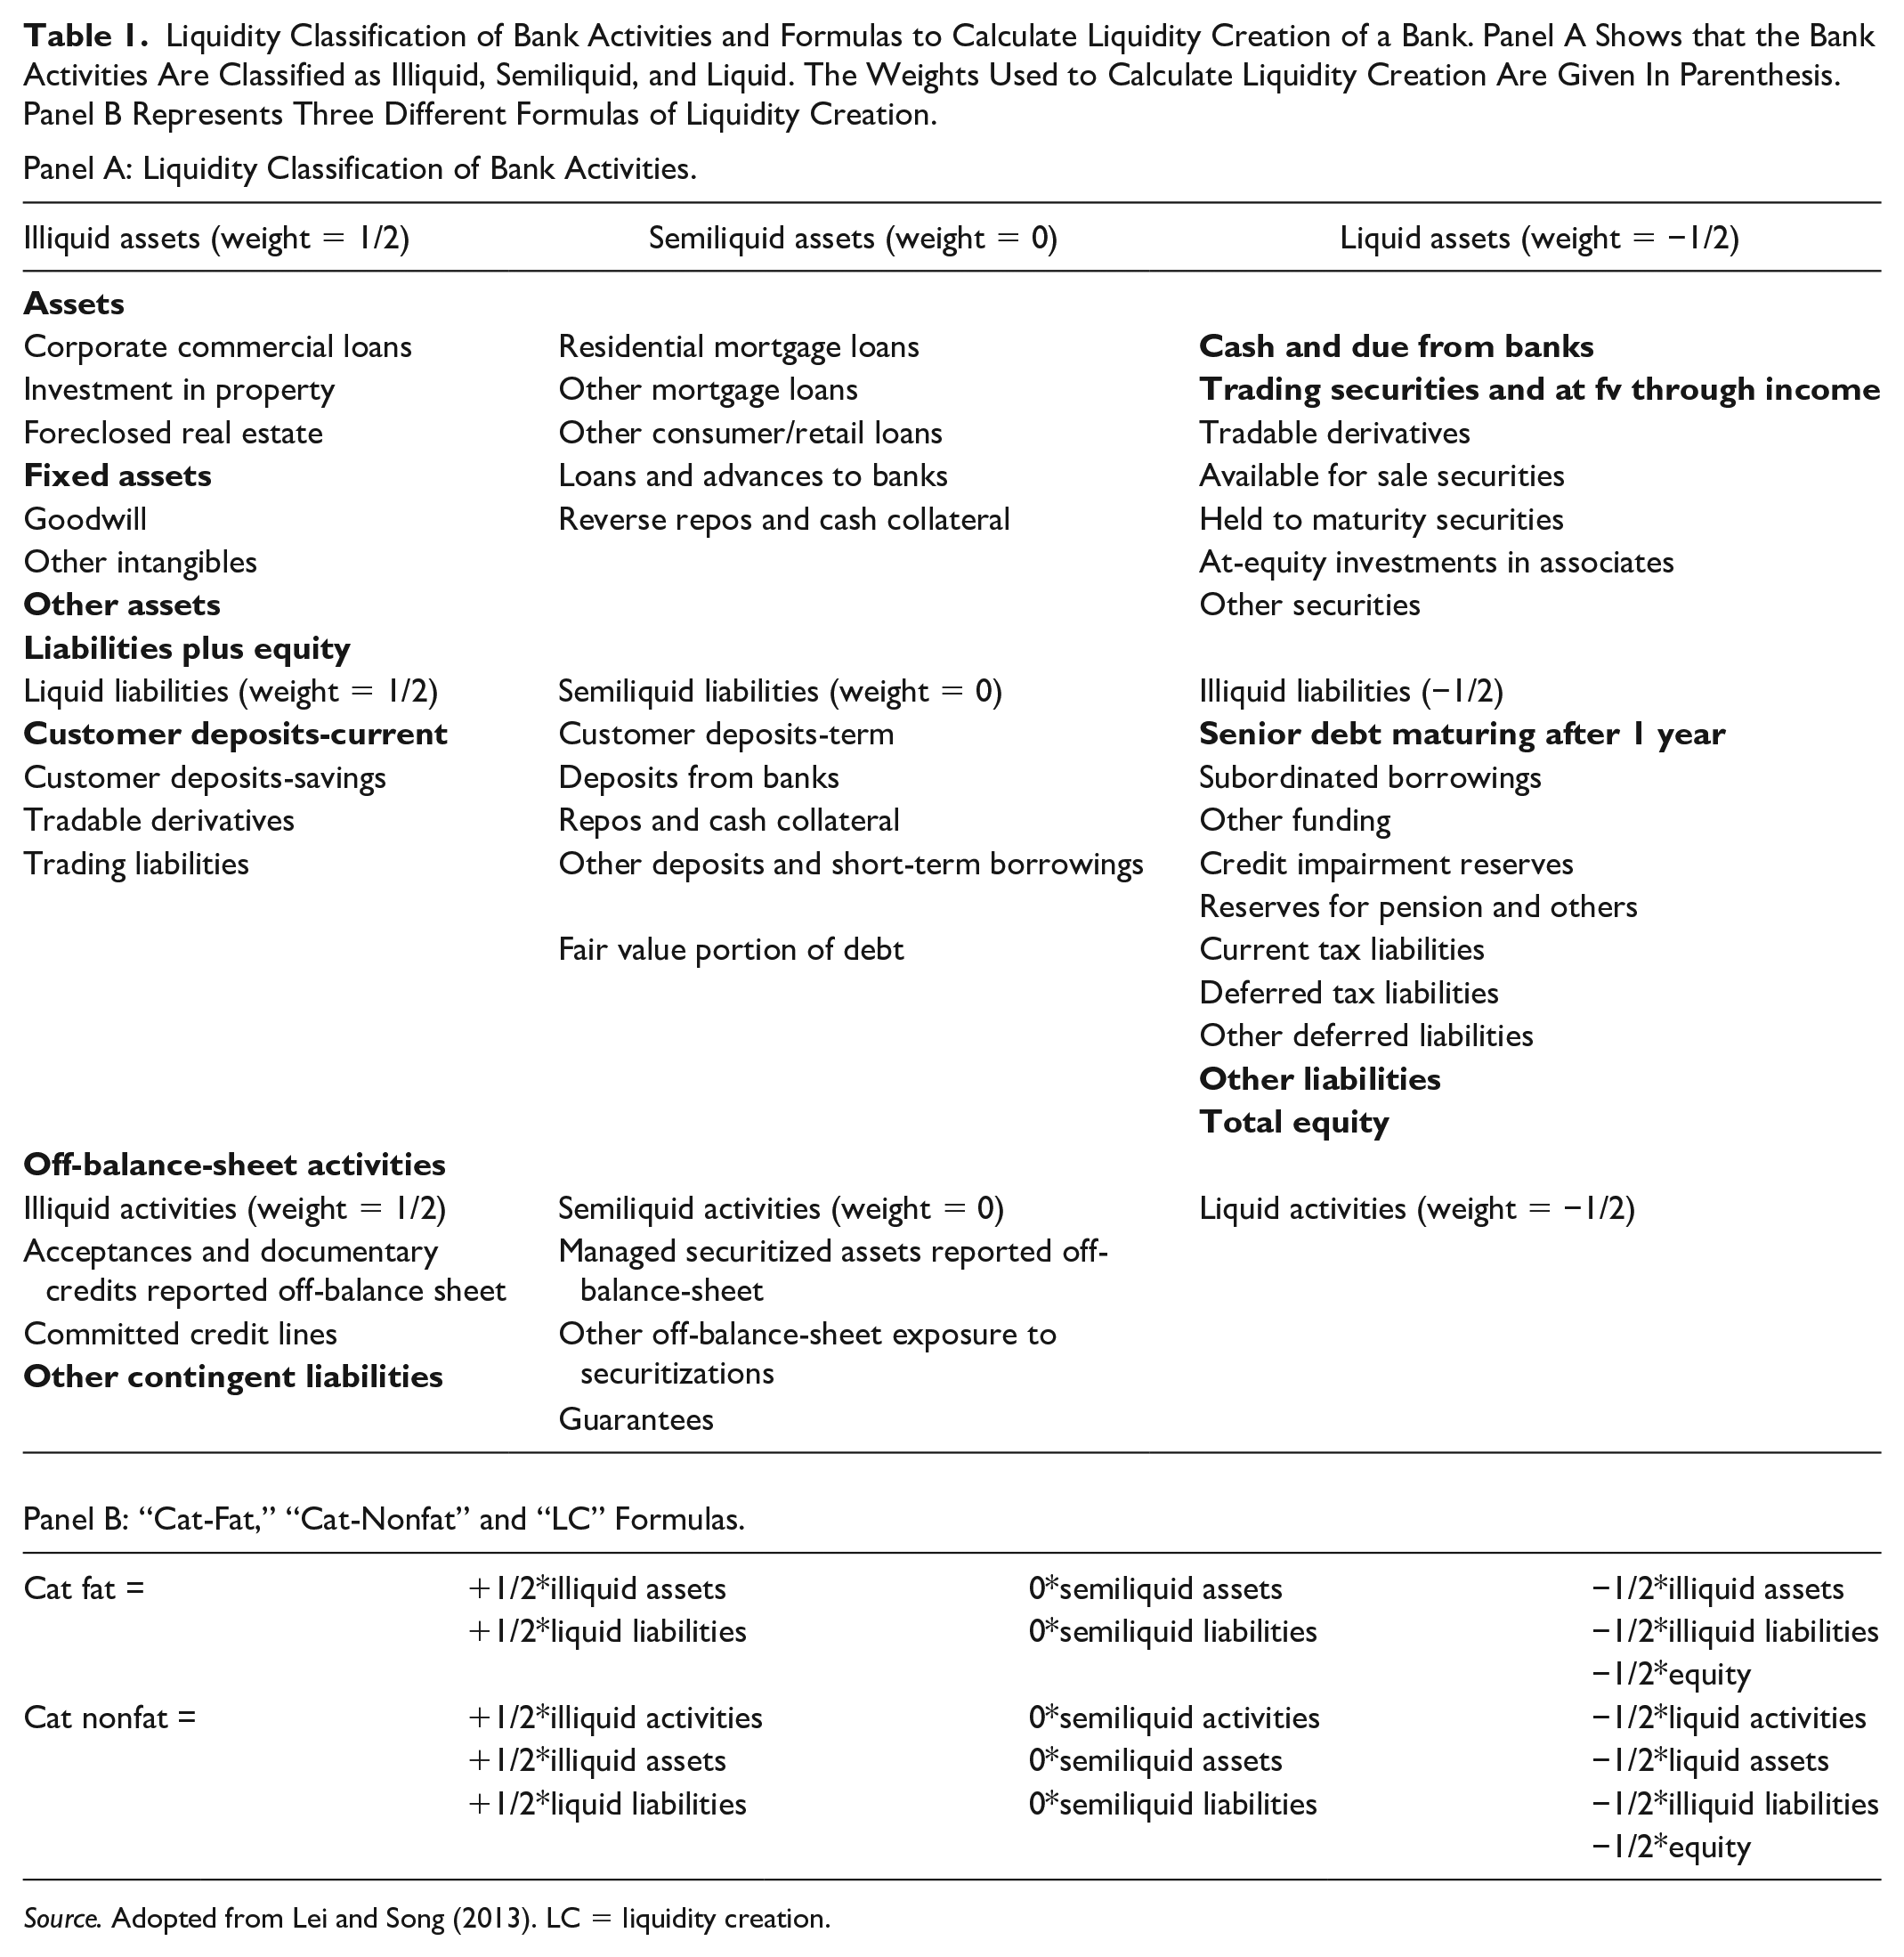
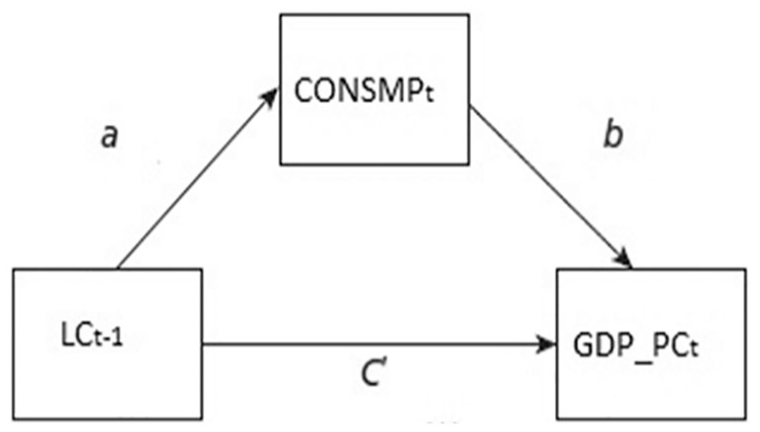
All these paths for mediation analysis are depicted in the following diagram.
All the above figures show paths for mediation analysis. In all the figures, the path coefficient for direct impact of lagged values of cat-fat and cat nonfat on GDP per capita is c′. a shows the impact of previous year’s LC on current year’s consumption, investment, government expenditure, and net exports in Figures 1 to 4, respectively. b shows the path coefficient for current year’s consumption, investment, government expenditure, and net exports’ impact on current year’s GDP per capita in the Figures 1 to 4, respectively. Sobel (1982) test was used to know about the statistical significance of paths a and b. The null hypothesis of Sobel test is
Path analysis for consumption.

Path analysis for investment
Path analysis for government expenditure.

Path analysis for net exports.
Results and Discussion
Descriptive Statistics and Correlation Matrix
Panel A of Table 2 provides the descriptive statistics and panel B presents correlation matrix. The sample consists of yearly data over 2006 to 2017. The data regarding foreign exchange rate and net exports were obtained from WDI of The World Bank, and data regarding LC is calculated by the authors. First of all, cat-fat and cat-nonfat LC by all the Chinese banks was measured using Berger and Bouwman (2009) methodology, then the annual total value of liquidity created by the whole banking sector was calculated and finally the average value for 12 years was measured, which is presented in Table 2. LC was standardized by TAs for regression analysis to get meaningful coefficients. Like LC, net exports were also standardized by total GDP to be used in regression analysis. Panel B of Table 2 shows a very strong negative correlation between LC and GDP per capita. The correlation coefficient between none of the two independent variables is high enough to suggest the existence of multicolinearity. Results of variance inflation factor also revealed nonexistence of heteroskedosticity.
Summary Statistics and Correlation Matrix. This Table Shows Summary Statistics and Correlation Matrix. The Sample Period Ranges from 2006 to 2017. The Values of all the Variables are in USDs. Annual Total Liquidity Creation (LC) by the Whole Banking Sector was Calculated Before Measuring Summary Statistics. LC Data Were Winsorized at first and 99th Percentile.
Panel A: Summary Statistics.

Panel B: Correlation Matrix.
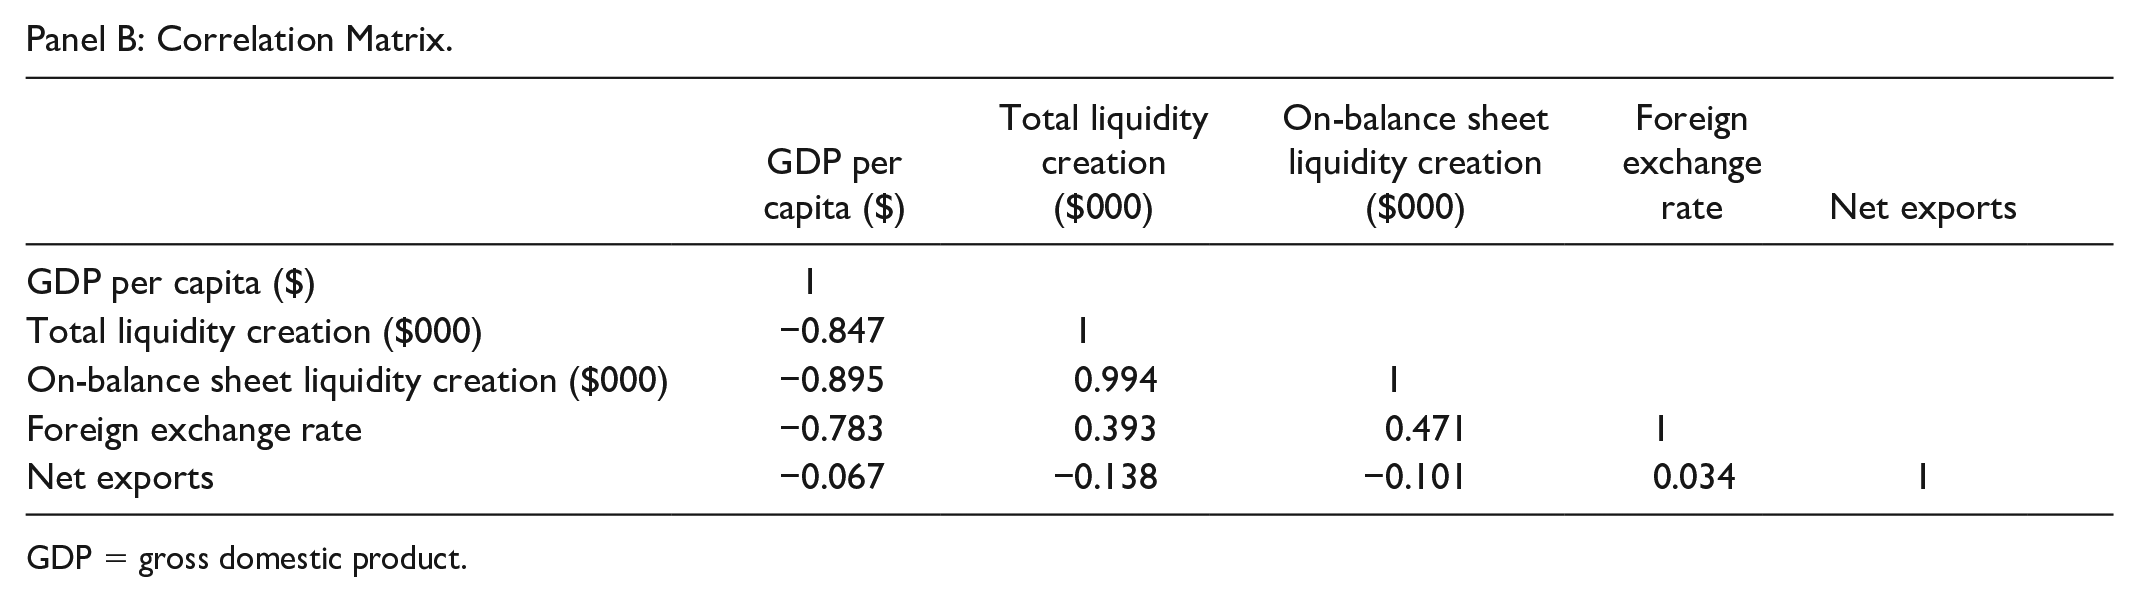
GDP = gross domestic product.
Regression Results and Discussion
Table 3 shows the regression results for overall sample. To avoid the potential issue of endogeneity, all the independent variables are lagged for 1 year because the current GDP cannot cause previous year’s independent variables. Model 1 represents the results for lagged value of cat-fat LC as independent variable and GDP per capita as dependent variable. Model 2 ads lagged value of foreign exchange rate of renminbi to U.S. dollar as independent variable. Model 3 also includes lagged value of net exports to GDP as an independent variable. We repeated the same analysis for cat-nonfat LC measure as well. According to all the regressions, LC significantly affects GDP per capita and the relationship is negative. The results differ from Berger and Sedunov (2017), and the departure may be due to two different reasons. First, the model of this study has used the lagged values of independent variables and second the economic development level of U.S. and China is different.
Ordinary Least Square (OLS) Results for the Impact of Lagged Value of Bank Liquidity Creation (LC) On GDP Per Capita. Liquidity Creation Measures are Normalized by Total Assets. The Sample Period Spans Over 2006 to 2017.

Note. Parentheses Show p values. *, **, and *** represent statistical significance at 10%, 5%, and 1% levels, respectively. GDP = gross domestic product.
Many existing studies on banking seem to agree that the banks of different sizes behave differently (Berger & Bouwman, 2016; Berger & Sedunov, 2017; Umar et al., 2017; Umar & Sun, 2016). Table 4 presents the results for the impact of LC on GDP per capita for different bank sizes. We divided our sample into small and large banks. Banks having TAs value less than the median value of 20.013 billion USD were categorized as small banks, and the banks having assets worth more than the median value were categorized as large banks (Imbierowicz & Rauch, 2014). We repeated the analysis presented in Table 2 for small and large categories. Model 1 presents the results for the impact of cat-fat LC by small banks on GDP per capita; model 2 shows the findings for the influence of cat-fat LC by large banks on GDP per capita; model 3 displays the results for the relationship between cat-nonfat LC by small banks and GDP per capita; and finally the model 4 depicts the effect of cat-nonfat LC by large banks on GDP per capita. The coefficients for both cat-fat and cat-nonfat LC by small banks are greater than the coefficients for large banks, which implies that LC by small banks matters more for GDP per capita than large banks. This result supports the findings of Berger and Sedunov (2017). Smaller banks typically lend to small and medium industries which are engines of growth of an economy. Therefore, we have got the result that LC by smaller banks matter more than their larger counterparts.
Small- and Large-Banks Liquidity Creation’s (LC) Impact on GDP Per Capita. The Coefficients are Obtained by Using Ordinary Least Square (OLS). The Whole Data Were Divided Into Two Parts on the Basis of Median Value of Total Assets. Banks Having Total Assets Value Equal to or Less Than Median Value Are Considered Small And Large, Otherwise. The Sample Period Spans Over 2006 to 2017.

Note. Parentheses show p values. *, **, and *** represent statistical significance at 10%, 5%, and 1% levels, respectively. GDP = gross domestic product.
Table 5 represents the dynamic relationship between bank LC and GDP per capita. Model 1 shows the relationship between current year’s cat-fat LC and cat-nonfat LC, with current year’s GDP per capita. The coefficients show a very strong negative relationship between current year’s LC and GDP per capita. The possible reasons for the inverse relationship between LC and GDP per capita have been explained earlier. Model 2 shows the relationship between first lag of LC and GDP per capita, and model 3 presents the relationship between second lag of LC and GDP per capita. The coefficient of model 2 also show a significant negative relationship between both measures of LC and GDP per capita; however, the value of coefficients is relatively less, which implies that previous year’s LC does effect current year’s GDP per capita, but the impact is relatively less, compared to the impact of current year’s LC on GDP per capita. Model 3 coefficients show that previous to previous year’s LC does not significantly affect current year’s LC as the coefficients of second lags of cat-fat as well as cat-nonfat LC are not significant at 5% level of significance.
Dynamic Impact of Bank Liquidity Creation (LC) On GDP Per Capita. The Models Show the Effect of Current and Two Previous Year’s Liquidity Creation on Economic Output. The Coefficients Are Measured by Using OLS. The Sample Data Range From the Year 2006 to 2017.

Note. Parentheses show p values. *, **, and *** represent statistical significance at 10%, 5%, and 1% levels, respectively. GDP = gross domestic product.
Mediation Results
Table 6 represents the Sobel test results of mediation analysis for consumption, investments, government expenditure, and net exports. Table shows the path regression coefficients, their standard errors, and z values. The left-hand side of the table shows the regression results for cat-fat LC on GDP through different paths and the right-hand side expresses the results for cat-nonfat LC on GDP through four different paths. As we already know that there is significant negative relationship between LC and GDP, the only question at hand is whether LC partially affects GDP through consumption, investment, government expenditure, and net exports or not. According to the results, we conclude that cat-fat LC affects GDP directly as well as indirectly through consumption, investment, government expenditure, and net exports. However, cat-nonfat LC affects GDP directly as well as via consumption, and government expenditure but not through investment and net exports. Overall conclusion is that LC affects consumption, investment, government expenditure, and net exports, which ultimately affects economic output.
Mediation Analysis for the Impact of Liquidity Creation on Economic Output Through Consumption, Investment, Government Expenditure, and Net Exports Using Sobel Test. Coefficient Represent Paths a and b Coefficients From Lagged Value of Liquidity Creation Cat-Fat and Cat-Nonfat to Each Mediator and From Each Mediator to GDP per capita. Z values are Calculated on the Basis of Coefficients and Standard Errors, Following

LC = liquidity creation; GDP = gross domestic product.
Table 7 presents the results for mediation analysis for the impact of liquidity created by small banks on GDP thorough consumption, investment, government expenditure, and net exports. Left-hand side of the table shows that how cat-fat LC affects GDP through the aforementioned channels and right-hand side depicts how cat-nonfat LC affects GDP through different channels. Both types of liquidities created by small banks affect GDP through consumption, investment, and government expenditure channels but not through net exports. Table 8 shows the mediation analysis results for large banks. Cat-fat LC by large banks also affect GDP through three channels except net exports. On the contrary, cat-nonfat measure does only affect economic output through consumption and government expenditure channel but not through investment and net exports channel.
Mediation Analysis for the Impact of Small-Bank Liquidity Creation on Economic Output Through Consumption, Investment, Government Expenditure, and Net Exports Using Sobel Test. Coefficient Represent Paths a and b Coefficients From Lagged Value of Liquidity Creation Cat-Fat and Cat-Nonfat to Each Mediator and From Each Mediator to GDP per capita. Z values are Calculated on the Basis of Coefficients and Standard Errors, Following

LC = liquidity creation; GDP = gross domestic product.
Mediation Analysis for the Impact of Large-Bank Liquidity Creation on Economic Output Through Consumption, Investment, Government Expenditure, and Net Exports Using Sobel Test. Coefficient Represent Path a and b Coefficients From Lagged Value of Liquidity Creation Cat-Fat and Cat-Nonfat to Each Mediator and From Each Mediator to GDP per capita. Z values are Calculated on the Basis of Coefficients and Standard Errors, Following

LC = liquidity creation; GDP = gross domestic product.
Conclusion and Future Research
This study explores the impact of LC on economic output in case of China. It finds that bank LC significantly negatively affects economic output. It also finds that the impact of small-bank LC on GDP is stronger than the large-bank LC. It also concludes that the variation in current year’s GDP is only explained by current and previous year’s LC, and further lags of independent variables do not explain variation in current year’s economic output. The mediation analysis shows that cat-fat LC affects GDP through changes in consumption, investment, government expenditure, and net exports but cat-nonfat LC affects through all these channels except net exports.
The in-depth understanding of the relationship between bank LC and economic growth provides guidance to Chinese policymakers for better policy formulation. As the small-bank LC strongly affects GDP compared to large banks, so careful policies should be made for small banks. Private consumption and investment channels have been recognized as the most effective channels so the policymakers must take these channels into consideration for better management of economy. As far as the future research is concerned, the same analysis may be done for developed and under-developed countries.
Footnotes
Declaration of Conflicting Interests
The author(s) declared no potential conflicts of interest with respect to the research, authorship, and/or publication of this article.
Funding
The author(s) disclosed receipt of the following financial support for the research, authorship, and/or publication of this article: This research was supported by the National Natural Science Foundation of China (no. 12026239, 71872034), Scientific Research Project of Liaoning Education Department(LN2020J35), Research Project of Dongbei University of Finance and Economics (DUFE2020Y22).