
Abstract
This paper attempts to analyze the effects of China’s outward direct investment on environmental pollution in selected South Asian countries from 2004 to 2019 under framework of environmental Kuznet curve hypothesis. This empirical work is accomplished through fully modified ordinary least square. The findings of the full panel of fully modified ordinary least square indicates that China’s outward direct investment significantly spurs carbon emissions by (9.9%), which destroy the environment quality in the region. However, the estimated coefficients of the full panel of the fully modified ordinary least square indicates that (+) and (−) values of GDP and GDP square validate the environmental Kuznet curve hypothesis existence in the South Asia economies. Furthermore, when taking the individual countries, the environment consequences, individual characteristics of the countries and the GDP growth shows various temporal pattern of KEC hypothesis. Like in India there exist inverted U-shape curve, while Pakistan and Nepal manifest U-shape curve, whereas Bangladesh shows N-shape curve. Furthermore, this paper has identified bidirectional causality between economic growth, energy, financial development and carbon emissions. The empirical evidence implies that when governments consider foreign direct investment, they should priorities environmental protection mechanisms.
Introduction
The emerging economies, which were previously acted as passive observers of foreign direct investment, have transformed themselves into significant active participants in expanding their international markets (Nolan et al., 2002). China is widely recognized and has been emerged as a global economic power-house since its opening up and economic reforms of 1978 (Muhammad et al., 2014). Due to industry up-gradation and economy transition China’s ODI steadily increased (Wang & Zhao, 2017). From the last few decades, China has evolved to become a significant source of overseas direct investment in the global economy. China’s ODI was near zero in the early 1970 and 1980s. China started to develop in the 1990s, quickly grew in the early 2000s, and expanded rapidly after the 2008s (Muhammad et al., 2014). With China’s gradual economic revolution and international participation, its outward direct investment policy faced several revolutionary changes that reflect China’s enduring pursuit of national interest in the past few decades (Buckley et al., 2007; Voss, 2011). This policy has a massive impact on China’s outward direct investment (Tingley et al., 2015). The China’s outward direct investment policy was passed through different stages. The phase-1 of China’s ODI, comprised over the period 1978 to 1991. China started its open-door policy in the early 1970s and initiated the state drive market-based economy, that also known as the opening up and reform policy. During the period 1980 to 1990, China re-employed and strict the centralized control over the ODI, and all ODI approvals are made by the State council, national planning commission, or Central government because the Chinese Government feared, loss of control over the government property held abroad due to its cost of supervision at the distance and the lack of experience of Chinese organizations in the international competition (Ding, 2000). Only a few state-owned enterprises (SOEs) granted permission to enhance their overseas investment (Zhang, 2003). Later that year, in 1991, the state planning commission proposed to strengthen the management of ODI projects. This opinion became the guiding ideology of China’s ODI projects and it also became the major tenet of China’s ODI policy (Li, 2016).
The phase-2, of China’s ODI, consisted of 1992 to 1999 also was known as the expansion and regulation period. At the start of the 1990s, China implemented a string of reforms to carefully encourage the ODI and advance the reforms of state-owned enterprises to create a market mechanism in its formerly planned economy (Bach et al., 2006). In that era, ODI became part of China’s plan for economic development (Zhang, 2003). The domestic market was pushed by their respective Chinese provinces and authorities to become a part of international business activities and a big surge in Chinese ODI was seen in 1993 with an annual outflow jumping to 4.4 billion US dollars (UNCTD, 2000). In 1997, as a result of Asian financial crisis, a subsequent collapse of large companies impeded ODI liberalization (Ding, 2000). Consequently, the number of ODI projects declined in 1998 (Lin & Schramm, 2003).
The phase-3 of China’s ODI comprised over 1999 to 2009 that was known as go global and access to world trade organization (WTO). The Chinese government instigated “go global” in 1999 and formally initiated this policy in 2000 (Voss, 2011). The main objective of that plan was to push the state-owned enterprises to go global and to improve their competitiveness in the international market (Sauvant, 2005). The phase-4 of China’s ODI started from 2010 to onward. In 2012, China’s 18th National Congress of the Chinese Communist Party suggested accelerating the process of “go global” and enhancing the Chinese organization’s ability to operate worldwide and to constitute a group of multinational companies at the world level (Li, 2016). In 2013, the belt & road initiative (BRI) was announced by the Chinese President to provide the strategic support of Chinese enterprises to go global. In 2014, China initiated to establish the Asian Infrastructure Investment Bank to supply funds for BRI’s projects and the third session of the 15th National People Congress wanted to integrate the BRI into the regional development and opening up (Zhai, 2018).
Specifically, the Chinese outward direct investment attracted world attention in 2001, the Chinese government implemented a “going out” strategy to facilitate and encourage Chinese enterprises to promote outward direct investment and this strategy proved as a milestone to improve China’s competitiveness in the world market. China has substantial capital surplus and the China has started its overseas direct investment in 2000 (Buckley et al., 2007). After the USA, China is the second largest investor in the world. Figure 1 presents the distribution of Chinese ODI world-wide in 2019. Its total outward direct investment reached 138,134.6 million US$, whereas, in Asia its ODI reached 116,868.4 million US$, Africa 471.98 million US$, Europe 8,073.6 million US$, Latin America 7,566.9 US$, North America 3,407.85 million US$ and Oceanic reached 1,725.79 million US$ respectively. Figure 1, illustrates that Asia is the largest recipient of China’s ODI. In 2019, more than 50% of China’s total ODI reach to Asia and lowest share of China’s ODI goes to Africa. As compared to China’s ODI with the world economies for instance China’s ODI was increased by 87.8 billion US dollars in 2012, whereas outward direct investments from developed countries reduced by 274 billion dollars and in the same period, that is (2012) China’s outward direct investment in the Asia reached up to 64.785 billion dollars (Muhammad et al., 2014).
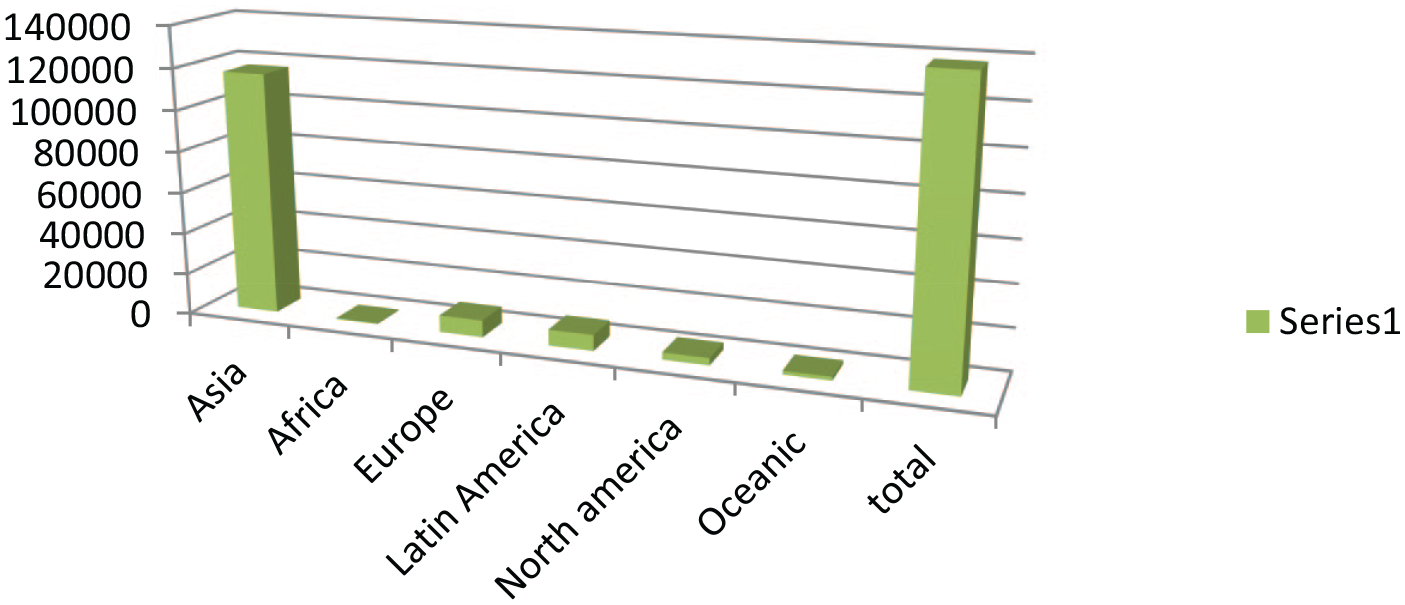
Distribution of China’s ODI in 2019 (million US$).
After the start of BRI China’s outward direct investment substantially increased by 174.3% in OBOR counties from 56.2 billion US dollars to 154.4 billion US dollars (Wu & Chen, 2019). On other hand South Asian countries having larger investment-saving gaps. They are unable to generate essential capital for economic development and they are totally relying on external capital. The South Asia is a big market in size about 24% of the total population (Muhammad et al., 2014). Figure 2 shows the trend of Chinese outward direct investment in selected south Asian counties from 2004 to 2019.

China’s outward direct investment in South Asia.
Now, China became a major supplier of outward direct investment in the world and its speed is increasingly attracting the world’s attention over the last few years (Cheung & Qian, 2009). Earlier China’s outward direct investment focused on mines and energy sectors, this trend has changed now shifts from natural resources to high-tech and consumption-oriented. It has been seen that technology, financing, real estate, agribusiness, and health care are the preferred target zones of China’s ODI. The investment in these sectors can cause environmental concerns. However, there is still an awareness gap among the Chinese outward enterprises in terms of the challenges and risks of overseas investment. As per the UNDP report, Chinese enterprises investing abroad consider the regulatory environments as their largest operational risks, although the majority of them expressed fewer concerns regarding the environmental effect of doing business.
Generally, the hosting nations are the key to environmental effects of outward foreign direct investment, since the investors are expected to follow the norms and regulations in their host countries. However, the environmental governance in the host countries is weaker, then the role of international investor becomes very critical. Consequently, Chinese outward companies should aware themselves with and actively follow the China’s own international standards and policies on environment responsibilities, rather than of relying exclusively on the host economies own regulations. In response to the international and domestic concerns, the Chinese government, have issued 33 key guidelines and policies initiatives to promote the sustainable development of Chinese enterprises abroad, which touch upon environmental performances that encourage and guide better behavior by Chinese outward enterprises. In 2013, the Ministry of Commerce China and the Ministry of Environmental Protection China together issued the “Guidelines on Environmental Protection in Overseas Investment and Cooperation,” particularly emphasizes on environmental effects. Furthermore, many Chinese financial institutions have established guidelines on the environmental impact assessments for investments abroad, it has been seen in the 2008 “Environmental Protection Policies of the Export and Import Bank of China” and the 2011 “Framework for Environmental Impact Assessments.” The Asia Foundation is currently working with several Chinese CSOs on programs aimed to strengthening the Chinese outward enterprises’ compliance with environmental standards (Huang, 2016).
The South Asian countries are the biggest partner of China’s BRI. According to China Academy of Social Sciences (2019), amount of tourist visits increased by 77% from China to its BRI partner countries in the last 5 years and this growth is not carrying on without adverse consequences on Co2 (Shan et al., 2018; Meng & Zhang, 2018). China is a world leader in greenhouse gas emissions, generating together with India and other Asian countries almost half of the total world carbon dioxide emissions (Levi, 2015). According to Peng et al. (2017), Chinese investors invested in 240 coal power plants in various belt & road countries during the period from 2001 to 2016. The relocation of the polluting industries from China to those economies that have weaker labor and environmental standards is considered the environmental concern.
Prior studies mainly focus on the impact of Chinese foreign direct investment on economic growth such as Ali and Wang (2018) and Ameer et al. (2017) studied the association between economic growth and foreign direct investment at the macro-economic level in China. On contrary, You and Solomon (2015) examined the association between economic growth and foreign direct investment using firm-level data in China. Wu et al. (2020) analyzed the relationship between China’s FDI and economic growth using city-level data in China. Similarly, Abdulsalam et al. (2021) analyzed the relationship between China’s foreign direct investment and economic growth in 25 countries of Asia. But many researchers have given less attention to the environmental effect of China’s foreign direct investment.
In this regard, little empirical literature has been established, only a few studies have been conducted to examine the environmental effect of Chinese foreign direct investment. Al-Aameri et al. (2012) claimed that increases in Chinese foreign direct investment have affected the environment in South America, Myanmar, Mongolia, and Zambia. Hao et al. (2020) studied that China’s ODI has enhanced domestic environmental pollution by improving the economic scale. David (2016) studied the environmental effect of China’s investment in Africa and authors found that China’s investment in Africa promotes environmental degradation. But the environmental effects of China’s ODI in South Asian countries has ignored in the existing literature. Therefore, this study tries to fill the research gap. So, the purpose of this study is to empirically examine the role of China’s foreign direct investment on carbon emissions in selected South Asian countries. This study attempts to find the growth, energy, financial development, and environmental degradation nexus under the EKC framework. The contribution of this study is the first empirically examined the role of China’s outward direct investment on environmental degradation to overcome the vacuum in the existing studies by adding up some plausible variables under environment Kuznet curve hypothesis.
This paper used the most recent data along with vigorous models and recent econometric techniques the “fully modified ordinary least square (FMOLS).” This technique is adopted because all variables are stationary at their first difference form. So, cointegration test can be used for testing the existence of long run relationship among the variables. If the test finding does not show the existence of cointegration or long run nexus, then Panel Vector Auto Regressive (PVAR) model should be used to examine the short run effect (Vo et al., 2019). In case of existence of cointegration among the variables, then FMOLS estimator can be used to estimate the long run equilibrium coefficient prior conducting the panel causality test. In this study, cointegration exist between variables, therefore, authors applied FMOLS. There is another reason to select the FMOLS. As per Phillips and Hansen (1990), usual OLS estimator is consistent but its limiting distribution is contaminated by second order biased terms. The existence of these second order bias terms invalidates the standard influence. Moreover, OLS estimates may suffer from serial correlation, heteroskedasticity since the omitted dynamics are captured by the residual so, that inference using the normal tables will not be valid even asymptotically. Therefore, “t” statistics for the OLS estimates are useless. Hence, authors selected an appropriate fully modified ordinary lest square. Wagner and Hong (2015) described the advantage of FMOLS in their study, as bigger the extent of serial correlation and/or regressor endogeneity the bigger are the performance advantages of fully modified ordinary lest square estimator and test statistics depends upon it. For sizeable serial correlation and endogeneity, the bias can be reduced by about 50% using fully modified ordinary least square instead of employ Ordinary Least Square (OLS) estimates.
The research question of current study mainly concentrated on the environmental sustainability. Present research look for answers to the following research questions. Does China’s ODI promote environmental degradation? Did economic development significantly reduce carbon dioxide emission? Did EKC hypothesis exists in South Asian region? Either economic growth can be attained in South Asia region without demolishing the environment? The empirical result of this study identifies that China’s outward direct investment significantly promotes carbon emission in the South Asia region. The remaining part of this paper is structured in the following sections 2 Literature Review, 3 Methodology, Data and Variables, 4 Results, 5 Discussion, 6 Conclusion and Policy Implication.
Literature Review
From 1970 to the start of the current century, the Chinese government adopted strict approval and examination system for overseas direct investment, and from 1999 to onward, it has been seen a gradual improvement in China’s economic strength and increasing the opening up and reform. The strict ODI policy modified and the Chinese government started to encourage overseas direct investment. Chinese outward direct investment gradually transferring from secondary industry to the tertiary industry as customer-oriented and value added (Xiong & Mallesons, 2015). The Chinese government is adopting diverse growth model for the upcoming stage of economic development includes structural adjustment process that changes China’s international investment environment (Lardy, 2012). The structural change in China’s home economy put pressure on domestic Chinese enterprises to enhance their productivity to move forward global value chain by increasingly developed countries for high value-added service and manufacturing operation like customer services, research & development, retail communication equipment and technology (Rosen & Hanemann, 2014).
The Chinese Government aims to enhance its influence, economic action and its strategic existence in the South Asia. For this, the Chinese Government expanded their diplomatic relations and strengthens the economic influence with neighboring countries, like Pakistan, Maldives, Afghanistan, Sri Lanka, Nepal, and Bangladesh etc. The South Asia region is dominant to the China’s BRI due its geographical and strategic location. South Asia is the crossing point between the “Silk Road Economic Belt” and the “21st Century Maritime Silk Road.” As, Xi Jinping elected as president of China in 2013, the Communist Party has signed more than 100 billion dollars investments contracts with South Asian countries and nearly half of that with the Pakistan. As per Finance Ministry of Pakistan the China’s foreign direct investment during (2018–2019) remained 31% which is 1/3rd of the Pakistan’s total inflow. For energy needs China has invested across the region and accounts for 47.3% of total outward direct investment for the South Asia. Currently, there are 17 CPEC energy-related projects are under-way with estimated amount of 14.5 billion dollars and greater than half of total amount for building of 04 coal power plants, whereas 2.4 billion dollars to construct 02 major hydropower facilities in Pakistan.
Investment development path theory is a widely recognized model to analyze outward direct investment. This theory claims that a consistent rise in the economic growth of a country is measured through per capita GDP is the result of significant changes in the inward and outward investment of a country. This theory assumed that in the early stages of development it evolves from being highly negative to become positive and finally fluctuating around zero once a nation is fully industrialized and developed. This theory gives more attention to the role of the Government in foreign direct investment (Dunning, 1986) and it is applicable to examine the Chinese outward direct investment. Earlier studies showed that inward FDI is the instrument for outward FDI and government struggles must be accredited to raise both types of investments while examining the overseas investment of a country (Liu et al., 2005). Furthermore, this theory asserts that the economic growth of a nation is influenced by two types of investments over time and it depends upon the Government policies. Thus the government is the key stakeholder under this theory. The key target of China’s “reform and open-door policy” is to improve its world-wide efficiency by using the overseas investment (Clegg et al., 2004).
After the inception of “Belt and Road Initiative” many Chinese government policies encourage the Chinese firms to go abroad as a result Chinese ODI remarkably increased (Du & Zhang, 2018; Li, 2016; Yu et al., 2019). China’s ODI brings lot of job creation (Wang et al., 2014). However, due to rapid development of Chinese foreign direct investment in the world some, scholars expressed their concerns that China’s ODI destroying environmental quality such as Al-Aameri et al. (2012), Hao et al. (2020), and David (2016). Some, other scholars explained the effect of foreign direct investment by two ways pollution heaven effect and pollution halo effect. Foreign direct investment (FDI) inward enhanced the carbon emissions when FDI came for pollution intensive sectors or “dirty” sectors. This phenomenon also called as the “pollution heaven effect” (An, Razzaq et al., 2021; Walter & Ugelow, 1979). However, many other researchers also testified the pollution heaven hypothesis by investigating the effect of FDI on environmental degradation (Cole, 2004; Lan et al., 2012; Long et al., 2018). Secondly, inward FDI minimize the environmental pollution and can improve the environmental quality when foreign direct investment comes for green and advanced technological industries this phenomenon called as “pollution halo effect” Some studies proved pollution halo effect in their research findings (Chandran Govindaraju & Tang, 2013; Lee, 2009; Zarsky, 1999). Whereas, Dong et al. (2021) examined does environmental regulations affect the growth pattern of Chinese investment in host countries. They employed difference-in-difference (DID) approach using a data set from 2008 to 2018. Their findings showed that host countries where environmental regulations are relaxed attract more Chinese direct investment from polluting industry. Mahadevan and Sun (2020) examined the influence of Chinese foreign direct investment on Co2 emissions in “Belt & Road countries.” Their findings showed that the effect of China’s FDI in host countries on carbon emission is heterogeneous in nature. China’s FDI has shown no effect on carbon emission in upper and middle income nations of “Belt & Road countries” and it has reducing effect on low income countries and an increasing effect on “lower middle income economies of belt & road countries” Based on the above literature, authors formulate the hypothesis for empirical testing.
For the achievement of economic growth financial sector development plays a significant role. Many researchers believe that financial sector development can inspire the speed of economic growth if the financial markets invite foreign direct investment and look for higher investment in research and development (Frankel & Romer, 1999). Some researchers think that financial development can keep the environment less polluted, production & manufacturing of the economic friendly products resultantly increase the sustainable development, at the regional, national and global level (Birdsall & Wheeler, 1993; Frankel & Rose, 2002). It is blamed that financial development may cause in raising the Co2 emission due to its encouragement of producing more goods. For this, financial sector, development has a direct impact on energy utilization (Islam et al., 2013; Sadorsky, 2011; Tamazian & Bhaskara Rao, 2010). On another hand, some scholars claimed that financial sector development decreased the cost of borrowing and it provides larger opportunities of investment (Shahbaz et al., 2012). It improved the effectiveness of the energy and greatly likely, to reduce carbon emission (Tamazian & Bhaskara Rao, 2010). Governments can benefit from the financial development, which can finance some development projects relating to technology innovation (King & Levine, 1993) which in turn, significantly reduce carbon emission by adopting efficient energy consumption. Kumbaroğlu et al. (2008) and Ozturk and Acaravci (2013) found that financial development does not have any significant impact on Co2 emission and a study conducted by Uddin et al. (2017) concluded that financial development negatively impacts the environment, and some studies, come up with an insignificant relationship between environmental degradation and financial development such as Bekhet et al. (2017), Ozturk and Acaravci (2013), Omri et al. (2015), and Çoban and Topcu (2013) found mixed and insignificant results. Based on the above literature authors formulate the below hypothesis.
Energy utilization can foster the economic growth of a nation that also contributes to increase environmental degradation. It is observed that economic expansion leads to enhance energy utilization that ultimately pollutes the environmental quality. Many research results indicate that energy utilization produces combustion goods that are mainly related to Co2, which destroy the environment. Various findings showed that an increase in energy utilization can consequence more rise in carbon emissions. Chang et al. (2018), used quantile regression in 65 countries and found that carbon emission can be increased by energy consumption. Similarly, Boamah et al. (2017) used quantile regression and revealed that energy consumption worsens the quality of the environment by promoting carbon emission in China. (Hossain, 2011) studied that energy consumption has an adverse impact on the environment. As per Perera and Lee (2013) energy consumption leads to produce combustion products that pollute the environment, and these combustion products also release solid and wastewater which cause carbon emissions. Anwar et al. (2021), examined the moderating role of the renewable and non-renewable energy in ASEAN nations in the context of environment-income nexus and their finding concludes that non-renewable energy stimulate the Co2 emission and renewable energy decrease carbon emission and Rafiq et al. (2016) examined that non-renewable energy consumption increased carbon emission. Based on above arguments authors formulate the below hypothesis for empirically testing.
Global warming has become an important environmental problem that is mainly attributed to carbon dioxide emissions. There are various studies relating to carbon emission. Some studies used granger causality between the economic growth and carbon emission by employing vector error correction and multivariate co-integration approaches (Ang, 2007; Soytas & Sari, 2009). Some studies used the environment Kuznet curve. Since the theory behind the environment Kuznet curve originated in the 1990s, initially this idea was presented by Kuznets (1955). Several economists and researchers focused their concentration on the environment linkages under the framework of the environment Kuznet curve in their empirical and theoretical analyses (Brock & Taylor, 2004; Grossman & Krueger, 1991; Shafik & Bandyopadhyay, 1992). It was supported by many researchers in their empirical studies (Selden & Daqing, 1994; Vincent, 1997). Carbon emissions are closely related to economic development. As per the environment Kuznet curve theory at the early stage of economic development, environmental pollution, increased but it’s tended to reverse at the income turning point (Grossman & Krueger, 1991). There are three stages of the environment Kuznet curve which showed that initially economic growth deteriorates the environment quality at the threshold level, after reaching the maximum point then curve moves downward so, the carbon emission and economic growth relationship is negative (Wen et al., 2021). However, when high level development and economic growth achieved the concern about the environment emerged in Figure 3. Therefore inverted-U shaped environment Kuznet curve is supported as evidence by various researchers. Many scholars tested the environment Kuznet curve in their studies like Mrabet and Alsamara (2017), Rafiq et al. (2016), and Charfeddine and Mrabet (2017), they confirmed the presence of the environment Kuznet curve while Ozturk and Acaravci (2013) and (Al-Mulali et al., 2015) rejected the existence of the environment Kuznet curve in the lower middle and low-income countries. However, they confirmed the presence in high income and upper-middle-income countries. Alam and Adil (2019) examined the existence of EKC hypothesis in India, using ARDL bond testing approach. Their findings indicate that “environmental Kuznet curve hypothesis” did not hold in India. Similarly, Khed (2016) also studied the nexus between environmental degradation and economic growth using time series data between 1991 and 2014. Authors concluded that EKC hypothesis failed to explain the inverted U-shaped association between GDP and Co2 emission in case of India. Based on the above literature this paper test the below hypothesis. It has been observed that due to advancement and modern use of technology, energy consumption substantially increased across the world. Many scholars in their studies used various explanatory variables to test the EKC hypothesis (Al-Mulali & Ozturk, 2016; Charfeddine & Mrabet, 2017; Mrabet & Alsamara, 2017; Ozturk & Acaravci, 2013). However Acheampong et al. (2019) also confirmed the environment Kuznet curve hypothesis in the sub-Saharan countries. According to Salahuddin et al. (2018) and Farhani and Ozturk (2015) an environment, Kuznet curve study inveterate that an increase in GDP does not always reduce carbon emission. Whereas, Cicea et al. (2014) and Ibrahim and Law (2014) conducted a study on cross-sectional data and concluded mixed findings. Furthermore, Al-Mulali and Ozturk (2016) identified a U-shaped association between GDP and Co2 emissions. The carbon emission growth association can be tested in the hypothesis.

Environmental Kuznet Curve.
Finally, China’s foreign direct investment mainly flows to construction of roads, rails, pipelines and other building constructions such as coal power plants in Asia but China’s foreign direct investment to South Asian countries for industry digitalization is lacking. Morkovkin et al. (2020) analyzed and introduced the tools and technologies of the industry 4.0 concept and possibilities of use of industry 4.0 for digital transformation of Russian industry. In Russia this concept is accessible until 2035. Industry 4.0 concept covers many technologies but “Big Data” and “Smart Factory” define this concept well and its key effect is technology integration. Industry4.0 can reduce the production cost and it can bring various other benefits. Similarly, economic digitalization has similar advantages and it can increase the efficiency of the national economy. So, in this current age of development industry 4.0 is important for industry transition. Technology development in the context of digital economy requires reorientation of technological and engineering system that could affect the traditional industries that leads toward industrial transformation along-with it can bring improvement in industrial policy and business development models. It is concluded that introducing similar technologies in South Asian countries can reduce the industry safety risk, production cost and it can also reduce environmental cost. As China has capital surplus, and Chinese companies has the opportunities to invest in technology development, digital industry transformation which ultimately save environmental cost in South Asia.
An and Mikhaylov (2020) conducted a study on “Russian energy projects in South Africa.” Authors analyzed the cost of 1 kW electricity produced by coal power projects in the South Africa and then compared the nuclear electricity with green energy. In their finding they mentioned that renewable energy has a potential to reduce poverty in the South Africa. However, imported crude oil is likely more suitable for refining industry of the South Africa. Moreover they also highlight that bio-energy can become the major source of energy in the South Africa. At present South Africa is the major highest emitter of CO2. Authors mentioned in their article that in long run nuclear energy not only supplying excess energy in the South Africa but also contribute to the “soft” transition from the coal-fired power plant to environment friendly green technology. An, Mikhaylov et al. (2021) analyzed the network revenue management issues from viewpoint of the minimax regret criteria and they introduced linear programing (LP) “solvable mathematical programs” to resolve large-scale issues for hotels, cruises and airlines. This literature indicates that nuclear energy can protect the environment through green technology. The above literature briefly discussed and signifies that no study has been conducted so far to investigate the impact of Chinese foreign direct investment on environment degradation that the current study proposes.
Methodology, Data, and Variables
This work tries to investigate the effects of Chinese ODI, growth-led, energy, and financial development in the South Asia region and the extent that the agenda of sustainable development affects this casual association. There is observed that increase in modern use of transportation and technology energy consumption substantially increased globally. Various empirical studies such as Apergis and Ozturk (2015), Jun et al. (2021), and Jebli et al. (2016) used different explanatory variables under the framework of the environment Kuznet curve hypothesis in the growth emission nexus. Many researchers and policymakers used the GDP square term to assess the environment kuznet curve hypothesis regarding pollution, incomes, and other variables in the field of environmental economics. This study used the theoretical framework of Grossman and Krueger (1991) to analyze the growth emission nexus. The theoretical framework of the environment kuznet curve hypothesis is given in the econometric model in equation (1).

Where

Furthermore, the effect of Chinese outward direct investment (ODI), economic growth, energy utilization, and financial development (FI) on carbon dioxide emission is presented in equation (3)

This study employed the CD-test explained in Pesaran (2004, 2015). This study finds that there exists cross-sectional dependence. Before estimating the co-integration test, it is essential to check the stationary of the model. It is also necessary to investigate the presence of unit root for its long-run relationship of independent and dependent variables. For the co-integration estimation, the order of the integration might be similar for all the variables. Maddala and Wu (1999) proposed various unit root tests hence, this study used two tests, that is, Levin et al. (2002) and Harris and Tzavalis (1999) unit root test to control the issue for non-stationary data because the regression result will be spurious or biased if variables are non-stationary. The LLC test is common developed by Hadri (2000) and Breitung (2000). The homogenous or identical cross-section is the assumption of this test. The “Augmented Dickey-Fuller” approach is the extension of LLC test and its assumption is cross-sectional independence included in the autoregressive coefficients under ADF. Harris and Tzavalis (1999), unit root test has also a null of unit root versus an alternative with a single stationary value. This test is performed for those data sets which comparatively short in T. As no evidence exist for unit root in the panel data. For serial correlation and endogeneity issues in the model, this study adopted a non-parametric technique developed by Pedroni (2004). The severe problems of endogeneity and autocorrelations can create nuisance issues and bias the findings of the estimated coefficients from the panel data least square regression, therefore this work employed the fully modified ordinary least square (FMOLS) estimation technique to find the long-run estimates of the variables. Generally, the Granger causality test is used to find the casual association between the outcome and independent variables along with its appropriate lagged values, but this study employed Dumitrescu and Hurlin (2012) panel causality test. Finally, the variance decomposition and impulse response are used in this study and empirical estimates of the variance decomposition analysis give robust statistical inferences.
As regard to variables and data sets, this paper used annual data of 05 selected South Asian counties including Pakistan, Bangladesh, Sri Lanka, Nepal, and India (2004–2019) because these South Asian countries are the neighboring countries and part of the China’s “Belt & Road Initiative.” Furthermore, South Asia region is considered as the hub and crossing point China’s “the Silk Road Economic Belt and 21st Centaury Maritime Silk Road” and mainly the China-Pakistan Economic Corridor also exist in this region. Moreover, the flow of China’s outward direct investment is more to this region, that’s why South Asian countries are selected for study. For empirical analysis, this research paper used carbon dioxide emissions as dependent variable (measured in million tons per year) as a proxy for environmental degradation. Other independent variables includes, GDP per capita (gross domestic product per capita constant US$ 2010) as the proxy of economic growth and GDP2 examining the existence of the EKC hypothesis, energy consumption, measured in (terawatt-hours per year) and financial development. Summary statistics is provided in Table 1.
Descriptive Statistics and Data Source.
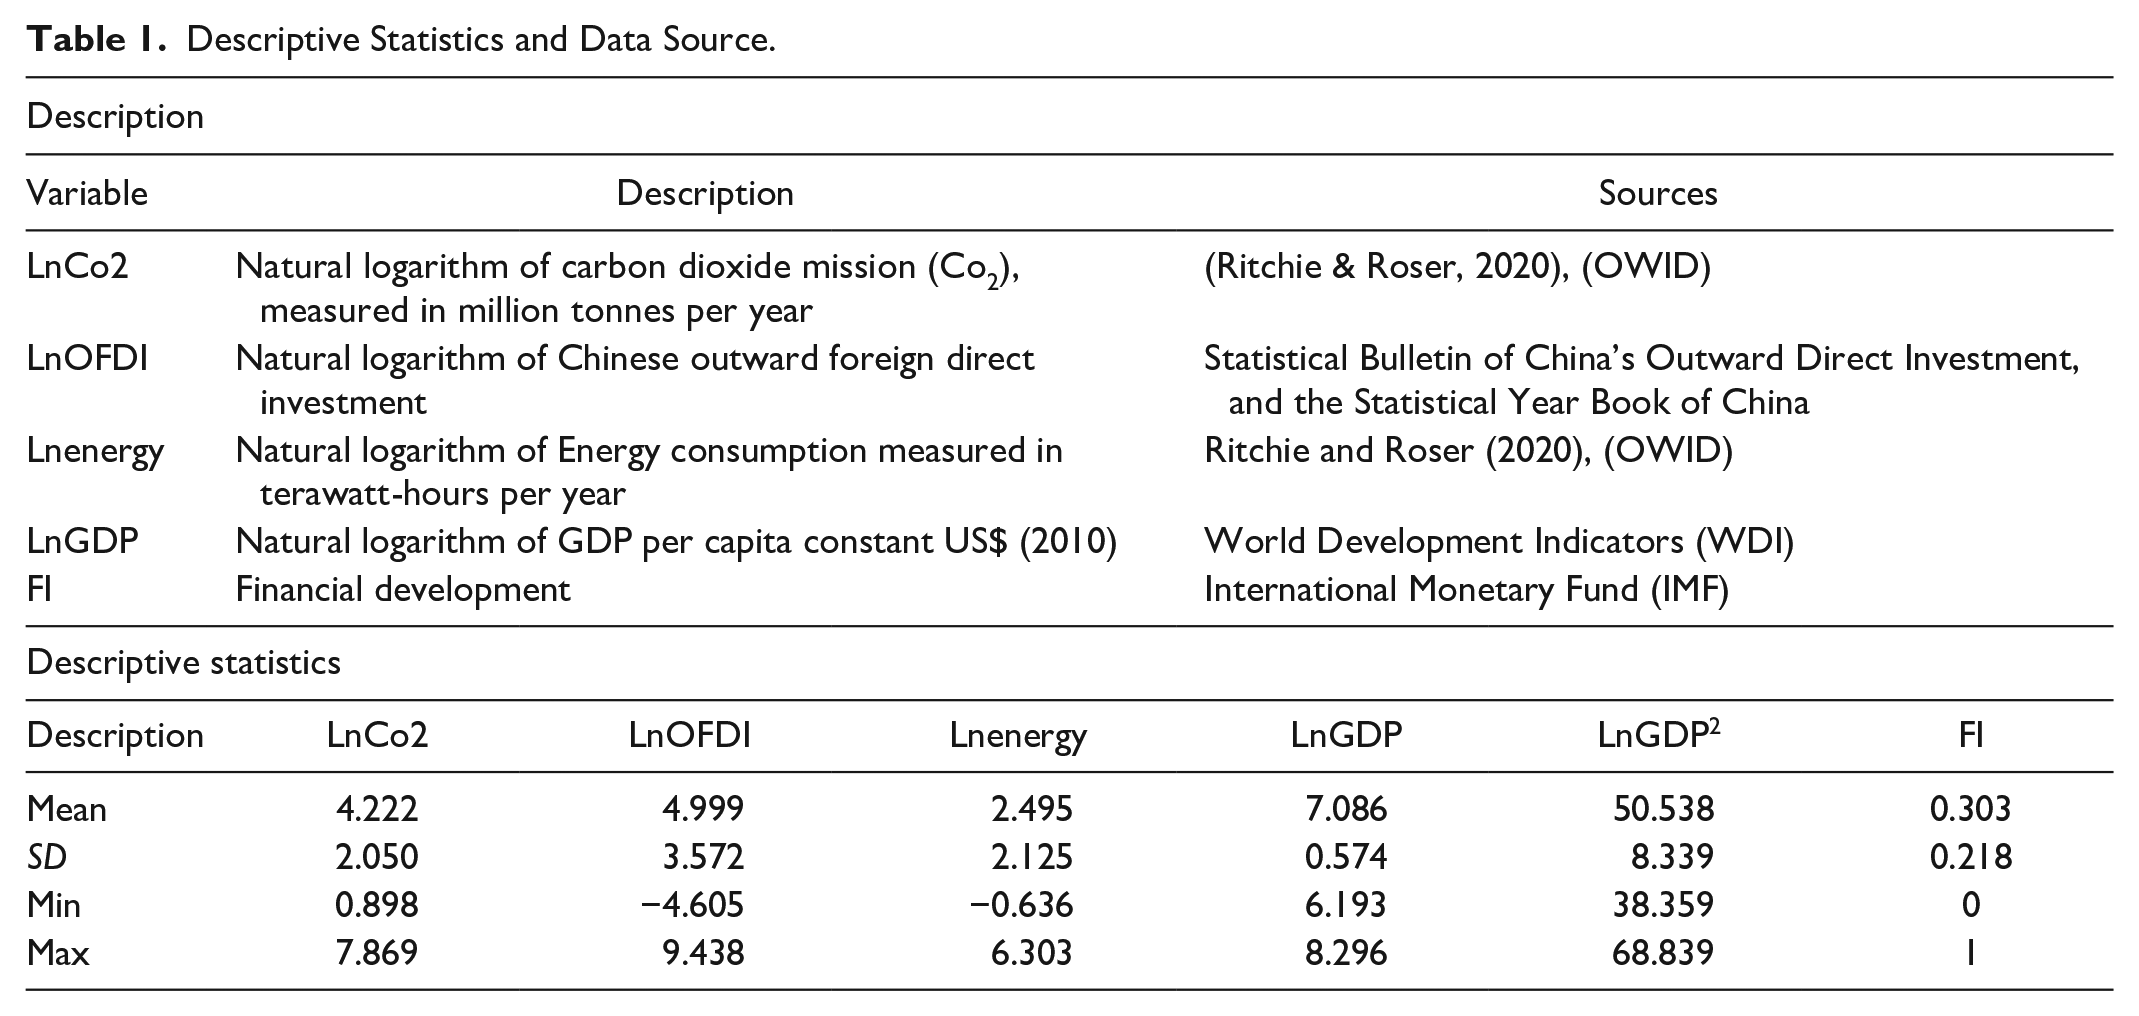
Descriptive statistics is important to describe the crucial feature of the empirical data. Table 1, reports the description of the variables along-with data source of each variable. Furthermore, Table 1, also describe the descriptive statistics of the variables like carbon emission, Chinese outward direct investment, energy consumption, gross domestic product per capita, and financial development. The mean value of carbon dioxide emission is 4.222, minimum value is 0.898, maximum value and standard deviation is 7.869, 2.050 respectively, whereas the mean value of lnOFDI is 4.999 with minimum value −4.605 and maximum value 9.438 and standard deviation 3.572. Energy consumption reports the mean value as 2.495, standard deviation 2.125 minimum and maximum values are reported as −0.636 and 6.303 respectively. The mean values of log GDP per capita and GDP square reported as 7.086 and 50.538, whereas their standard deviation values are reported as 0.573 and 8.399. However, their minimum and maximum values are 6.193, 38.359, 8.296, and 68.839. The financial development reports that 0 and 1 are minimum and maximum values whereas 0.303 and 0.218 reported as mean and standard deviation respectively. Kernel distribution function is used for data normality. Figure 4, illustrate that data is normally distributed.

Data normality distribution.
On the basis of literature review and hypothesis development authors presents the possible effects of the variables on carbon emission in Figure 5. It is expected that China’s ODI, energy consumption and economic growth would positively (+) promote carbon emission whereas; financial development and square term of GDP (−) reduced carbon emission in South Asia region. Figure 6, illustrate that India is largest producer of carbon emission whereas; Sri Lanka is the lowest producer of carbon emission in the region. Figure 7, presents the trends of GDP per capita in the region. It can be shown that Sri Lanka has the largest per capita income and Nepal has the lowest per capita income in the region. Similarly, India is the largest energy consumer and Nepal is the lowest energy consumer in the region, it can be seen in Figure 8. The financial development measures, how well-established financial markets and financial institutions in term of their liquidity and size, provide financial services to individuals and companies at lower cost in South Asia region with sustainable revenue. The trends of financial development in South Asia region is illustrated in Figure 9.

Possible Effects of Variables on Carbon emission.
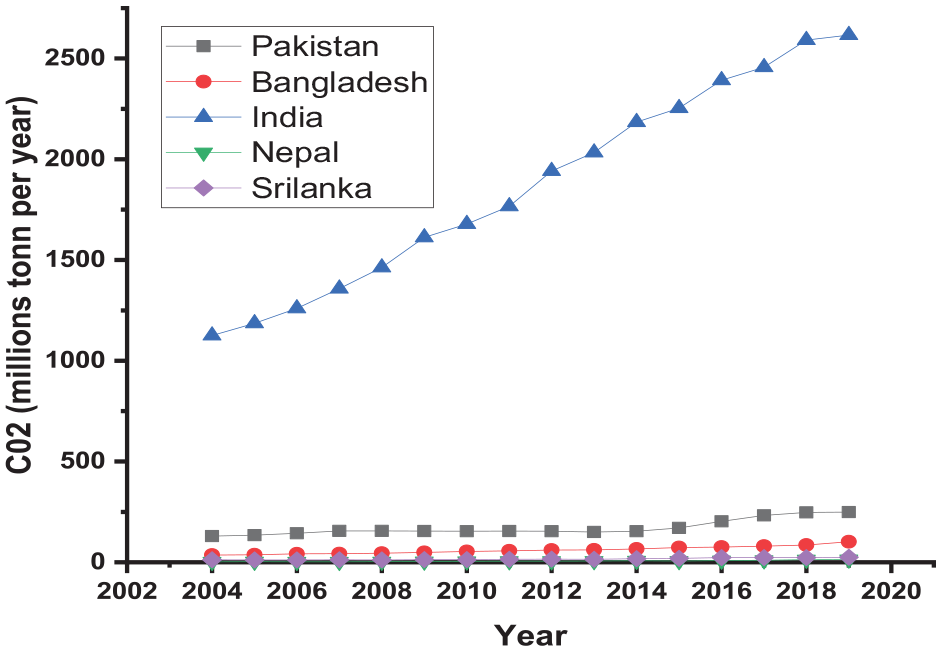
Trends of Carbon emission in Selected South Asian Countries.

Trends of GDP per capita in South Asian Countries.
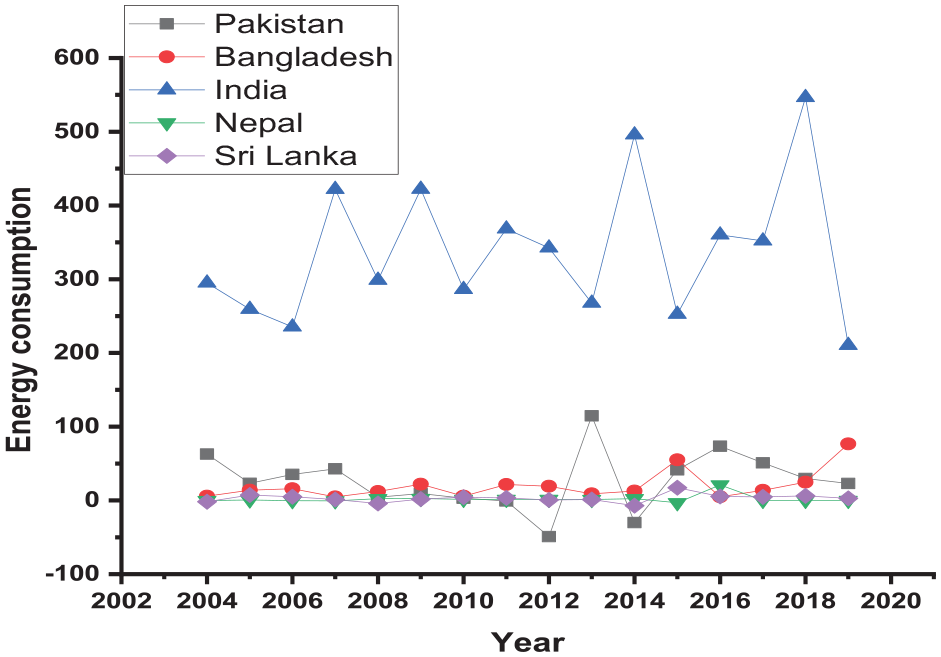
Trends of energy consumption in South Asian Countries.

Trends of financial development in South Asian Countries.
Results
The cross-sectional dependence test derive as a basic setup for empirical analysis of the panel data, which is used before determining the panel unit root test and this test is carried out by the various scholars (Dong et al., 2019; Rauf et al., 2018), consequently, authors used (Pesaran, 2004). The null hypothesis of the cross-sectional dependence test H0; that there is no cross-sectional dependence. The result presented in Table 2 indicates that there exists cross-sectional dependence.
Results of Cross-Sectional dependence Test.

Source. Author’s calculation.
Many times macroeconomic indicators have a unit root issue. In such circumstances the result of the estimation usually spurious or misleading. Consequently to examine the stationary of the variables authors imply two different unit root tests. Table 3, reports the result of the unit root test of Levin et al. (2002) and Harris and Tzavalis (1999). The outcome of these two tests shows that whole variables seem stationary at the first difference form.
Results of Panel Unit Root Test.

Source. Author’s calculation.
Before analyzing the relationship between the indicators, in the long run, all variables must be co-integrated. Table 4, report the statistical result of Kao (1999) and Pedroni (2004) using the Bartlett Kernell Method and Parzen Kernell Method all ADF statistics and their p-values are significant. It means a long-run association exists among the variables.
Results of Panel Cointegration Test (Kao, 1999). Statistical Result of Pedroni (2004) Cointegration.

Source. Author’s calculation.
p < .01. **p < .05. *p < .1.

Source. Author’s calculation.
p < .01. **p < .05.
Table 5, reports country-wise results of “fully modified ordinary least square technique.” The empirical findings indicate that (+) sing of GDP and (−) sign of GDP2 confirm the existence of EKC-hypothesis in India due to rapid GDP (economic growth). It means at the early stages of the development, Co2 emission grows when economic growth increases but Co2 emission begins to decreases when economic growth further increases after the threshold point. Chinese outward foreign direct investment is significantly reducing carbon emissions in Pakistan, India and Sri Lanka and promoting the carbon emissions in Bangladesh and Nepal. Furthermore, energy consumption in all countries promotes the environmental pollution except Pakistan because Pakistan is already facing huge energy shortage fall from the last many years. Financial development in all countries except India, reduce the environmental pollution. The empirical result demonstrate that 1% increase in Chinese OFDI leads to increase/decrease by 0.005%, −0.011%, −0.005%, 0.012%, and −0.010% respectively in Bangladesh, Pakistan, India, Nepal, and Sri Lanka Moreover, empirical findings show that energy consumption also has a positive association with carbon emission in Bangladesh, India, Nepal, and Sri Lanka. As 1% increase in energy consumption can lead to increase carbon emission by 0.017%, 0.002%, 0.067%, and 0.024% in Bangladesh, India, Nepal, and Sri Lanka. In Pakistan energy’s favorable correlation with environmental quality as 1% increase in energy reduce carbon emission by 0.002%. Finally, GDP growth established inverted U-shape curve for India, U-shape curve for Pakistan and Nepal, and N-shape curve for Bangladesh.
Results of Fully Modified OLS (Country-wise).

Source. Author’s estimation.
Table 6 reported the result of the full panel. The outcome revealed that the estimated coefficient of GDP has positively affected the carbon emissions and square of GDP is negatively affected the carbon emissions. The estimated coefficient of the both GDP and GDP square prove the presence of the EKC-hypothesis in the selected South Asian region. The estimated coefficient of Chinese outward direct investment and energy consumption describes positive association with carbon emissions whereas financial development improve the quality of the environment in South Asia region as shown the negative estimated coefficient and these empirical outcomes are consistent with Yang et al. (2017), Khattak et al. (2020), and Anwar et al. (2021).
Results of Fully Modified OLS (FMOLS): Full Panel.

Source. Author’s estimation.
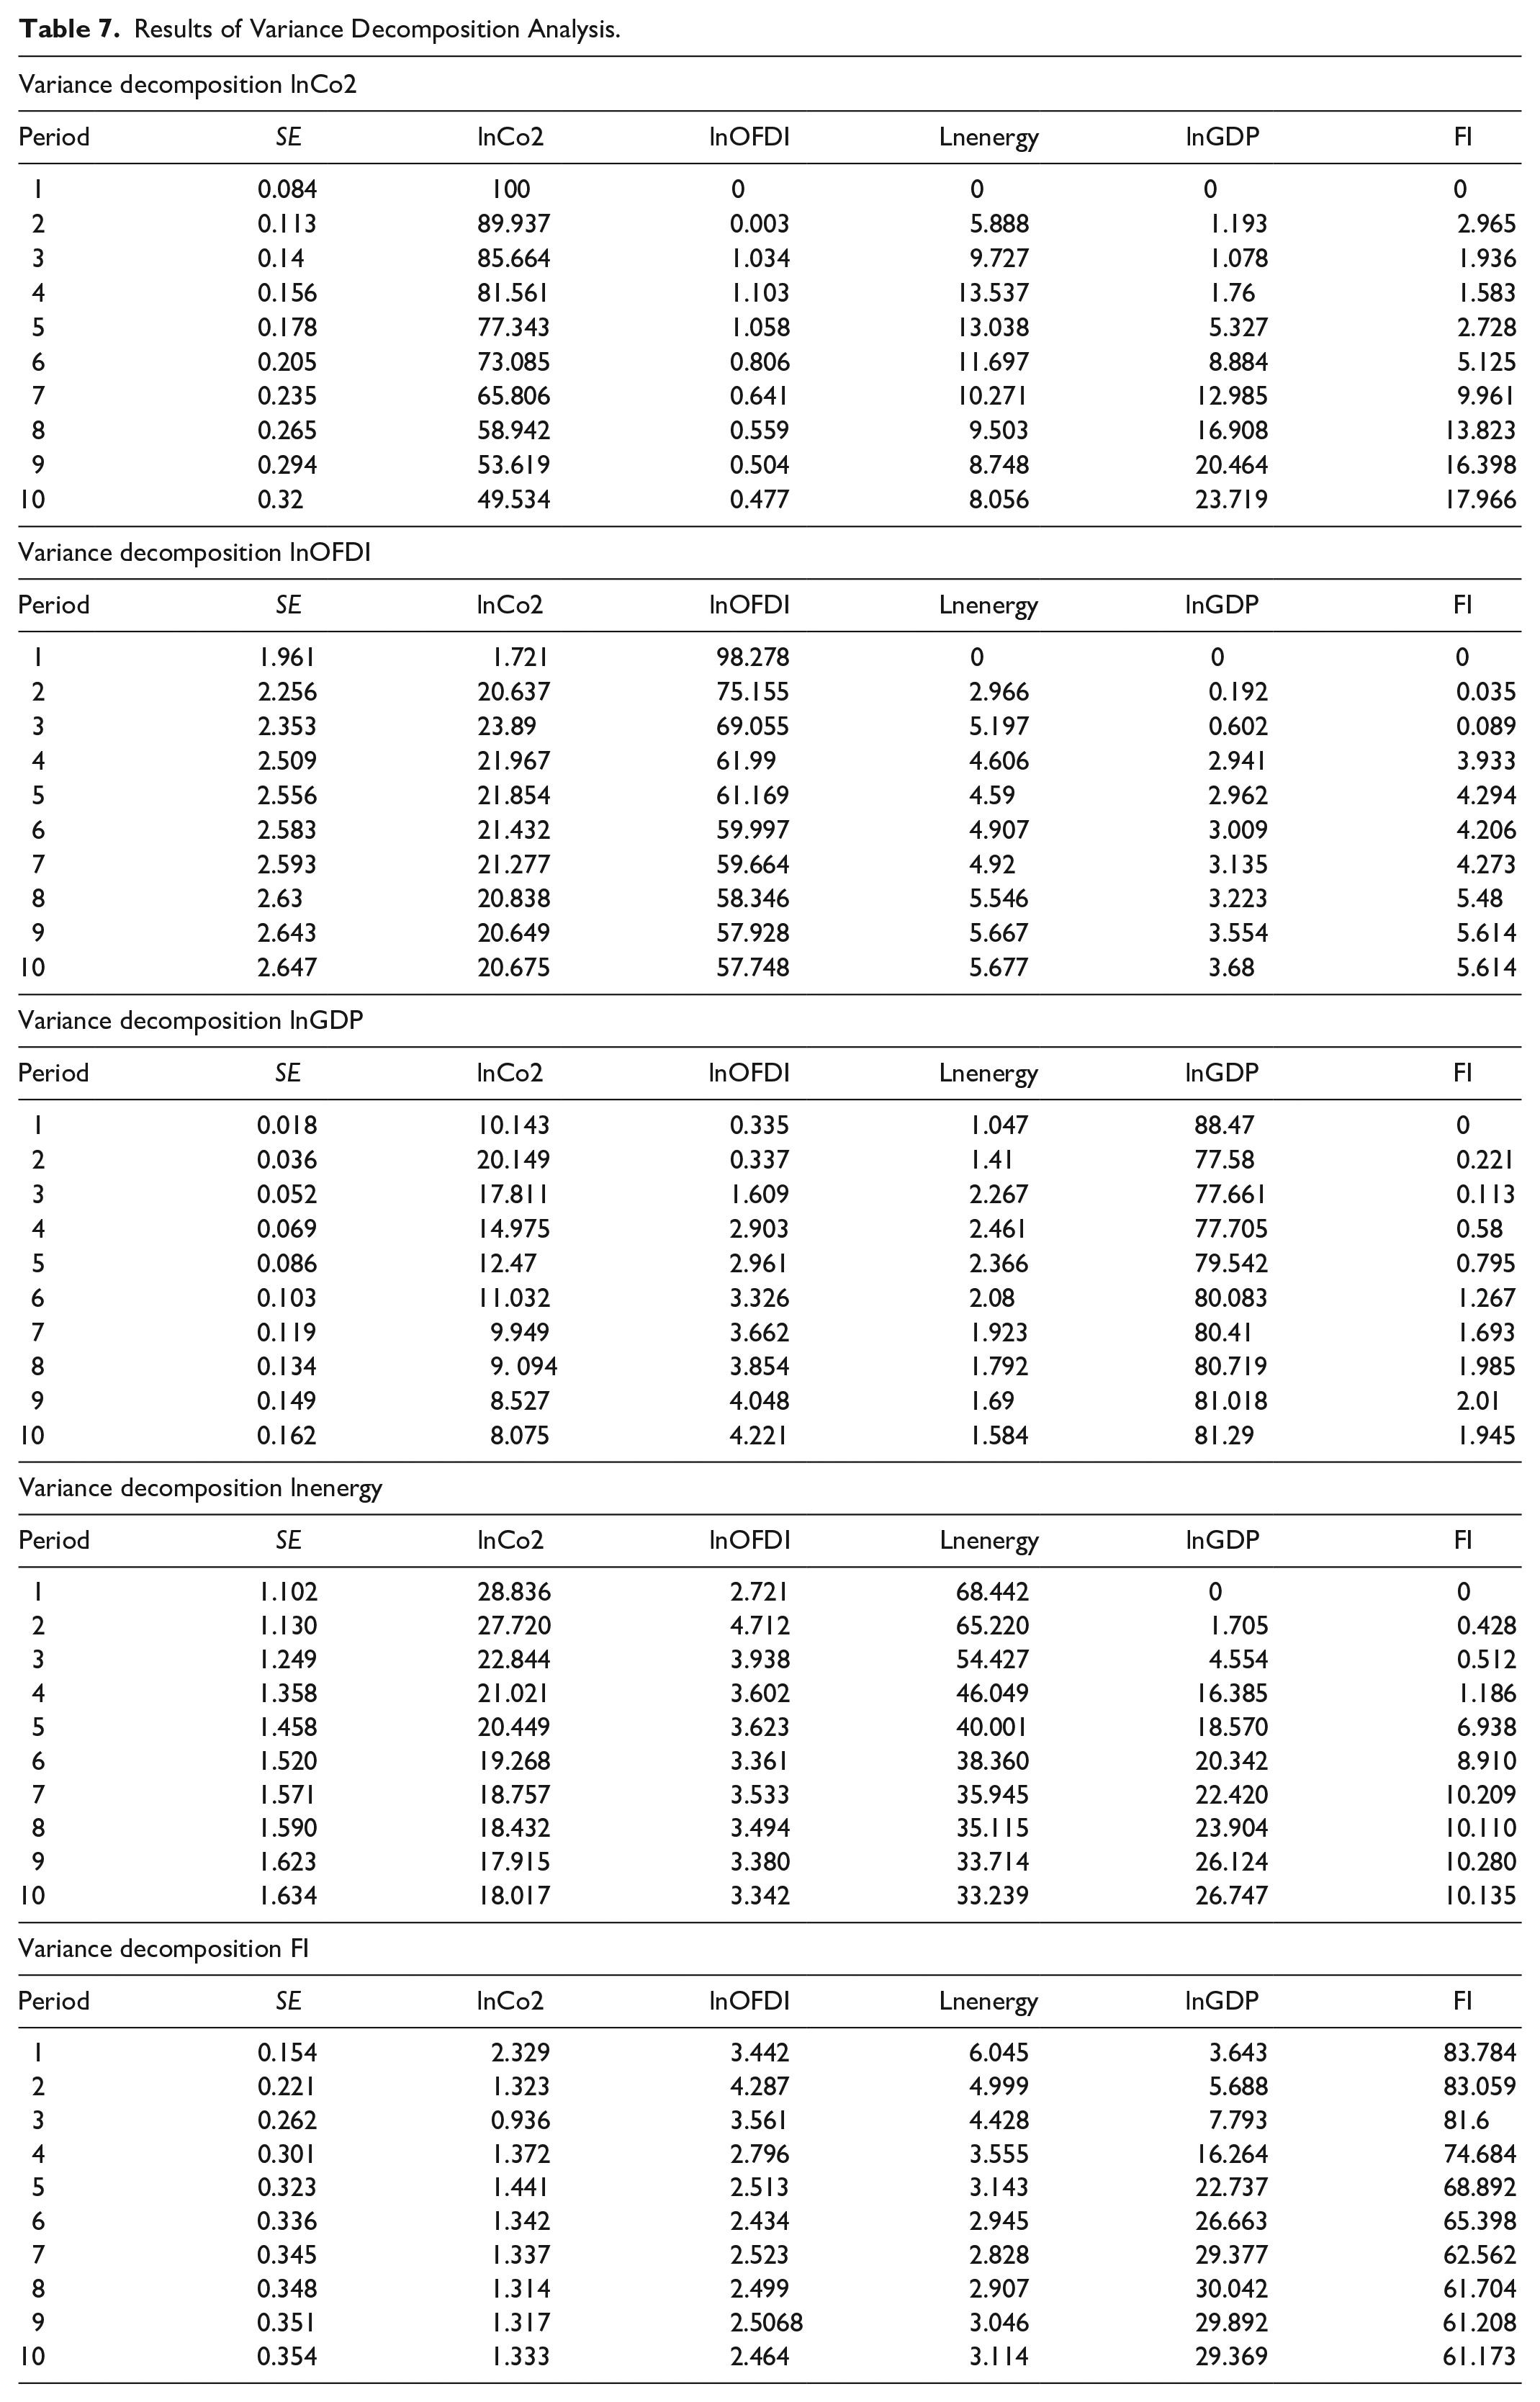
Table 7 reported the outcomes of the analysis of variance decomposition analysis (VDA) in the perspective of selected South Asian countries during the period 2004 to 2019. The finding of lnCo2 reveals that 49.53% change in carbon emission is endogenous. However, lnOFDI, lnenergy, lnGDP, and FI contribute to carbon emission by 0.477%, 8.056%, 23.71%, and 17.96% respectively. It means that lnOFDI, lnenergy, lnGDP, and FI are the leading cause of environmental degradation in South Asia region. Similarly, lnOFDI, lnenergy, lnGDP, and FI are added to carbon emission as 20.67%, 8.07%, 18.01%, and 1.33%. In contrast, self or own contribution of lnOFDI, lnenergy, lnGDP, and FI is 57.74%, 81.29%, 33.23%, and 61.17% respectively. The findings of variance decomposition analysis are consistent and robust with the regression results. Further, we used the “Impulse Response Function” (IRF) illustrated in Figure 10, the response of carbon dioxide emission to variables is modeled through IRF. This technique is used to forecast the association among the study variables over the specific period if the shocks are provided to the particular variable then IRF indicates the behavior of the correlation between the variable and specific period. Figure 10 presents a response of carbon dioxide emission when a shock is provided to independent variables. The overall finding of IRF indicates that outward direct investment, energy consumption, economic growth, and financial development differ when a shock is supplied to Co2 variable in the South Asia region. The overall results of the impulse response function indicate that all these variables should be incorporated in the estimated framework for the next 10 years.
Results of Variance Decomposition Analysis.

Dumitrescu & Hurlin causality.
Panel Causality Test
If co-integration exists in the panel data, the direction of the causality must be investigated. Moreover, in the light of the existence of cross-sectional dependence, we employ the Dumitrescu and Hurlin (D-H) panel causality estimation to classify the direction of causality in the variables. This technique is acquired from the individual Wald statistics of supposing the non-causality averaged across the cross-section element, mathematically; it can be described as follows

Where x and y portrayed as observables and

Where


Impulse response function.
Discussion
This paper examines the environmental effects of Chinese outward direct investment in selected South Asian countries, that is, Pakistan, Bangladesh, India, Nepal, and Sri Lanka for the period from 2004 to 2019. This study used the kernel distribution function for the normalization of the data. After checking the cross-sectional dependence, two more unit-root tests, that is, Levin et al. (2002) and Harris and Tzavalis (1999) were used to control the issue of non-stationary because the regression results will be spurious or biased if variables are non-stationary, after confirming the stationary in all variables this study used two co-integration tests, that is, Kao (1999) and Pedroni (2004) which confirms that all variables are co-integrated in long run, next to estimate the long-run association among the variables. This study used a fully modified ordinary least square (FMOLS).
Table 6 presents the findings of the whole panel of the FMOLS describes that all these factors are significantly increasing the environmental degradation in South Asia region except financial development. However, empirical result of these countries advocates fossil fuel significantly increasing the carbon emissions in the region. The results of FMOLS indicate that if there is one unit increase in Chinese outward direct investment, carbon emission increase by 0.099 and our findings are supported by various studies such as Al-Aameri et al. (2012), David (2016), Hao et al. (2020), Lan et al. (2012), Long et al. (2018), Cole (2004), Dong et al. (2021), and Mahadevan and Sun (2020). The results of FMOLS shows that energy consumption lead to increase carbon emissions in the region. As one unit change in energy consumption carbon emission spurs by 0.621 when holding other factors being constant and our finding are in line with Jun et al. (2021), Muhammad et al. (2020), Liu et al. (2021), Khan et al. (2019, 2020), Javid and Sharif (2016), and Dogan and Seker (2016). However, all these South Asian countries are predominantly involved in the emission- extensive energy utilization. The increased in environmental pollution and increased in future energy demands for this region are being anticipated.
The empirical finding of FMOLS indicate that financial development improving the quality of environment in the region and discouraging the carbon emission as one unit change in financial development carbon emission reduced by 1.184 and these finding are consistent with Frankel and Rose (2002), Kumbaroğlu et al. (2008), Ozturk and Acaravci (2013), and Kirikkaleli and Adebayo (2021). Various studies including Jun et al. (2021), Muhammad et al. (2020), Liu et al. (2021), Ejaz et al. (2017), Jebli et al. (2016), Mensah (2014), Tugcu et al. (2012), Acaravci and Ozturk (2010) and Shi (2003) have incorporated different additional independent variables in estimation of green house gas emissions and income growth link under the framework of EKC. Such studies incorporated energy dependency, energy efficiency, and economic growth variables to observe growth environmental association under the framework of EKC hypothesis. Their empirical findings indicate economic growth actions significantly promote carbon emissions. Lise (2006) investigated this hypothesis for Turkey and authors found no substantial evidence about the association between carbon emission and economic growth. It gives imperative information and suggestions about future policies to Government experts and Government agencies. Furthermore, the negative (+) and positive (−) values of economic growth (GDP) and GDP square in this study support the existence of the EKC hypothesis in the region. As one unit increase in economic growth carbon emission increased by 26.559 and one unit increase in GDP square reduce carbon emission by 1.811 and these empirical findings are supported by Khan et al. (2022).
Moreover, when considering the specific individual countries the result of FMOLS in Table 5 reports that in Bangladesh and Nepal, Chinese foreign direct investment significantly promoting environmental pollution by 0.005 and 0.012 respectively. Whereas, in Pakistan, India, and Sri Lanka, the Chinese outward direct investment reducing the environment pollution. In term of energy consumption Bangladesh, India, Sri Lanka, and Nepal destroying the environmental quality except Pakistan. The possible implication is that Pakistan is already facing huge energy shortages form the last many years and Pakistani Government also taking necessary measures to save or protect the environment by imposing environmental regulation on burning agriculture crops waste, and initiating the Billion Tree Tsunami in all provinces. The estimated coefficient of financial development on carbon emissions in all countries shows that carbon emissions significantly reduced except India. There are three possible implications for India that well established financial systems can effectively mitigate the issue of information asymmetry. First, the expansion of financial channels assists the enterprises to acquire loan or capital on concessional rates to expand their scale of production like (building the new production lines, engage more labor and renting the equipment more) as a result carbon emission increased. Second, financial sector development trying their best efforts to provide consumption credits services to their customers that facilitate the inter-temporal consumption which encourage them to buy more and more commodities like electric appliances, automobile and properties, which ultimately expand the social consumption as a result carbon emission increased dramatically. Third, the performance of stock market implies the propensity and rapid economic growth of a country that in turn increased the consumers and enterprises confidence as a result consumption and production activities increased in a country that leads to use energy and carbon emission increased. The financial sector development increased carbon emissions in emerging countries so the research studies conducted by Jiang and Ma (2019) support our finding in case of India. When considering individual countries Table 5, reports that EKC hypothesis the inverted U-shape curve exist in India and these finding are consistent with Sinha and Bhatt (2016) and Rani and Kumar (2019) and Ritu and Naresh (2019) whereas, Pakistan and Nepal shows U-shape curve while Bangladesh manifest N-shape curve and the research finding of Choi et al. (2010), Sirag et al. (2018), Lee and Chen (2021), Uzair Ali et al. (2020), and Aljadani et al. (2021) proved the various temporal pattern of EKC hypothesis in their research studies.
Conclusion and Policy Implication
This article examines the environmental effects of Chinese outward direct investment in selected South Asian countries, that is, Pakistan, Bangladesh, India, Nepal, and Sri Lanka. The results of full panel of the FMOLS estimation approach gives answer to research question 1, that China’s outward direct investment significantly promote environmental degradation, as the estimated coefficient value of energy consumption on environmental degradation is significant and positive. The full panel of the FMOLS indicates that positive and significant estimated coefficient value of GDP respond to research question 2 of the article that economic growth did not reduce carbon emission in the region and the estimated coefficient of value of GDP2 reduced carbon emission. However, both positive (+) coefficient value of GDP and (−) negative coefficient value of GDP square term respond to research question 3, of the article confirm the presence of environment Kuznet curve hypothesis in the South Asia region. As a response to research question 4 overall, it is concluded that economic growth in South Asia region cannot be achieved without worsen the quality of the environment, because economic development can cause carbon emission in the region and economic development for South Asia region is essential and economic development for South Asia region is essential.
Furthermore, an innovative accounting approach is employed using the variance decomposition analysis (VDA). The variation in the variables because of its involvement through different exogenous variables & the innovative shock is accounted for through this method. However, regarding, the carbon emissions from 2004 to 2019 the endogenous and significant involvement of carbon emissions is 49.534% due to the innovative shock. Current finding indicate that energy consumption, economic growth and Chinese foreign direct investment are the leading cause of carbon emission in the region and finding of VDA are in line and consistent with the FMOLS and as well for the next 10 years. Furthermore, authors used Dumitrescu and Hurlin (D-H) panel causality estimation to classify the direction of causality in the variables. The results showed that two-way causality exists among the variables. Finally, authors used IRF the reaction of carbon dioxide emission to variables is modeled through IRF. This technique is used to forecast the association among the study variables over the specific period. The graphically presentation of the IRF describes that when a shock is provided to the particular variable then IRF indicates the behavior of the correlation between the variable for specific period. The upper and lower bond values can illustrates the value of one standard deviation. The results of IRF indicate the reaction of Co2 emission as SD shock is supplied to other independent variables. Generally, statistical finding of the IRF shows that Chinese ODI, energy, GDP, and financial development differ if a shock is supplied to Co2 variable. The results also show that Chinese ODI, energy and economic growth are the dominant source for carbon emission in the region. Finally, IRF results illustrate that Chinese ODI, energy utilization and economic growth should be involved for next 10 years in the forecasted framework.
This study recommends the policy implication. The essential initiatives are needed to control carbon emissions by focusing the regional integration to protect the carbon emissions in the South Asia region. To improve quality of the environment, from energy policy point of view, the policy makers must focus on clean and green energy policies, investing in the renewable energy resources, improving the energy efficiency, reducing the energy intensity and enhancing the cleaner energy consumption are the major options to reduce the Co2 emission.
Furthermore, this study also recommends that host countries can reduce carbon emission by following the China standards, because China’s environmental regulations and enforcements are improving the environmental quality domestically. The China has developed high-level policy documents such as “Belt & Road Ecological and Environmental Cooperation Plan 2017” and the “Guidance on Promoting Green Belt & Road 2017” and other tools can be used to mitigate the effect of the environmental degradation. It is also suggested that Chinese government should follow the same guidelines and policies at the time of execution of the Chinese outward direct investment abroad to protect the environment in the host country. Governments of selected South Asian countries can also protect the carbon emission by subsidizing and promoting the green energy and by implementing the environmental regulations to overcome environmental pollution. The block of SAARC countries can reduce carbon emission by signing the global cooperation.
Finance such as banks and financial institutions can provide a practicable approach to instigate the high-level policy such as Asian Infrastructure Investment Bank (AIIB 2016) has a sustainability policy that might be adhered to and that involve mandated EIAs before the financial approval of development which may minimize the various potential effects of economic development on environmental degradation.
Finally, our findings also suggest that Governments should promote environment-friendly energy consumption and supportive energy infrastructure to tackle the issue of environmental degradation. Therefore, a more holistic framework is required to ensure sustainable policy decisions.
Footnotes
Declaration of Conflicting Interests
The author(s) declared no potential conflicts of interest with respect to the research, authorship, and/or publication of this article.
Funding
The author(s) received no financial support for the research, authorship, and/or publication of this article.