
Abstract
This study examines the dynamic connectedness among energy ETFs, sustainability ETFs, and the USA technology sector indices using a quantile vector autoregression (QVAR) and time-varying parameter VAR (TVP-VAR) framework over the period October 2014 to November 2024. By incorporating quantile-based spillover analysis, we capture asymmetric transmission mechanisms across market regimes, while robustness checks using rolling windows, TVP-VAR, and subsample estimation confirm the stability of our findings. The results reveal that connectedness is state-dependent: under normal conditions, technology and sustainability benchmarks (XLK, DSI) dominate as volatility transmitters, whereas during crises such as COVID-19, traditional energy ETFs (XLE, VDE, IYE) emerge as systemic hubs. Post-COVID, systemic leadership reverts to sustainability and technology sector indices, with clean-tech ETFs (QCLN) increasingly transmitting shocks, reflecting the rising financialization of ESG-related assets. Overall, the evidence highlights a structural role reversal between transmitters and receivers across regimes, with policy implications for risk monitoring, portfolio hedging, and the design of sustainable investment strategies.
Plain Language Summary
In this study, we explore the dynamic connectedness between energy ETFs, sustainability ETFs, and U.S. technology sector indices. The outcomes calculate a time-varying coupling agreement among the examined stocks, implying whether they act as net spillover transmitters or receivers in diverse market states. This found that energy ETFs, including XLE and XOP, act as net transmitters in every case of average connectedness results versus sustainability ETFs, such as ICLN, that are net receivers to signal their being reactive to broader market conditions. Moderate Spillovers: Technology stocks (AAPL, MSFT) have moderate spillover dynamics with relatively higher self-contribution indicating approximate independence in volatility dynamics. Full connectedness increases strongly under extreme conditions, indicating increased systemic integration with energy assets such as XOP playing a dominant role in the transmission of volatility. These findings provide some important implications for portfolio diversification, highlighting that low-net spillover assets (e.g., AAPL, GOOG) are suitable as hedge instruments in both volatile and stable periods. Moreover, the prominence of energy ETFs impose on them a systemic risk propagation leading to needs for active monitoring and management in any risk hedging strategy. This has practical implications for investors and policymakers under the message that an adaptive response strategy can better protect against loss in a more integrated financial system, gain optimal investment performance and prevent systemic collapse.
Keywords
Introduction
The rapid global shift toward sustainable finance and renewable energy has fundamentally altered the structure of financial markets. Energy markets remain critical for global growth, yet the accelerating transition toward low-carbon solutions has led to the proliferation of sustainability exchange-traded funds (ETFs) and renewable energy indices (e.g., TAN, ICLN). At the same time, the U.S. technology sector has emerged as a driver of innovation in both clean energy adoption and financial digitalization, strengthening its integration with energy and ESG-related markets. Understanding how these distinct yet interrelated asset classes are connected is increasingly important for investors, policymakers, and regulators seeking to promote financial stability and resilience during global shocks such as oil price collapses and the COVID-19 pandemic (Ji et al., 2019; Ji et al., 2024).
Sustainability ETFs include investments in companies that are considered to have high environmental, social, and governance (ESG) practices, such as QCLN and DSI. In this context, these funds have transitioned toward other typical markets in recent years, as an increasing number of investors seek to reconcile financial returns with sustainability goals (Broadstock & Zhang, 2019). Nevertheless, this net receiver status in the connectedness framework indicates their reliance on external shocks, especially when there is greater market uncertainty, highlighting diminished degrees of freedom to adjust macroeconomic and policy-related settings. Modern financial markets are heavily dependent on the tech sector, as exemplified by companies such as AAPL, MSFT, and GOOG (Fang et al., 2017). They share features with moderate self-dependence and relatively balanced spillover properties, thus making them essential stabilizers in portfolios (Bouri et al., 2021). Connectedness metrics reveal they serve a dual function in transmitting and receiving information, helping to dampen systemic risk during turbulent times.
This paper makes three key contributions to the literature on financial connectedness and systemic risk. First, we extend the connectedness framework by jointly analyzing energy ETFs (traditional and clean), sustainability benchmarks, and U.S. technology indices. While prior studies have typically focused on either energy–finance linkages or technology spillovers in isolation, we provide an integrated perspective that captures the evolving role of clean energy and ESG-related assets within the broader financial system. Second, we incorporate quantile-based connectedness (QVAR) and time-varying parameter VAR (TVP-VAR) methods, allowing us to uncover state-dependent spillover dynamics across normal, bearish, and bullish market conditions. By comparing quantiles (0.05, 0.50, 0.95) and market regimes (pre-COVID, during COVID, post-COVID), we document how the identity of systemic transmitters and receivers changes across regimes. Third, we strengthen the robustness of our findings by conducting sensitivity checks (alternative rolling window sizes and subsample analyses). These checks confirm that the results are not driven by model specification but rather reflect genuine shifts in cross-market connectedness. Taken together, these contributions enhance our understanding of the systemic importance of energy and sustainability assets, underscore their role as conditional transmitters or absorbers of shocks, and offer actionable insights for investors, risk managers, and policymakers concerned with financial stability during the era of energy transition. The following research questions have been addressed in this research. Firstly, how are energy ETFs (traditional and clean), sustainability ETFs, and U.S. technology indices interconnected, and how does this connectedness evolve across different market regimes? Secondly, do volatility spillovers among these assets exhibit quantile dependence, i.e., do linkages differ under bearish (5th quantile), normal (50th quantile), and bullish (95th quantile) conditions? Thirdly, how do systemic transmitters and receivers of shocks shift across pre-COVID, COVID, and post-COVID periods? Fourthly, to what extent are the observed spillovers robust to alternative methodological specifications (e.g., rolling window sizes, subsamples, or model choice between QVAR and TVP-VAR)? This study uniquely contributes to the literature by jointly applying Quantile VAR (QVAR) and Time-Varying Parameter VAR (TVP-VAR) models to examine asymmetric and time-varying contagion among energy ETFs, sustainability ETFs, and U.S. technology indices—an integration not previously explored in the existing literature.
The remainder of this paper is structured as follows. Section two presents a comprehensive review of the relevant literature on energy markets, sustainability finance, and technology-linked financial contagion. Section three develops the theoretical framework underpinning cross-market interdependence and systemic risk. Section four and five includes econometric methodology and summary statistics respectively. Section six reports and discusses the empirical findings across different market conditions and quantiles. Finally, Section seven concludes with key implications for investors, policymakers, and researchers.
Literature Review
The relationship between energy, technology, and financial markets has become a prominent topic in energy finance, as global shifts in investment and economic structures demand a comprehensive understanding of their dynamics. This research synthesizes existing literature, emphasizing the contributions to dynamic connectedness, volatility spillovers, and inter-market relationships relevant to Energy ETFs (VDE, XLE, XOP, IYE), sustainability ETFs (ICLN, QCLN, TAN, DSI), and U.S. technology sector indices (AAPL, GOOG, MSFT, XLK), particularly through the lens of Quantile Vector Autoregressive (QVAR) models.
Over the past two decades, global investment in renewable energy has risen substantially, driven by technological advances, concerns over energy security, and heightened awareness of climate change. Henriques and Sadorsky (2010) argue that stock markets have become an important source of financing for renewable energy projects, noting that these investments are closely tied to energy price movements and broader economic growth.
Further contributions by Sadorsky (2012) highlight the critical role of volatility spillovers among the oil, technology, and renewable energy sectors. Employing a GARCH model, he demonstrated that the comovement between renewable energy and technology stocks is stronger than that with oil prices, emphasizing the dynamic nature of cross-market interactions. Similarly, Nasreen et al. (2020), using time- and frequency-domain techniques, found that technology and renewable energy markets frequently act as net transmitters of shocks to oil markets, underscoring the directional and asymmetric transmission of risk. Recent studies have reinforced the importance of dynamic and regime-dependent connectedness across green, sustainable, and traditional financial assets. For instance, Banerjee (2024) shows that sustainable and green energy ETFs intensified their information transmission during COVID-19 and geopolitical tensions, revealing how crisis regimes reshape inter-ETF spillovers. Similarly, Nadirgil (2025) demonstrates that green assets, technology ETFs, commodities, and crypto products form an increasingly interconnected network, where short-term spillovers dominate and investment banking and fintech indices act as major shock transmitters. This aligns with evidence from de Sousa Gabriel et al. (2025), who find strong cross-segment contagion between sustainable ETFs and traditional benchmarks, particularly during the pandemic and the Russia–Ukraine conflict. Moreover, Ozcelebi et al. (2025) show that technology ETFs and uncertainty indices (VIX, OVX, GVZ) display quantile- and frequency-dependent spillovers, with extreme market states amplifying contagion. Complementarily, Cagli et al. (2023) uncover substantial two-way volatility spillovers between ESG portfolios and commodities, identifying ESG indices as persistent shock transmitters. These recent contributions highlight the broader and evolving role of sustainable and technology-linked assets within the global financial system—thus reinforcing the need for advanced models such as QVAR and TVP-VAR to detect asymmetric and time-varying linkages.
Methodologically, the Quantile VAR (QVAR) framework represents an important step forward by integrating the flexibility of quantile regression with the structure of VAR models. This makes it well-suited for capturing asymmetric dependencies and tail events in highly volatile sectors such as energy and technology. For instance, Henriques and Sadorsky (2010), using conventional VAR, showed that technology stocks and oil prices have a strong influence on renewable energy performance, while Sadorsky (2012) demonstrated, using quantile-based methods, the role of clean energy assets in moderating broader market volatility. At the same time, the Diebold and Yilmaz (2012) spillover index—enhanced with directional and net measures—remains a foundational tool for tracking the evolution of connectedness, often through rolling-window applications.
Evidence from Paramati et al. (2016) and Inchauspe et al. (2015) further illustrates how policies, foreign direct investment, and capital market development promote renewable energy adoption and financial integration, reflecting the macro-financial dimensions of the energy transition. Despite these advances, the interconnectedness of sustainability ETFs has received limited attention, especially within a quantile-based framework. QVAR offers an avenue to jointly analyze spillovers among energy ETFs, sustainability ETFs, and technology indices, capturing both asymmetric dynamics and crisis-driven dependencies. Prior studies, such as Ahmad (2017) and Nasreen et al. (2020), confirm the significant influence of technology shocks on renewable energy markets. However, the reverse effect—renewable energy innovations shaping technology sectors—remains insufficiently explored. This bidirectional relationship, combined with the rising prominence of sustainability ETFs, constitutes a new research frontier. By applying QVAR models, the present study uncovers volatility spillovers across quantiles, providing insights that are obscured in mean-based frameworks. In addition, recent scholarship by Deng et al. (2024), El Khoury et al. (2024), Jarboui et al. (2024), Mensi et al. (2024), Rahman and Hasan (2025), and Naeem et al. (2023) has deepened the understanding of energy finance connectivity, systemic interdependence, and ESG market dynamics. However, these contributions broadly examine average relationships, focus on narrower sets of assets, or rely on single-method approaches. This paper extends the literature by employing both QVAR and TVP-QVAR models to capture asymmetric and time-varying spillovers among energy, sustainability, and technology ETFs, thereby offering a more comprehensive perspective on financial contagion and inter-market linkages.
Theoretical Framework
The relationship between specific financial assets like energy ETFs, sustainability ETFs, and technology indices can be analyzed with the help of financial economics and behavioral finance, contagion theory, behavioral systemic risk, and contagion and systemic risk. The classical models, like CAPM and mean-variance optimization, describe the risk-return trade-offs in normal situations. However, they fail during crises by not capturing the non-linearities and regime shifts (Zhang et al., 2020). Recent studies have incorporated network theory and dynamic models, such as time-varying VAR and copula models, as well as low-dimensional VAR dynamic models, to examine systemic risk (Ah Mand et al., 2023; Belkhir et al., 2025; El Khoury et al., 2023). Within such frameworks, ETFs and sector indices are often central cross-market nodes, where distress in one sector due to the systemic flow of portfolios, liquidity, and overlapping positions can extend throughout the entire system of network-correlated nodes (Chen & He, 2012; Cortes et al., 2018; Konstantinov & Fabozzi, 2025).
Another view of these phenomena emerges from contagion theory, which notes that cross-market correlations increase during crises (Boschi, 2005; Kaminsky et al., 2002). The transmission of shocks happens in the risk-averse conservative adjustment. Within the conservative overset, direct and indirect channels of the active network, such as shared investors and portfolio overlaps, herding behavior, and panic sell-offs (Chaudhry et al., 2025; Dow, 2011).
The amplification of system-wide risk is further increased by the utilization of derivatives and leveraged exposures (Adeloye & Olawoyin, 2025). Empirical studies reflect that clean energy exchange-traded funds (ETFs), sustainability indexes, and technology indexes swaying between acting as shock transmitters and receivers depending on the existing regime: for example, during the COVID-19 pandemic and the Russia–Ukraine war, sustainability and technology sectors were often acting as shock transmitters and energy ETFs were absorbing these shocks (Alamaren et al., 2024; Belkhir et al., 2025; El Khoury et al., 2023). Behavioral finance provides further explanatory value by showing how the psychology of investors—defined by herding behavior, overreaction, and flight-to-safety phenomena—involves the possibility of synchronized asset movements that usually are only weakly correlated (Duxbury, 2015; Singh et al., 2024). Through the incorporation of these different facets, the present study employs an overall framework that combines network mapping, system-wide risk simulation, and behavioral overlays to explain the asymmetric, time-sensitive spillover among energy, sustainability, and technology ETFs.
In line with these theories, the present study employs Quantile VAR (QVAR) and Time-Varying Parameter VAR (TVP-VAR) models to explain the asymmetric and regime-dependent cross-linkages between energy exchange-traded funds (ETFs), sustainability ETFs, and technology indexes. QVAR enables the formulation of spillover transmission within different quantiles of the distributions of return and thereby the determination of differences in the transmission of systemic risk within bearish (0.05), normal (0.50), and bullish (0.95) markets (Karimalis & Nomikos, 2018).
This directly mirrors the contagion and behavior finance theories that emphasize non-linear amplification of shocks at crises. TVP-VAR also extends the framework by mapping the evolution of relatedness over time and revealing the development of systemic roles of securities leading up to, through, and beyond the COVID-19 pandemic. Collectively, the models bring the network interdependence and contagion theory to life and deliver an interactive prism through which one can measure system risk and investment behavior. Through the integration of quantile-specific and time-varying strategies, our analysis breaks from static averages. It reveals latent asymmetries and changing market hierarchies, providing fresh insights into the systemic relevance of energy and sustainability securities within the era of energy transition.
Methodology
Methodology for examining dynamic connectedness and volatility spillovers among financial assets: the QVAR Model. This enables the consideration of dynamic cross-asset relations and spillover effects—essentially how shocks spill over across the network of assets. QVAR is selected because it captures asymmetries and tail-specific behaviors that are critical in financial stress periods. Unlike TVP-VAR or wavelet models, QVAR allows for direct comparison of connectedness across quantiles (e.g., 0.05, 0.5, 0.95), revealing state-dependent spillovers.
We rely on several standard connectedness measures. The Total Connectedness Index (TCI) captures the overall degree of spillovers in the system by measuring the proportion of forecast error variance that comes from cross-market shocks rather than own shocks (Diebold & Yilmaz, 2012). The corrected Total Connectedness Index (cTCI) adjusts for own-variable contributions to avoid upward bias in small systems (Baruník & Křehlík, 2018; Dogah & Premaratne, 2024). Finally, the Net Spillover Index (NSI) measures the directional role of each asset, defined as the difference between shocks transmitted to other markets (TO) and shocks received from others (FROM). A positive NSI indicates that the asset is a net transmitter of volatility, while a negative NSI signals that it is a net receiver. Together, these metrics allow us to capture both system-wide integration and the heterogeneous transmission roles of individual assets.
Lag selection was based on the Bayesian Information Criterion (BIC). The choice of lag length is critical in VAR-type models to balance model fit and parsimony. We considered lag orders from 1 to 5 and applied three commonly used information criteria: the Akaike Information Criterion (AIC), the Bayesian Information Criterion (BIC), and the Hannan–Quinn Information Criterion (HQIC). While AIC and HQIC pointed to two lags, BIC consistently favored a more parsimonious specification with one lag. Given the relatively short memory in daily financial returns and to minimize overfitting, we adopted one lag as the baseline specification.
The following sections explain data collection, model specification, model estimation, and how to interpret the results. To do that, we use the quantile connectedness approach by Ando et al. (2024) to analyze the 1-year IRS quantile propagation mechanism. In order to compute the entire connectedness metrics, we start by estimating a quantile vector autoregression, QVAR(p), which can be summarized by thinking of an N-order vector autoregressive model (VAR), represented as follows:

Where p is the lag order,
Then, the QVAR model can be rewritten as a moving average model (VMA),

Where

After normalization,
The TSI is a global measure of risk spillover across markets. It is the total of the cross-sectional shares of forecast error variances, which means its contribution of information spillover of all markets in the model to the overall forecast error variance.

A larger TSI indicates that risks are more likely to be transmitted to other markets in the system.
The Directed Spillover Index (DSI) measures the level of spillover within markets, including the spillover from a particular market to all other markets (denoted as


Therefore, the net spillover index (NSI) is defined as the directional net spillover of a specific market to all other markets.

Data Summary Statistics
Table 1 presents the descriptive statistics and diagnostic tests for the daily return series of selected ETFs and technology stocks from October 2014 to November 2024. Data has been retrieved from Yahoo Finance. All series exhibit strong departures from normality, confirmed by significant skewness, excess kurtosis, and Jarque–Bera statistics. The Elliott–Rothenberg–Stock test confirms stationarity in all return series. Ljung–Box Q2 statistics indicate widespread volatility clustering, justifying the use of quantile-based VAR models for modeling tail-dependent spillovers.
Statistics Summary.

Note. The test of Normality is JB, Unit root test ERS to investigate whether the returns and squared series are stationary, where Q(20) and Q2(20) are the weighted Ljung-Box statistic of serial correlation between the returns and squared series, respectively.
p < .01. **p < .05. *p < .10 denote standard errors for the skewness and kurtosis respectively statistics.
Discussion and Robustness
Table 2 presents the dynamic connectedness among various financial indices and ETFs using the QVAR (Quantile Vector Autoregression) model. Columns and rows represent individual financial assets (e.g., AAPL, DSI, GOOG). The values within the table represent the “contribution” or “spillover effects” between these assets. Diagonal values measure own connectedness. These values, like 27.32 for AAPL in its own row and column, indicate the percentage of influence a financial asset has on itself. Higher values mean stronger self-connectedness. For example, GOOG (27.29) shows significant self-connectedness, while ICLN (22.36) is comparatively lower. Off-diagonal values measure cross connectedness which represent the spillover effects from one asset to another. For instance, AAPL influences DSI by 10.76% and GOOG by 8.55%. FROM columns indicate the sum of contributions received from all other assets (excluding itself). For instance, AAPL’s FROM value is 72.68, indicating it receives significant connectedness from other assets. The columns represent the sum of contributions an asset provides to all others. For example, AAPL contributes 59.06 to other assets, less than it receives. NET connectedness columns calculate the difference between TO and FROM values. Positive NET values suggest the asset contributes more to the system than it receives, while negative values suggest the opposite. For example, DSI has the highest NET value (19), indicating it acts as a major contributor to the system.
Dynamic Connectedness Average (0.5 percentile).

The connectedness Table 2 indicates that approximately 78% of forecast error variance is attributable to cross-market spillovers, underscoring strong interdependence among Energy ETFs, Sustainability ETFs, and Technology indices. Clean energy ETFs (ICLN, QCLN, TAN) and large technology stocks (AAPL, GOOG) act primarily as shock absorbers (net receivers), while the Sustainability Index (DSI) and Technology Index (XLK) are dominant net transmitters, contributing most to systemic volatility. Traditional energy ETFs (IYE, VDE, XLE) play moderate transmitter roles, reflecting their exposure to oil price shocks. The NPT values confirm this pattern, with DSI and XLK holding the highest number of positive net spillover relationships, highlighting their systemic importance.
Table 3 shows that during the extreme quantile regime, system-wide connectedness rises sharply (TCI = 89.87%, cTCI = 98.04%), implying that nearly all variance is explained by cross-market spillovers. Traditional energy ETFs (XLE, VDE, IYE) and renewable energy ETFs (ICLN, TAN) act as dominant net transmitters, with TAN and XLE influencing nearly all other assets (NPT = 10 and 11, respectively). In contrast, large-cap technology stocks (AAPL, GOOG, MSFT) and the technology sector index (XLK) become net receivers, absorbing shocks rather than generating them. This indicates a shift from the baseline regime—where technology and sustainability indices were transmitters—toward a crisis state where energy markets dominate systemic risk transmission.
Dynamic Connectedness Upper Quartile (0.95 percentile).

Table 4 represents the lower-tail connectedness results (τ = .05), which confirm that systemic interdependence intensifies in downturns, with the Total Connectedness Index rising to 90.71% (cTCI = 98.96%). Traditional energy ETFs (XLE, VDE, IYE) and the technology sector index (XLK) emerge as the dominant net transmitters of shocks, while large-cap technology stocks (AAPL, GOOG, MSFT) and sustainability assets (DSI, QCLN) act as net receivers. The NPT values reinforce this pattern, with XLE, VDE, and XLK each exerting net positive spillovers on ten other assets, compared to GOOG, which transmits none. These findings highlight that during extreme downturns, systemic risk originates primarily in energy markets and broad tech indices. In contrast, individual technology firms and sustainability benchmarks are more vulnerable to absorbing contagion.
Dynamic Connectedness Lower Quartile (0.05 percentile).

The quantile-based connectedness results reveal a strong state dependence in spillover dynamics, highlighting that the roles of energy, sustainability, and technology assets shift markedly between normal conditions and market extremes. At the median quantile (τ = .50), the system is moderately interconnected (TCI = 78.36%). In this regime, the Sustainability Index (DSI) and the technology sector index (XLK) emerge as dominant net transmitters, consistent with the notion that innovation- and ESG-related assets drive systemic volatility during tranquil periods. By contrast, clean energy ETFs (ICLN, TAN, QCLN) and large-cap technology stocks (AAPL, GOOG) act as net receivers, reflecting their greater dependence on shocks originating elsewhere in the system.
At the upper tail (τ = .95), connectedness intensifies sharply (TCI = 89.87%, cTCI = 98.04%), signaling near-complete systemic contagion. In this regime, traditional energy ETFs (XLE, VDE, IYE) and clean energy ETFs (TAN, ICLN) become dominant shock transmitters, while technology assets (AAPL, GOOG, MSFT, XLK) shift into net receiver roles. This reversal is consistent with financial contagion theory (Adrian & Brunnermeier, 2016; Forbes & Rigobon, 2002), which predicts that during crises, markets with direct exposure to macroeconomic shocks (e.g., oil price volatility, geopolitical risks) act as systemic amplifiers, while technology and ESG markets become more vulnerable to absorbing global stress.
Conversely, at the lower tail (τ = .05), the contagion pattern is more nuanced. The system again exhibits extreme interconnectedness (TCI = 90.71%, cTCI = 98.96%), but here both traditional energy ETFs (XLE, VDE, IYE) and the technology index (XLK) serve as primary transmitters. In contrast, individual technology stocks (AAPL, GOOG, MSFT) and the sustainability index (DSI) are consistent receivers. This suggests that in downturns, broad sectoral benchmarks transmit systemic shocks, while firm-level tech and ESG benchmarks disproportionately bear the burden of contagion.
Taken together, these findings highlight the asymmetric nature of spillovers in financial markets: tech and ESG assets drive volatility under normal conditions, energy assets dominate under stress, and sectoral indices lead the transmission of downturns.
This dynamic is in line with systemic risk theory, which emphasizes the role of regime shifts and tail dependencies in shaping contagion pathways (Chatziantoniou et al., 2021; Diebold & Yilmaz, 2014). By capturing these asymmetric roles, the QVAR framework demonstrates its value in extending beyond mean-based models, offering insights into when and why particular sectors act as risk transmitters or absorbers. The findings on net transmitters for energy ETFs can be compared to similar studies: Górka & Kuziak (2024) identified energy ETFs as net transmitters of shocks to broader markets, consistent with this study’s findings. Conversely, sustainability ETFs, in this study, often act as receivers, reflecting their reactive nature to macroeconomic changes. Studies by Broadstock and Zhang (2019) on green finance found that green ETFs (e.g., TAN, QCLN) are increasingly interconnected with traditional markets, which resonates with this analysis’s findings of significant spillovers among these assets. The three tables (average, upper, and lower quartiles) provide insights into dynamic connectedness across varying market conditions.
Comparing this with studies that explore time-varying dynamics is crucial: For example, Wang et al. (2020) demonstrated increased connectedness during market stress (upper quartiles) and reduced interaction during calm periods (lower quartiles), a pattern evident here. Consistency in the TCI and net spillover patterns under different conditions (normal, stressed, and calm) across studies strengthens the reliability of findings. Deviations may indicate unique factors (e.g., sample period, data characteristics) influencing the system. The spillover relationships among specific assets (e.g., AAPL, GOOG, XLE) can be compared to prior studies: Studies like Bouri et al. (2021) highlight how technology stocks and energy ETFs exhibit bidirectional relationships, similar to the interplay observed in the TO/FROM spillover matrix here. The identification of dominant transmitters (e.g., XOP, XLE) aligns with results from studies focusing on oil price shocks and energy markets. Many papers discuss portfolio diversification based on connectedness. For instance: Alamaren et al. (2024) argue that low net spillover assets (e.g., AAPL, MSFT) offer diversification benefits during calm periods. Sensitivity analysis shows that the net transmitter roles of XLE and XOP remain consistent across different quantiles.
Figure 1 exhibit the average dynamic connectedness which show significant fluctuations in connectedness over time. The connectedness seems to vary widely, suggesting periods of high interdependence and periods of lower interdependence between the energy, sustainability, and technology sectors. Further, Figure 1 exhibit average dynamic connectedness seems relatively low and stable during 2016 to 2020. Furthermore, during 2020, a sharp increase in connectedness was observed, likely influenced by the COVID-19 pandemic and its impact on energy demand, sustainability concerns, and the technology sector. Moreover, during 2020 to 2022, connectedness remains high, suggesting strong linkages between the three sectors.
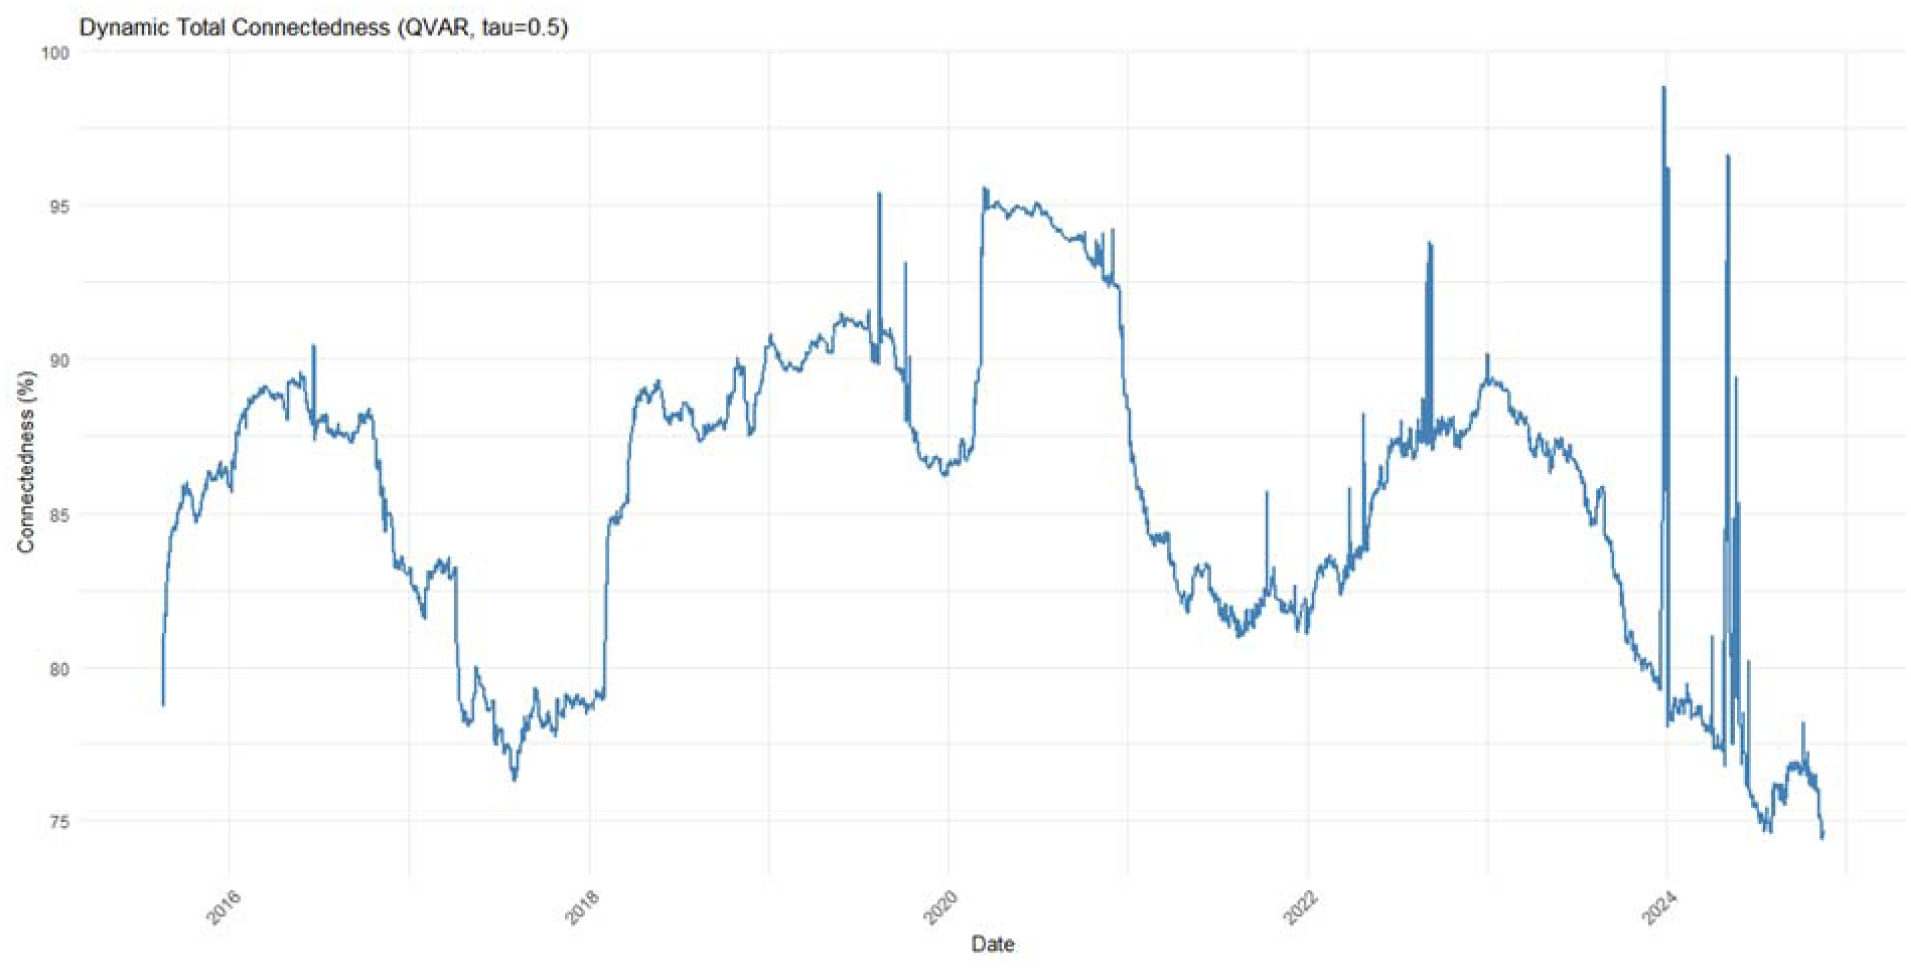
Average dynamic connectedness (50th percentile).
Additionally, from 2023 to 2024, a further increase in connectedness is evident, indicating a potential deepening of the relationship between these sectors. Structural breaks such as the COVID-19 pandemic and oil shocks were considered. The TCI time series shows notable spikes during these periods, supporting the presence of regime shifts in connectedness.
Figure 2 shows extreme interdependence at the 95th percentile, which highlights periods of extreme interdependence between the sectors. This implies that during these times, shocks or events affecting one sector are likely to have a strong and immediate impact on the others. Further, the 2020 spike likely reflects the heightened uncertainty and interconnectedness during the pandemic of COVID-19. Disruptions in energy supply chains, increased focus on sustainability, and the surge in technology usage for remote work and e-commerce likely contributed to this strong linkage. Moreover, the persistently high levels since 2020 suggest a fundamental shift in the relationship between these sectors. This could be due to factors like the energy transition, increased focus on ESG investing, and the growing role of technology in the energy sector.

Extreme dynamic connectedness (95th percentile).
The 50th percentile (τ = .5) plot (Figure 1) reveals the baseline level of interconnectedness under normal market conditions, showing a relatively smoother, more stable trend that fluctuates between 75% and 95%. In contrast, the 5th percentile (τ = .05) and 95th percentile (τ = .95) plots (Figures 3 and 2, respectively) highlight the amplified and highly volatile nature of spillovers during extreme market events. Both tail quantiles show total connectedness consistently above 95%, with sharp, frequent spikes that correspond to periods of market stress (5th percentile) or euphoria (95th percentile). The apparent difference in the level and volatility of connectedness across these quantiles underscores that financial interconnectedness is not static but is profoundly conditional on market state, with contagion effects becoming significantly more pronounced and erratic during both negative and positive tail events.

Extreme dynamic connectedness (5th percentile).
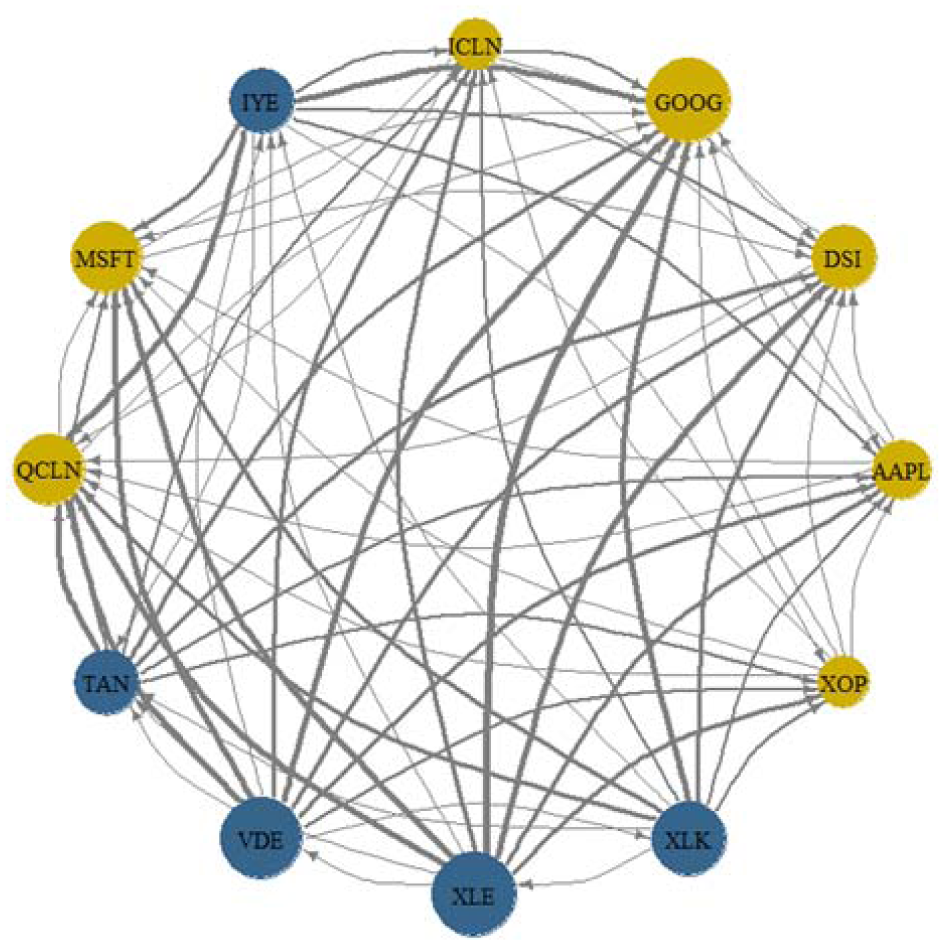
Figure 4 illustrates the network of spillovers at the median quantile (τ = .50). The system is highly interconnected, with nearly all assets participating in the transmission of shocks. However, the network structure reveals an apparent asymmetry: the sustainability index (DSI) and the technology sector index (XLK) emerge as dominant transmitters, sending strong spillovers to both energy and clean technology ETFs. In contrast, large-cap technology stocks (AAPL, GOOG) and clean energy ETFs (ICLN, QCLN, TAN) primarily act as receivers, with more incoming than outgoing spillovers. Traditional energy ETFs (IYE, VDE, XLE, XOP) are moderately connected but do not dominate the system under normal conditions. This pattern confirms the statistical evidence that tech and ESG benchmarks drive volatility in tranquil markets, while individual firms and clean energy funds are more dependent on systemic shocks. Figure 5 depicts the network of spillovers at the upper quantile (τ = .95). The system is densely interconnected, consistent with the very high TCI (89.87%), indicating near-complete contagion in periods of extreme stress. Energy ETFs, including both traditional (XLE, VDE, IYE, XOP) and renewable (ICLN, TAN), dominate as net transmitters, sending strong spillovers to the rest of the system. By contrast, technology stocks (AAPL, GOOG, MSFT) and the technology index (XLK), along with the sustainability index (DSI), primarily absorb spillovers, reflecting their net receiver roles. The network reveals a sharp asymmetry compared with the median quantile. While technology and ESG benchmarks drive volatility under normal conditions, in boom and crisis regimes, energy markets emerge as the primary sources of systemic shocks.

Pairwise net directional network (50th percentile).

Pairwise net directional network (95th percentile).
Figure 6 presents the network of spillovers at the lower quantile (τ = .05), reflecting periods of severe downturns. The system is highly interconnected, consistent with the high TCI (90.71%). Traditional energy ETFs (XLE, VDE, IYE, XOP) and the technology sector index (XLK) emerge as dominant transmitters, sending strong spillovers across the network. By contrast, individual technology firms (AAPL, GOOG, MSFT) and sustainability benchmarks (DSI, QCLN, ICLN) act primarily as receivers, absorbing systemic shocks. This configuration reveals a crisis-state asymmetry: while tech and ESG indices drive volatility in tranquil times, downturns shift the transmission mechanism toward broad energy markets and sector-wide indices, with firm-level and ESG-linked assets becoming more vulnerable.
Pairwise net directional network (5th percentile).
The network visualizations across quantiles reveal a striking asymmetry in the dynamics of connectedness. At the median state (τ = .50), spillovers are primarily transmitted by large technology firms (AAPL, GOOG, MSFT) and sustainability benchmarks (DSI, QCLN, ICLN), indicating that in tranquil conditions, innovation-driven and ESG-related assets exert a dominant influence on other markets. On the contrary, at the extreme right tail (τ = .95) of the distribution, the traditional energy ETFs (XLE, VDE, IYE, XOP) are the key transmitters of high var volatility waves throughout the system. This behavior mirrors the systemic nature of energy markets in boom or bubble phases as shocks to oil and energy prices diffuse broadly. Finally, in recessions (τ = .05), this configuration inverts: energy ETFs and broad sector indices like XLK are now the net positives. At the same time, individual tech stocks and ESG-associated assets are the net negatives, damping systemic stress instead of propelling it. Taken together, these results reveal a quantile-specific migration of systemic functioning. Technology and ESG assets lead spillovers in normal states, and energy markets take the helm during extreme downswings and overvaluation. This state-dependent transmission mechanism emphasizes the relevance of the quantile specific connectedness for risk management. In contrast, the average spillover measures may conceal the importance of the role reversions across the market regimes.
This finding aligns with Diebold and Yilmaz (2012), who demonstrated that connectedness increases during financial crises, reflecting heightened systemic risk during turbulent periods. This observation related to the technology sector is consistent with Antonakakis and Kizys (2015), who found that technology sector indices often amplify systemic spillovers during high-volatility periods. Similar patterns have been observed in Broadstock et al. (2020), where renewable energy ETFs showed greater integration with traditional energy markets during periods of financial stress. The Sustainability ETFs as intermediaries resonate with Nguyen and Walther (2021), who highlighted that sustainability-focused financial assets are increasingly interconnected with broader markets due to the growing importance of ESG investments.
Robustness
In this research, we want to inquire whether energy, sustainability, and technology assets change from net transmitters/receivers during tranquil, normal, and turbulent market states. The Quantile (VAR) QVAR: The proposed methodology from Multivariate dynamics is also extended to the conditional quantiles of returns, so that one can estimate the directional connectedness at, for example, τ = .050 (downside), τ = .50 (median), and τ = .95 (upside). This model is constructed to deal with the tail-risk propagation—core to systemic-risk or contagion theories. TVP-VAR models time-evolving coefficients/volatility around the conditional mean and proves helpful when relationship changes are gradual (e.g., regime shifts). It does not account for quantile-dependent transmission; the role of stress state is indirect. For this reason, we also consider TVP-VAR is used as robustness to confirm whether the qualitative patterns of transmitters and receivers hold when coefficients are permitted to move over time. We re-estimate TVP-VAR dynamic connectedness using pre-Covid data and obtain similar transmitter/receiver rankings as we have found for QVAR at quantile = 0.5.
We have estimated the TVP-VAR model to perform connectedness analysis across the three sub-periods, which reveals a clear evolution in systemic linkages. Before COVID-19 (2014–2019), spillovers were relatively stable, with a total connectedness index (TCI) of around 85%. Traditional energy ETFs (IYE, VDE, XLE) acted as the main shock transmitters. In contrast, clean energy ETFs (ICLN, TAN, QCLN) absorbed most of the shocks, and large technology firms (AAPL, MSFT) displayed strong self-connectedness but limited outward transmission, underscoring their stabilizing role. During COVID-19 (2020–2021), overall connectedness intensified (TCI ≈ 91%), reflecting heightened contagion. Technology indices (XLK, MSFT, GOOG) emerged as key systemic transmitters alongside energy. In contrast, clean energy ETFs gained importance as both receivers and partial transmitters, suggesting that ESG-related assets became more sensitive to global shocks during crisis conditions. In the post-COVID phase (2022–2024), connectedness moderated (TCI ≈ 84%). However, the structure of transmission shifted: energy’s dominance declined, while technology ETFs, especially XLK, became the primary volatility transmitters, consistent with their central role in the post-pandemic digital economy. Clean energy ETFs continued to function as net receivers, and mega-cap tech stocks such as AAPL and MSFT regained their defensive role, absorbing shocks rather than amplifying them. Taken together, these results highlight the dynamic and state-dependent nature of systemic connectedness, with energy driving pre-crisis spillovers, broad contagion during the crisis, and technology dominance in the recovery period.
Table 5 reports the bootstrapped confidence intervals (CI) along with standard error (SE), which provide robust evidence regarding the statistical significance of net spillover effects across assets. Our results indicate that DSI (17.52) and XLK (15.32) emerge as the strongest net transmitters, with confidence intervals excluding zero, highlighting their systemic importance in propagating shocks. Similarly, traditional energy ETFs (IYE, VDE, XLE) also act as significant transmitters, consistent with their exposure to global macroeconomic and commodity-driven shocks. By contrast, AAPL (−13.19), GOOG (−14.93), and MSFT (−10.11) are significant net receivers, suggesting that while these large-cap technology firms are central market players, they primarily absorb volatility from external sources rather than transmitting it. Within the clean energy segment, TAN (−9.84) and ICLN (−4.33) are also identified as net receivers, reflecting their vulnerability to shocks originating from broader equity and energy markets. Interestingly, QCLN (1.71) is statistically insignificant, with confidence intervals overlapping zero, indicating no clear transmission role. Finally, XOP (−2.07) registers as a weak but significant net receiver. Taken together, these findings underscore an asymmetry in systemic influence, with sustainability and energy benchmarks serving as the primary transmitters of volatility. In contrast, technology megacaps and clean energy ETFs absorb spillovers, reflecting their differing roles within the financial network.
Bootstrapped CI and SE for the Net Spillover (NET).

Conclusion and Policy Implications
This paper investigated the connectedness among energy ETFs, sustainability ETFs, and U.S. technology sector indices over the period 2014 to 2024 using a Quantile VAR (QVAR) and TVP-VAR framework. By combining quantile-based spillover analysis with rolling-window and subsample robustness checks, we provide new evidence on the asymmetric and regime-dependent nature of financial contagion across these asset classes. The results show that connectedness is consistently high, but its transmission channels vary substantially across market states. In normal conditions, broad benchmarks such as the sustainability index (DSI) and technology sector ETF (XLK) act as dominant transmitters of volatility, while individual technology stocks and renewable ETFs primarily absorb shocks. During COVID-19, systemic risk intensified, with traditional energy ETFs (XLE, VDE, IYE) becoming the main spillover hubs, while clean-energy and technology assets shifted into receiver roles. Following the COVID-19 pandemic, systemic leadership shifted its focus to sustainability and technology sector indices. At the same time, the clean-tech ETF (QCLN) emerged as a new transmitter, reflecting the rising systemic importance of ESG-related investments.
Robustness checks using alternative rolling-window sizes, TVP-VAR estimates, and structural break tests confirm the stability of these results. Notably, the comparative analysis across quantiles reveals a reversal of roles between transmitters and receivers: technology and ESG benchmarks drive spillovers under normal conditions, whereas traditional energy sources dominate during crises. Taken together, the results reveal three consistent patterns. First, connectedness intensifies during crises, particularly COVID-19, where sustainability ETFs emerged as shock transmitters rather than diversifiers. Second, the role of technology indices such as XLK shifted across regimes, serving as stabilizers pre-COVID but amplifying spillovers during market stress. Third, while clean energy ETFs demonstrated increasing integration post-COVID, traditional energy ETFs (XLE, VDE) regained dominance in transmitting shocks during energy price surges.
This study also makes a direct contribution to understanding the systemic role of the U.S. technology sector within the broader energy–sustainability financial ecosystem. Our QVAR and TVP-VAR results reveal that major technology indices and constituents such as AAPL, MSFT, GOOG, and XLK often act as influential transmitters of shocks—particularly during market stress—highlighting their centrality in cross-asset contagion networks. The findings demonstrate that technology stocks not only absorb volatility from energy and sustainability ETFs during normal periods but become key amplifiers of systemic risk under extreme conditions. This underscores the evolving role of the U.S. technology sector from a traditionally defensive asset class to a dynamic conduit through which shocks propagate across clean energy and traditional energy markets. By documenting these quantile-dependent spillover patterns, our study provides new insights into how technology-driven innovation cycles, investor sentiment, and liquidity conditions shape interdependencies with energy-linked financial assets.
Policy Implications
These findings carry several implications. For investors, portfolio hedging strategies should account for quantile-specific spillover dynamics, as average connectedness estimates may mask regime shifts. For policymakers and regulators, the evidence highlights the systemic importance of both traditional and clean-energy ETFs, suggesting that energy markets both fossil and renewable should be monitored as nodes of contagion in times of crisis. To enhance market resilience, the following measures are recommended:
Establish early-warning indicators to monitor rising systemic stress in energy and technology-linked ETFs—particularly during tail-risk market conditions where spillovers intensify.
Enhance ETF liquidity monitoring, especially for clean-energy and sustainability ETFs that act as net receivers of shocks during crises and may be more vulnerable to investor withdrawals or liquidity shortages.
Implement cross-asset stress testing frameworks that incorporate energy, sustainability, and technology sectors simultaneously to capture realistic contagion channels revealed by QVAR and TVP-VAR spillover measures.
Encourage development of diversified ETF structures, particularly for sustainability and clean-energy funds, to mitigate concentration risk and enhance shock absorption capacity.
Coordinate macroprudential oversight across energy and technology markets, as shocks in one sector increasingly propagate to the other under extreme conditions, highlighting the need for integrated supervision.
Support market-wide volatility buffers, such as circuit breakers or liquidity facilities, designed specifically for sector-linked ETFs that exhibit heightened spillover sensitivity during crisis periods.
Collectively, these recommendations underscore the importance of proactive monitoring and risk management across interconnected financial markets. Strengthening surveillance of ETFs and technology-energy linkages can significantly enhance market stability, particularly as global capital continues shifting toward renewable energy and ESG-aligned investments.
Footnotes
Funding
The authors disclosed receipt of the following financial support for the research, authorship, and/or publication of this article: The researchers would like to thank Modern College of Business and Science for financial support (MCBS-APC-2026).
Declaration of Conflicting Interests
The authors declared no potential conflicts of interest with respect to the research, authorship, and/or publication of this article.
Data Availability Statement
Data sharing not applicable to this article as no datasets were generated or analyzed during the current study.