
Abstract
This study aims to examine volatility spillover among equity and commodity markets of the United States. The analysis focuses on crude oil (Brent and WTI [West Texas Intermediate]), rice, and gasoline. For the analysis, generalized autoregressive conditional heteroscedasticity (GARCH) (1, 1) model is applied on monthly data for the period of February 2005 to December 2016. Results show that there is no volatility spillover from commodity market (gold, oil, gas, and rice) to equity market, whereas it only exists in few commodity markets, from oil to rice and gas. The study also finds that there is neither mean spillover nor volatility spillover among gold and equity market; therefore, investor can invest in equity and gold to diversify risk of portfolio.
Introduction
Understating the stock market volatility and transmission of volatility between different stock markets has been the key challenges for all market agents, including investors (individual and institutional investor), policy makers, money managers, portfolio managers, and others. After major financial crisis, the volatility transmission between developed and developing countries has also been studied. This kind of study is very essential for such market agents who are interested in knowing the systematic risk and portfolio risk and return at the time of making investment in different stock markets (Mensi et al., 2016).
Market integration refers to interaction between domestic market and international market. Due to the integration of markets, researchers have studied the volatility spillover from one market to another market to mitigate risk (e.g., Domanski & Heath, 2007; Dwyer et al., 2011; Erb & Harvey, 2006; Silvennoinen & Thorp, 2013; Tang & Xiong, 2012). Spillover effect is the event in one market due to an event in another market. In other words, spillover effects are events which happen in one context but they effect events in another context. Existence of spillover effect means that two markets are interconnected and therefore are not isolated. Thus, whatever happens in one market will have effect on the other market.
Numerous studies have been conducted to study volatility spillover from one market to another market. Some studies have examined the volatility spillover from one financial market to another financial market, whereas other studies have examined the link between financial markets and commodity markets (e.g., Du et al., 2011; Hassan & Malik, 2007; He & Chen, 2011; Kumar et al., 2012; Lien & Yang, 2008; Sadorsky, 2012, 2014b; Serra, 2011; Singh et al., 2010; Syllignakis & Kouretas, 2011; Yilmaz, 2010). Recently, Basher and Sadorsky (2016) found the oil as a best hedge in emerging equity markets by making a comparison with bonds. They applied the dynamic-conditional correlation GARCH (generalized autoregressive conditional heteroscedasticity; DCC-GARCH), asymmetric DCC-GARCH, and generalized orthogonal GARCH models to investigate the volatility spillover effect. On the other side, Mensi et al. (2016) investigated the volatility spillover effect among developed (U.S.) market and emerging (BRIC) markets for the time period of 1997 to 2013. They found the strong asymmetric volatility spillover effectiveness between developed and emerging markets. The strong volatility spillover effectiveness between stock market and commodity market was also evidenced by Kang et al. (2017).
The spillover effects among equity and commodity markets are the focus of attention for investors to form well-diversified portfolio. For investors, it is important to know that how does shock transfer from one market to another market and whether the shock in one market has significant influence on the other markets or not. Keeping in view the importance of volatility spillover, this study is designed to explain the volatility spillover among equity market and commodity markets. The purpose of this study is to incorporate the oil (crude oil), gold, rice, gas, and equity market returns to check the volatility spillover effect among them. Previous studies like Sadorsky (2014b), Arouri, Jouini, and Nguyen (2011), Arouri, Lahiani, and Nguyen (2011) have used different commodities to examine volatility spillover than this study.
Literature provides a list of tests to check the volatility spillover among stock market returns and different commodities. GARCH and multivariate GARCH models have been used in literature. Multivariate GARCH models include the vector autoregressive moving average GARCH (proposed by Ling & McAleer, 2003), DCC-GARCH (proposed by Engle, 2002), and BEKK GARCH (proposed by Baba et al., 1990). To achieve the objective of current study, GARCH model is applied.
This article is arranged as follows: “Literature Review” section discusses the relevant literature, followed by data and methodology in “Data and Methodology” section. Results are given in “Results and Discussion” section, whereas “Conclusion” section concludes the article.
Literature Review
Ability to hedge gasoline and oil commodities with their futures is studied by C.-Y. Chang et al. (2010). They applied different models, ordinary least square, multivariate GARCH, state space, error correction, constant-conditional correlation error correction and constant-conditional correlation GARCH (CCC-GARCH), and concluded that bull markets show higher hedging effectiveness as compared with bearish market.
Arouri, Jouini, and Nguyen (2011) have estimated the volatility spillover effect among stock market and commodity market (oil market) by applying the bivariate GARCH models. Evidences of spillover effect were found from commodity market to stock market in the context of Europe. While in the context of United States, bidirectional spillover effect was evidenced in stock and commodity market. These evidences are for the time period of 1998 to 2008, and the data frequency was weekly. Arouri, Jouini, and Nguyen (2011) also estimated the (optimal) hedge ratio and found that every industry sector carries different optimal hedge ratio like utility sector has 0.176 as an optimal hedge ratio while financial sector has 0.001 as an optimal hedge ratio in European context. This work was extended by Arouri, Lahiani, and Nguyen (2011) estimating the volatility spillover effect among Gulf Cooperation Council (GCC) countries. The bivariate GARCH model is applied by Arouri, Lahiani, and Nguyen (2011) to check the volatility spillover effect among stock market and commodity market of GCC countries. They found the strong evidence of volatility spillover effect among GCC countries.
In addition, different models were applied by C.-L. Chang et al. (2011) to hedge the commodity prices with commodity futures. The Brent and WTI crude oil as commodities were analyzed by C.-L. Chang et al. (2011) and applied CCC-GARCH, DCC-GARCH, BEKK GARCH, and vector autoregressive moving average GARCH models. Time-varying hedge ratio was evidenced in this case with the conclusion of DCC-GARCH as a best measure of time-varying hedge ratios.
In the context of Europe, Arouri et al. (2012) tested the volatility spillover effect between equity market and commodity (oil) market. They applied the VAR GARCH on the weekly data of 1998 to 2009 and found the evidences of volatility spillovers. Moreover, Sadorsky (2012) estimated the volatility spillover effect among oil market, technology companies, and clean energy companies by applying the multivariate GARCH model. The data ranged from 2001 to 2010. Results found the clean energy companies’ stock prices are poorly correlated with the oil prices whereas highly correlated with the stock prices of technology companies.
Another asymmetric dynamic-conditional correlation model named as RS-ADCC was used by Pan et al. (2014) to investigate the spillover effect among petroleum products (including gasoline and heat oil) and crude oil market. Evidences of high hedging effectiveness of futures of crude oil and heating oil were found. They also applied the BEKK model to better investigate the spillover effect and found the evidences of high hedging effectiveness of futures of crude oil and gasoline.
Another study was done by Lin et al. (2014) in the context of Nigeria and Ghana to estimate the volatility spillover effectiveness between stock market and commodity market (oil prices). They applied the DCC-GARCH and vector autoregressive GARCH model and found the evidences of volatility spillover effectiveness.
Emerging markets also provide somehow same kind of spillover effect. Sadorsky (2014b) estimated the volatility spillover effect among stock equity market and commodity market (including copper, wheat, and oil prices) by applying the multivariate GARCH models. The evidences were found of the varying hedge ratios. Oil was found the cheapest source of hedging and copper was found the expensive source of hedging for the time period 2000 to 2012. Furthermore, Sadorsky (2014a) investigated the conditional correlation and volatility spillover effect between commodity market (oil and gold) and equity portfolios of SRI (socially responsible investment) of Dow Jones. They applied the CCC-GARCH model. They found that SRI behaves similarly as the S&P 500.
Literature provides a list of tests to check the volatility spillover among stock market returns and different commodities. GARCH and multivariate GARCH models have been used in literature. Multivariate GARCH models include the vector autoregressive moving average GARCH (proposed by Ling & McAleer, 2003), DCC-GARCH (proposed by Engle, 2002), and BEKK GARCH (proposed by Baba et al., 1990).
After reviewing the relevant literature, we find that investigation of volatility spillover effect among stock and commodity market is keen interest area of researchers. So, this article mainly focuses on the stock market and commodity market incorporating rice, gas, gold, and oil (crude oil) by applying the GARCH model.
Data and Methodology
To test the volatility spillover between equity market and different commodity markets, this study uses monthly returns of equity index (S&P500), rice, gas, gold, and crude oils: Cushing West Texas Intermediate (WTI) as a reference crude oil for the United States, and Europe Brent as a reference crude oil for the North Sea. Monthly returns are calculated by
In literature, most of the researchers support the use of GARCH model to examine volatility spillover among markets. To use GARCH model, it is required to check the presence of autoregressive conditional heteroscedasticity (ARCH) effect in variables. It is also important to know stationarity of return series for further analysis. Therefore, Augmented Ducky Fuller (ADF) and Phillips–Perron (PP) tests are used to check whether the return series is stationary or not, and the results show that return series of all variables are stationary at level. Furthermore, we test the ARCH effect by using heteroscedasticity test and find that there is ARCH effect in variables. Because of the persistence of ARCH effect, we test GARCH model, and, particularly, GARCH (1,1) is used after checking autocorrelation function and partial autocorrelation function (ACF and PACF) and it is removed at order 1.
Mean equation:

Volatility equation:


where
Table 1 reports the results of summary statistics of variables used in study. The mean values show the average monthly return on indices, and the gold index has the highest return, although the risk is low as compared with WTI and BRENT (oil indices) having highest standard deviation. All indices are negatively skewed, which shows that most of the investors seek negative returns from these indices. Jarque–Bera test is also applied to check the normality of data, and significant p values show that returns are not normally distributed except for gold and rice returns.
Summary Statistics.
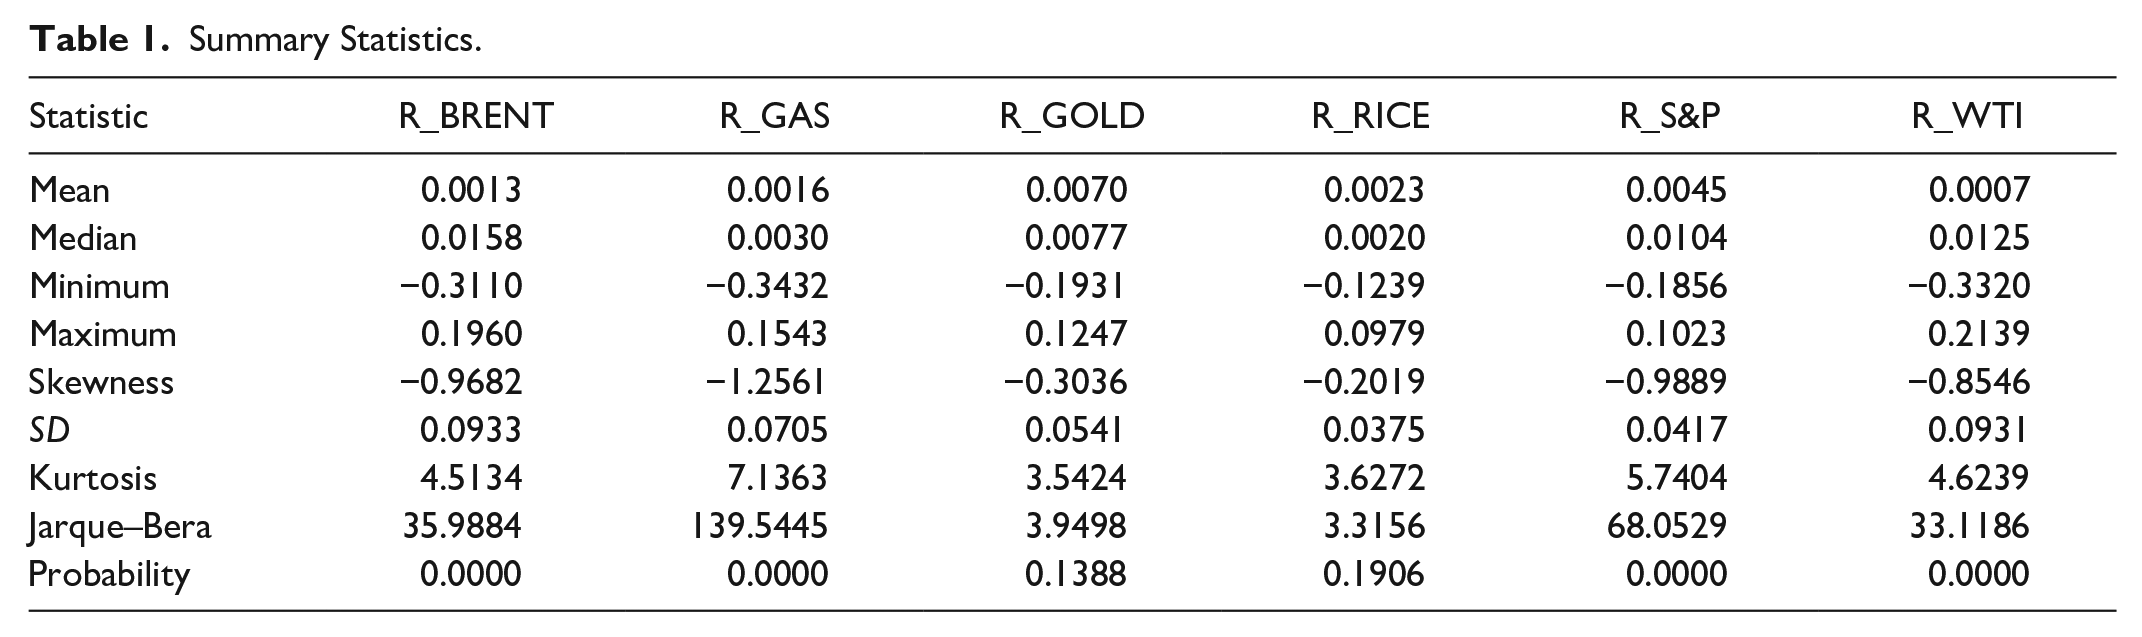
This table reports the descriptive statistics of the following variables: S&P500 index return, return on rice price, return on gold, return on gas prices, two crude oils: Cushing WTI and Europe Brent (former is benchmark [reference crude oil] for the United States and later is benchmark [reference crude oil] for North Sea). The analysis uses monthly data from February 2005 to December 2016.
Results and Discussion
Results of correlation among variables are presented in Table 2. We find that there is a strong positive correlation of gas and equity index with crude oil indices (WTI and Brent). The relationship is also significantly positive of gas index with all except rice index, whereas gold index does not have significant correlation with any index. Although the relationship among few indices is significant, there can be spillover effect among markets.
Correlation Matrix.

is 1, 5 , 10 % level respectively.
This table reports the correlation among the following variables: S&P500 index return, return on rice price, return on gold, return on gas prices, two crude oils: Cushing WTI and Europe Brent (former is benchmark [reference crude oil] for the United States and the latter is benchmark [reference crude oil] for North Sea).
Variance shows the volatility spillover (interdependency) among markets that whether movements in a market can also bring variations in the other market or not. Panel B (Table 3) reports the result of Model 1 where R_S&P500 is dependent variable and R_gold, R_Brent, R_Gas, R_Rice, and R_WTI are independent variables. Results show that there is significant ARCH and GARCH effect from commodity to equity market, but there is no volatility spillover from commodity to equity market. Results depict that the mean spillover exists from crude oil (Brent and WTI) to equity index, which shows that the change in return of oil also has effect on equity return. This finding is consistent with Ewing and Malik (2016), Arouri, Jouini, and Nguyen (2011), and Belgacem et al. (2015). Ewing and Malik (2016) found that volatility in oil prices affects volatility of U.S stock market represented by S&P 500 index. Similarly, Arouri, Jouini, and Nguyen (2011) found that oil market volatility spills over to stock market in the case of Europe, and this finding is in line with our finding. Belgacem et al. (2015) also found that volatility in oil markets affects volatility of stock market in the case of U.S stock market.
Estimates of GARCH model.

Note. GARCH = generalized autoregressive conditional heteroscedasticity.
is 1, 5 , 10 % level respectively.
We also examine the shock transmission from one commodity market to another commodity market and from equity market to commodity market. Panel B of Table 3 reports the result of Model 2 where return on BRENT is dependent variable, and volatility spillover is not present, but in Panel C, where we use WTI (crude oil index) as dependent variable, volatility spillover persists from rice index to oil index. Therefore, the variations in prices of rice also cause variation in oil index. For spillover effect from equity market and commodity market to rice market (Panel E of Table 3), results show that there is no any mean or volatility spillover, and then rice can be used as a safe hedge. In the turmoil period, investors wish to have more investment in commodity and it can also be used in portfolio to diversify the risk and to develop optimal portfolio.
Conclusion
To examine volatility spillover among markets, this study uses equity index, gold index, crude oil (Brent and WTI) index, rice index, and gas index. GARCH model is used to check the spillover effect between markets of the United States. The findings show that volatility spillover exist from Brent to Rice and WTI and Brent, and from WTI to gas, whereas no volatility spillover exist from commodity market to equity market. Therefore, volatility of commodity market does not forecast the volatility of equity market, and the same for vice versa. For commodity markets, rice (commodity market) is less sensitive to shocks as compared with others as there is no mean and spillover effect exist. The results also show that there is neither mean spillover nor volatility spillover among gold and equity market. So to minimize the risk, investor can form optimal portfolio by investing in gold and stocks simultaneously.
In addition to this, the spillover effect prevails among some commodity markets as the shocks in one commodity market significantly transfer to another commodity market. In comparison of different markets, we find that Gas index is most sensitive to shocks, whereas rice index is least sensitive. Investors and portfolio managers can use this information to decrease the exposure to risk as if there is volatility spillover among the markets, and then the negative shocks in one market can badly effect the return on investment. Therefore, it is of major concern of investors to know about volatility spillover among different markets.
Footnotes
Acknowledgements
The authors are thankful to the management of Sukkur IBA University for providing us conducive environment for the research. They are especially thankful to Dr. Niaz Bhutto, Head of Business School, whose support and guidance enabled us to pursue our goals.
Author Contributions
All the authors have equally contributed in writing of this article.
Availability of Data and Materials
Data have been collected from the websites of the U.S. Energy Information Administration and International Grains Council for the time period of February 2005 to December 2016.
Declaration of Conflicting Interests
The author(s) declared no potential conflicts of interest with respect to the research, authorship, and/or publication of this article.
Funding
The author(s) received no financial support for the research, authorship, and/or publication of this article.