
Abstract
Using the DCC-GARCH model, this study examines the return and volatility spillovers between crude oil and emerging Latin American stock markets during the entire studying period and two subsamples, including the global financial crisis and the Chinese Stock market crash. The findings reveal a positive causal effect from Brazil and Mexico’s stock price changes to the oil market during the global financial crisis. During the Chinese stock market crash, the return spillover is unidirectional from the oil to Brazil and Mexico equity markets. The findings show no significant volatility transmission between oil and Latin American stock markets during the global financial crisis. Contrarily, we observe bidirectional volatility transmission between the oil and Brazilian stock markets during the Chinese stock market crash. Finally, we calculate the optimal weights and hedge ratios for the oil and stock portfolios. In comparison to the global financial crisis, the results suggest that lesser oil assets are required to minimize portfolio risk in the Chinese stock market crash. These results offer valuable insights for portfolio diversification, asset pricing, and risk management.
Keywords
Introduction
The global markets have become increasingly volatile after the opening of economies and financial liberalization in the last two decades. This phenomenon motivates to examine the return and risk spillovers across markets. Within the oil–stock nexus, the return spillover analysis refers to the impact of changes in oil (stock) returns on stock (oil) returns, whereas volatility spillover analysis estimates the impact of changes in oil (stock) volatility on stock (oil) volatility. Increased oil prices and uncertainty have a negative impact on stock markets, equity investor’s wealth, and consumption of general public. The return and volatility connectedness between assets (i.e., oil and stock) vary over time (Bouri, 2015; Yousaf & Ali, 2020), especially during crisis periods; therefore, portfolio managers need to adjust their assets allocation over time to make their investment portfolio more resilient during the times of recession or turbulence (Bouri, 2013; Yousaf & Ali, 2021). The return and volatility connectedness analysis provides useful insights to the portfolio managers, investors, and regulators regarding asset allocation, asset pricing, and risk management.
Several financial crises have adversely affected the Latin American (LA) stock markets and their respective investors, like the Asian crisis (1997–1998), the global financial crisis (GFC)—2007 to 2008, and the Chinese Stock Market (CSM) Crash—2015 to 2016. The recent crisis originated from the CSM, and it adversely affects many other stock markets. The Chinese equity market was crashed in 2015 (Ahmed & Huo, 2019; Han & Liang, 2017; Yousaf et al., 2020a, 2020b; Yousaf & Hassan, 2019b). During this Chinese crisis episode, the CSI-300 index was dropped 34% in just 20 days. The value of more than 50% shares slashed to half in the recent episode of the CSM crash. After a rapid decline, there were many attempts made by Chinese authorities to overcome this problem. The CSM crash has also affected the LA stock markets and world oil market because China is the biggest trade partner of the many LA countries, and China is the biggest importer of oil globally (Gillespie, 2015).
The association between oil and LA stock markets is not yet investigated during the CSM crash in literature. The majority of previous work has analyzed the oil–stock nexus (see, for example, Arouri et al., 2011a; Bastianin & Manera, 2018; Ewing & Malik, 2016; Guesmi & Fattoum, 2014; Khalfaoui et al., 2019; Ready, 2017; Sadorsky, 1999; F. Wen et al., 2019; Xiao et al., 2018). Some studies examine the spillover across the oil and equity markets during the GFC and other financial crisis (Ajmi et al., 2014; Aydoğan et al., 2017; Bouri, 2015; Cai et al., 2017; Ferreira et al., 2019; Li & Giles, 2015; Liu et al., 2017; Luo & Qin, 2017; Mollick & Assefa, 2013; Tsai, 2015; Wei et al., 2019; X. Wen et al., 2012). However, the only notable study of Yousaf and Hassan (2019) has examined the oil–stock (Asian markets) nexus during the CSM crash of 2015. The aforementioned studies show that none of the studies have investigated the connectedness between oil and LA equity markets, especially during the crisis.
The current research fills the aforementioned literature gaps by analyzing the spillover (returns and volatility) between oil and emerging LA stock markets during the Chinese equity market crash. To provide a better and in-depth understanding of the impact of the CSM crash, this study also estimates spillover between oil and emerging LA stock markets during the entire studying sample period (2000–2018) and the GFC. We also add the portfolio analysis by computing the optimal portfolio weights and optimal hedge ratios during all sample periods. Finally, we use the DCC-GARCH framework to estimate conditional variances and covariances that are ultimately used to estimate spillovers.
The upcoming sections are organized as follows: Section “Literature Review” provides a literature review. Section “Data and Methodology” presents the data and methodology. Sections “Empirical Results” and “Conclusion and Recommendations” present the findings and conclusion of the study, respectively.
Literature Review
The theoretical and empirical linkages between oil and stock prices are provided below using several theories and empirical studies. According to the equity pricing model, the stock value depends on the present values of expected future cash flows. Apergis and Miller (2009) assert that future corporate cash flows are affected by the change in oil prices and macroeconomic variables. The primary economic rationale is that high oil prices increase production costs, and ultimately, net income (or cashflows) decreases due to the high cost of production. In parallel, the inflation level becomes high due to high oil prices, and then interest rate increases to control inflation in the economy through monetary policy, ultimately discount rates and interest become high. Overall, either a high discount rate or low expected corporate cash flows leads to a lower stock price and vice versa.
Apart from the equity pricing model, the oil–stock nexus can also be explained through the portfolio diversification theory. Portfolio investors construct different asset portfolios (i.e., oil and stock) to get the maximum benefit of diversification (Yousaf & Ahmed, 2018). Investors can maximize the diversification benefits if the relationships between different assets are weak or negative (Markovitz, 1959). The linkages between different asset classes, like oil and stock, provide helpful information to portfolio managers to diversify the portfolio risk, especially during the crisis period.
Several studies have examined the association between oil and equity markets of developed countries. While studying the oil–stock nexus (Sadorsky, 1999) finds that price and volatility of oil significantly affect the equity returns. Faff and Brailsford (1999) find a significant impact of oil prices on stock returns of some sectors (Paper and Packaging, Oil and Gas, and Transport) in Australia. Ciner (2001) examines the association between energy shocks and U.S. equity returns and reports the significant influence of crude oil price shocks on equity returns of the United States.
El-Sharif et al. (2005) provide evidence of the direct association between equity and oil returns in the United Kingdom. Anoruo and Mustafa (2007) report the cointegration among oil and equity markets in the United States. Park and Ratti (2008) investigate the oil–stock nexus in the United States and European countries and find the positive impact of stock returns on the crude oil markets of oil exporting country of Norway. Moreover, equity returns and oil price volatility are inversely related to each other in European countries. Miller and Ratti (2009) report the negative relationship between oil and global stock markets in the long run. Malik and Ewing (2009) provide evidence of volatility linkages between oil and few U.S. sectoral indices. Lake and Katrakilidis (2009) find no evidence of return transmission among oil and the equity markets of the United Kingdom, United States, Greece, and Germany.
Arouri, Jouini, and Nguyen (2011) study the volatility linkages across the oil and equity markets in the United States and Europe at the sector level. This study finds the volatility transmission between the oil and sectorial equity returns. Arouri et al. (2012) conclude that different equity sectors are not equally affected by oil price changes. Moreover, they find that volatility effects are significant from oil to industry-level equity returns. Mensi et al. (2013) find significant spillovers among S&P 500 and energy markets. Degiannakis et al. (2013) report the time-varying return transmission between the oil and European sectorial equity markets.
Chang et al. (2013) look at the volatility linkages between crude oil and two developed markets (the United Kingdom and the United States). It reports the presence of volatility transmission between crude oil and the equity market returns. Reboredo and Rivera-Castro (2014) study the association between oil and the equity markets in the United States and Europe. The results demonstrate that the change in oil prices is not significantly affecting the equity market returns in the pre-crisis episode. However, during the GFC, they report significant financial contagion between oil and equity markets.
Salisu and Oloko (2015) examine the association between crude oil and U.S. equity markets. The results find that there is a presence of positive return spillover from the U.S. equity to the oil market. Khalfaoui et al. (2015) examine the association between oil and equity markets of Japan, Canada, Germany, France, Italy, the United States, and the United Kingdom. They report the significant mean and volatility spillover between the oil and equity market returns. Xu et al. (2019) confirm the presence of asymmetric volatility transmission among the oil and U.S. equity market.
Some studies have explored the association among oil and equity markets of developing and frontier markets. While studying the sample of Gulf countries, Hammoudeh and Aleisa (2004) report a bidirectional association between oil prices and the Saudi Arabian equity market. Malik and Hammoudeh (2007) confirm the volatility spillover from oil (Saudi Arabia stock) to stock (oil)market of Kuwait, Oman. Basher and Sadorsky (2006) conclude that crude oil price risk significantly affects the emerging market’s equity returns. Maghyereh (2006) finds a weak association between oil shocks and equity returns of emerging markets while studying a sample of 21 emerging markets from 1998 to 2004.
Maghyereh and Al-Kandari (2007) empirically prove the nonlinear association between oil and Gulf Cooperation Council (GCC) stock markets. F. Wen et al. (2019) also find a nonlinear relationship between oil and the Chinese equity market. Ajmi et al. (2014) report a nonlinear association between oil and equity markets of Middle East and North Africa (MENA) during the turmoil period. Cong et al. (2008) report an insignificant influence of oil price shocks on most Chinese sectorial equity indices except for the oil and manufacturing sector index.
Narayan and Narayan (2010) and Bhar and Nikolova (2010) confirms that crude oil significantly affects the stock market of Vietnam and Russia. Arouri, Lahiani, and Nguyen (2011) provide the evidence of mean and the volatility spillover between world oil prices and GCC stock prices. Awartani and Maghyereh (2013) report similar results while studying the oil–stock (GCC) nexus. Arouri and Rault (2012) confirm the existence of connectedness among the oil and equity prices in GCC countries. Aloui et al. (2013) find similar results while studying the sample of Council for Economic Education (CEE) economies. Lin et al. (2014) report the strong volatility spillover from stock to the oil market in Ghana. Uzo-Peters et al. (2018) report that oil shocks negatively affect the Nigerian oil and gas sector. Bouri et al. (2017) report the return transmissions from oil to Indian equity market. Noor and Dutta (2017) provide no evidence of volatility linkages between south Asian equity markets and crude oil.
Few studies have examined the association between oil and equity markets during the crisis period. It is essential to study spillover between different markets during financial crises because the spillovers can differ in crises and noncrises periods. Fayyad and Daly (2011) investigate the volatility spillover from oil prices to equity returns for the seven countries (United States, United Kingdom, Oman, Kuwait, United Arab Emirates (UAE), and Bahrain). The study reports the predictive power of crude oil for equity returns during the GFC. Furthermore, UAE, the United Kingdom, and Qatar showed high responsiveness to oil shocks compared to the United States, Bahrain, Oman, and Kuwait.
Liu et al. (2017) examine the spillovers between oil and equity market returns during the three time-phases: before, during, and after the crisis period. The findings show evidence of the weakening association between crude oil and the U.S. equity market in the long run, while an association between the oil and the Russian equity market is strengthening in all time scales. Moreover, the Russian and U.S. stock markets show the opposite trend of falling oil prices during post-crisis time. These studies reveal that spillover across oil and stock markets varies during the crisis. Overall, literature has remained silent on the oil and LA stock nexus during the GFC and the recent CSM crash. Therefore, it is a significant research gap to explore the oil–stock nexus during these crises.
Data and Methodology
Data Description
The data covers the four emerging LA stock markets’ daily stock indices, namely Brazil, Mexico, Chile, and Peru. These emerging markets are selected from the MSCI (Morgan Stanley Capital International) Emerging Market Index (Yang et al., 2018; Yousaf et al., 2020). The data of stock indices are obtained from the “Data Stream database.” As two-thirds of the international oil exchange uses Brent oil markets as a pricing benchmark (Fattouh, 2011; Maghyereh, 2004); therefore, we use daily Brent spot prices taken from the “Energy Information Administration” (EIA). Following Yousaf and Hassan (2019), this study calculates the spillovers during three time periods, (a) the entire studying period (2000–2018), (b) the GFC (August 2007 to July 2010), and (c) the CSM Crash (June 2015 to May 2018).
Methodology
The econometric specification in this study consists of two components. First, we use vector autoregression (VAR) with one lag to estimate return spillovers. In line with Arouri et al. (2011b), Tamakoshi and Hamori (2013), Singhal and Ghosh (2016), and Chen et al. (2020), we use the DCC-GARCH model, proposed by Engle (2002), as a benchmark to estimate the time-varying variances, covariances, and volatility spillovers.
Conditional Mean
The VAR model is employed as a conditional mean equation of the DCC-GARCH model. The mean equation is specified as follows:

where
Conditional Variance
For two assets, stock and oil, the bivariate DCC-GARCH model has the following specifications:

where

where c is a constant, and

where


where
Optimal Weights and hedge ratios
The variances and covariances of the DCC-GARCH model are used to estimate the optimal portfolio weights and hedge ratios. Following Kroner and Ng (1998), we estimate optimal portfolio weights for stock and oil-based portfolios as:


where

where
Empirical Results
Descriptive Analysis
The summary statistics of LA stocks and oil returns are presented in Table 1. The mean return of the Peru stock market is the highest, while the lowest for the crude oil market during the entire studying period. The standard deviation of Chile stock returns is the lowest, while the highest in oil market returns. The Peru stock market provides higher returns with lower risk, whereas the oil market provides the lowest returns with higher risk during the entire studying period. Skewness is negative, and kurtosis is higher than 3 in all cases. Jarque–Bera statistics do not accept the hypothesis of the normality of all series.
Descriptive Statistics.

Note. Q Stat, Ljung-Box Q statistics; BRAZ, Brazil; CHIL, Chile; MEXI, Mexico; ARCH, Autoregressive Conditional Heteroscedasticity.
Denote the significance at 1%.
Moreover, there is significant evidence of autocorrelation for all series. Finally, there is strong evidence of the ARCH effect in all series. Table 2 reports the results of the unit root test for all series. This study applies the Augmented Dickey–Fuller (ADF) test and Phillip–Perron test to check the stationarity of all series. Each test is applied three times, with “no constant and trend,” “constant,” and “constant and trend.” The results depict that all series are significant while applying ADF and Phillip–Perron test; thus, there is no evidence of stationarity in any series.
Unit Root Tests.

Note. ADF = Augmented Dickey–Fuller test; BRAZ = Brazil; CHIL = Chile; MEXI = Mexico.
Results of Spillover Between Oil and LA Stock Markets
Entire studying period results
The results of return and volatility spillover across crude oil and LA emerging equity market for the entire studying period are reported in Table 3. The past own stock returns of LA markets significantly affect current stock returns. It suggests that the change in past stock prices predicts current stock prices in the short run for emerging LA stock markets. Furthermore, one period–lagged crude oil returns do not significantly affect the current crude oil returns during the entire studying period. It implies that we cannot predict future oil prices through past oil prices in the short run. The return spillover from oil to Peru, Chile, and Brazil markets is found to be significant. However, the mean spillover from Brazil, Mexico, and Peru to the oil market is significant. Overall, we find bidirectional return spillover for the two pairs of oil-Brazil and oil-Peru stock markets during the entire studying period.
Estimates of Bivariate DCC-GARCH for Oil and Latin American Stock Markets During the Entire Studying Period.

Note. DCC-GARCH (Dynamic conditional correlation-Generalized Autoregressive Conditional Heteroscedasticity). AIC (Akaike information criterion) and SIC (Schwartz information criterion) criteria are used for the selection of a number of lags. JB, Q(12), and Q2(12) denote the empirical statistics of Jarque–Bera test for normality, Ljung-Box Q statistics of order 12 for autocorrelation applied to the standardized residuals and squared standardized residuals, respectively. BRAZ, Brazil; CHIL, Chile; MEXI, Mexico. Values in parentheses are the p values. ***,**,* indicate the statistical significance at 1%, 5%, and 10%, respectively.
The results indicate that past own shocks’ sensitivity is significant and positive for LA equity markets. In LA emerging stock markets, past own shock coefficient is smaller than the coefficient of past own volatility, meaning that lag volatility is a more significant factor in forecasting future volatility than lag shocks. Besides, the sensitivity of past own shocks and volatility is significant for oil markets. The conditional volatility of Brazil and Mexico’s equity market is significantly affected by the shocks in the oil market. Therefore, oil market shocks lead to the rise in volatility of the Brazil and Mexico equity market. However, the volatility of the oil market is not significantly influenced by the shocks in LA stock markets.
The findings reveal that volatility spillover is insignificant from the oil market to LA equity markets. Furthermore, the volatility spillover is unidirectional from Brazil to the oil market during the entire studying period. It implies that portfolio managers can reduce the risk by making the portfolio oil and LA equity markets (except Brazil) during the entire studying period.
Results for GFC
Table 4 represents the results of return and volatility linkages between the crude oil and LA emerging stock markets in the GFC. The current returns are influenced by the past returns in the equity markets of Chile and Peru. It implies that past stock prices of Chile and Peru help in forecasting the future prices in the short run in the GFC. Moreover, current oil returns are not significantly affected by their lagged returns.
DCC-GARCH Bivariate Estimates for Oil and Latin American Stock Markets During the Global Financial Crisis.
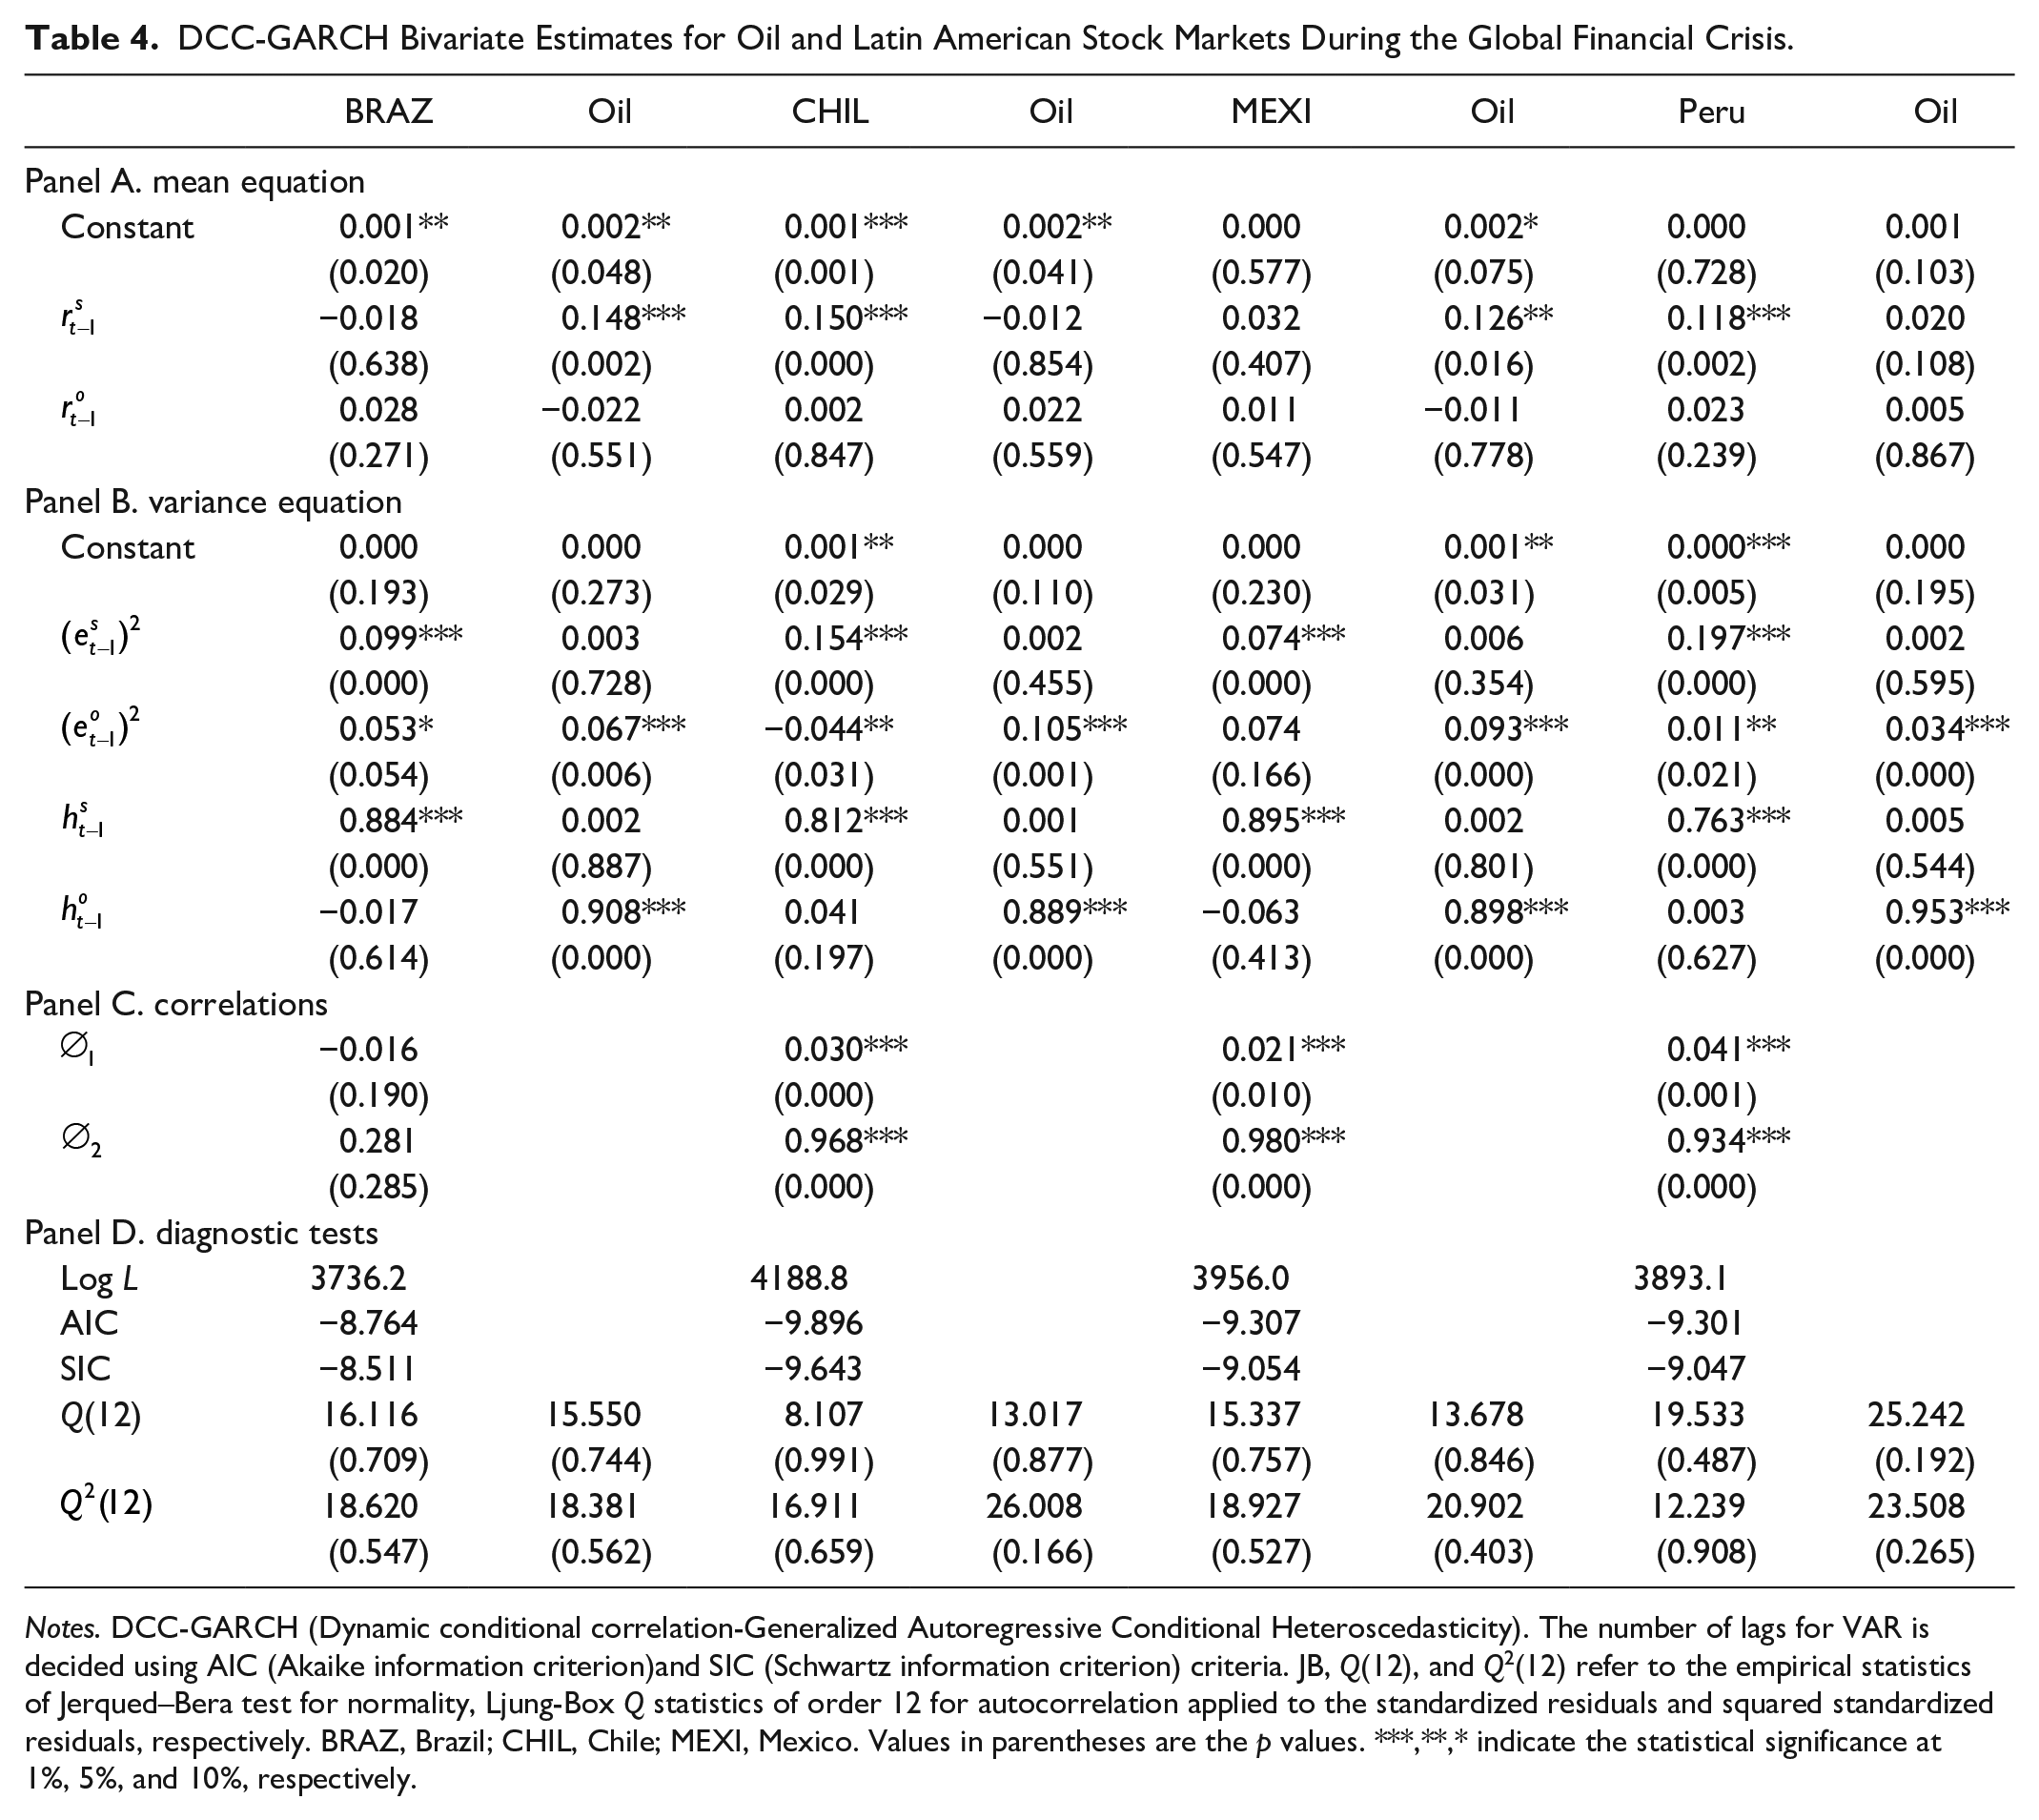
Notes. DCC-GARCH (Dynamic conditional correlation-Generalized Autoregressive Conditional Heteroscedasticity). The number of lags for VAR is decided using AIC (Akaike information criterion)and SIC (Schwartz information criterion) criteria. JB, Q(12), and Q2(12) refer to the empirical statistics of Jerqued–Bera test for normality, Ljung-Box Q statistics of order 12 for autocorrelation applied to the standardized residuals and squared standardized residuals, respectively. BRAZ, Brazil; CHIL, Chile; MEXI, Mexico. Values in parentheses are the p values. ***,**,* indicate the statistical significance at 1%, 5%, and 10%, respectively.
The return transmission is insignificant from oil to LA markets. However, the mean transmission effects from Brazil and Mexico stock markets to crude oil markets are seen to be highly significant. Thus, unidirectional return spillover is noticed from Brazil and Mexico to the oil market in the GFC.
The past own shocks and volatility effects are significant in oil and LA stock markets during the GFC. The coefficient of past own volatility is higher than the coefficient of the past own shock in LA equity markets, proposing that past own volatility is a more critical factor in estimating the future volatility than past own shocks. Moreover, the shock spillover is unidirectional from the oil to Brazil, Peru, and Chile markets in the GFC. Finally, the volatility is not transmitted between oil and LA stock markets during the GFC. It implies that portfolio managers can attain the highest benefit of diversification by making oil–stock portfolios in the GFC.
Results for CSM crash
Table 5 represents the return and volatility transmission across the oil and emerging LA equity markets during the CSM crash. The lagged returns significantly influence the current stock returns of most LA equity markets (except Brazil). Therefore, returns can be forecasted for the short run in LA stock markets. Moreover, we find no significant relationship between past and current oil returns in the majority of cases, suggesting that the current oil prices do not help in forecasting the future oil prices during the CSM crash.
DCC-GARCH Bivariate Estimates for Oil and Latin American Stock Markets During the Chinese Stock Market Crash.
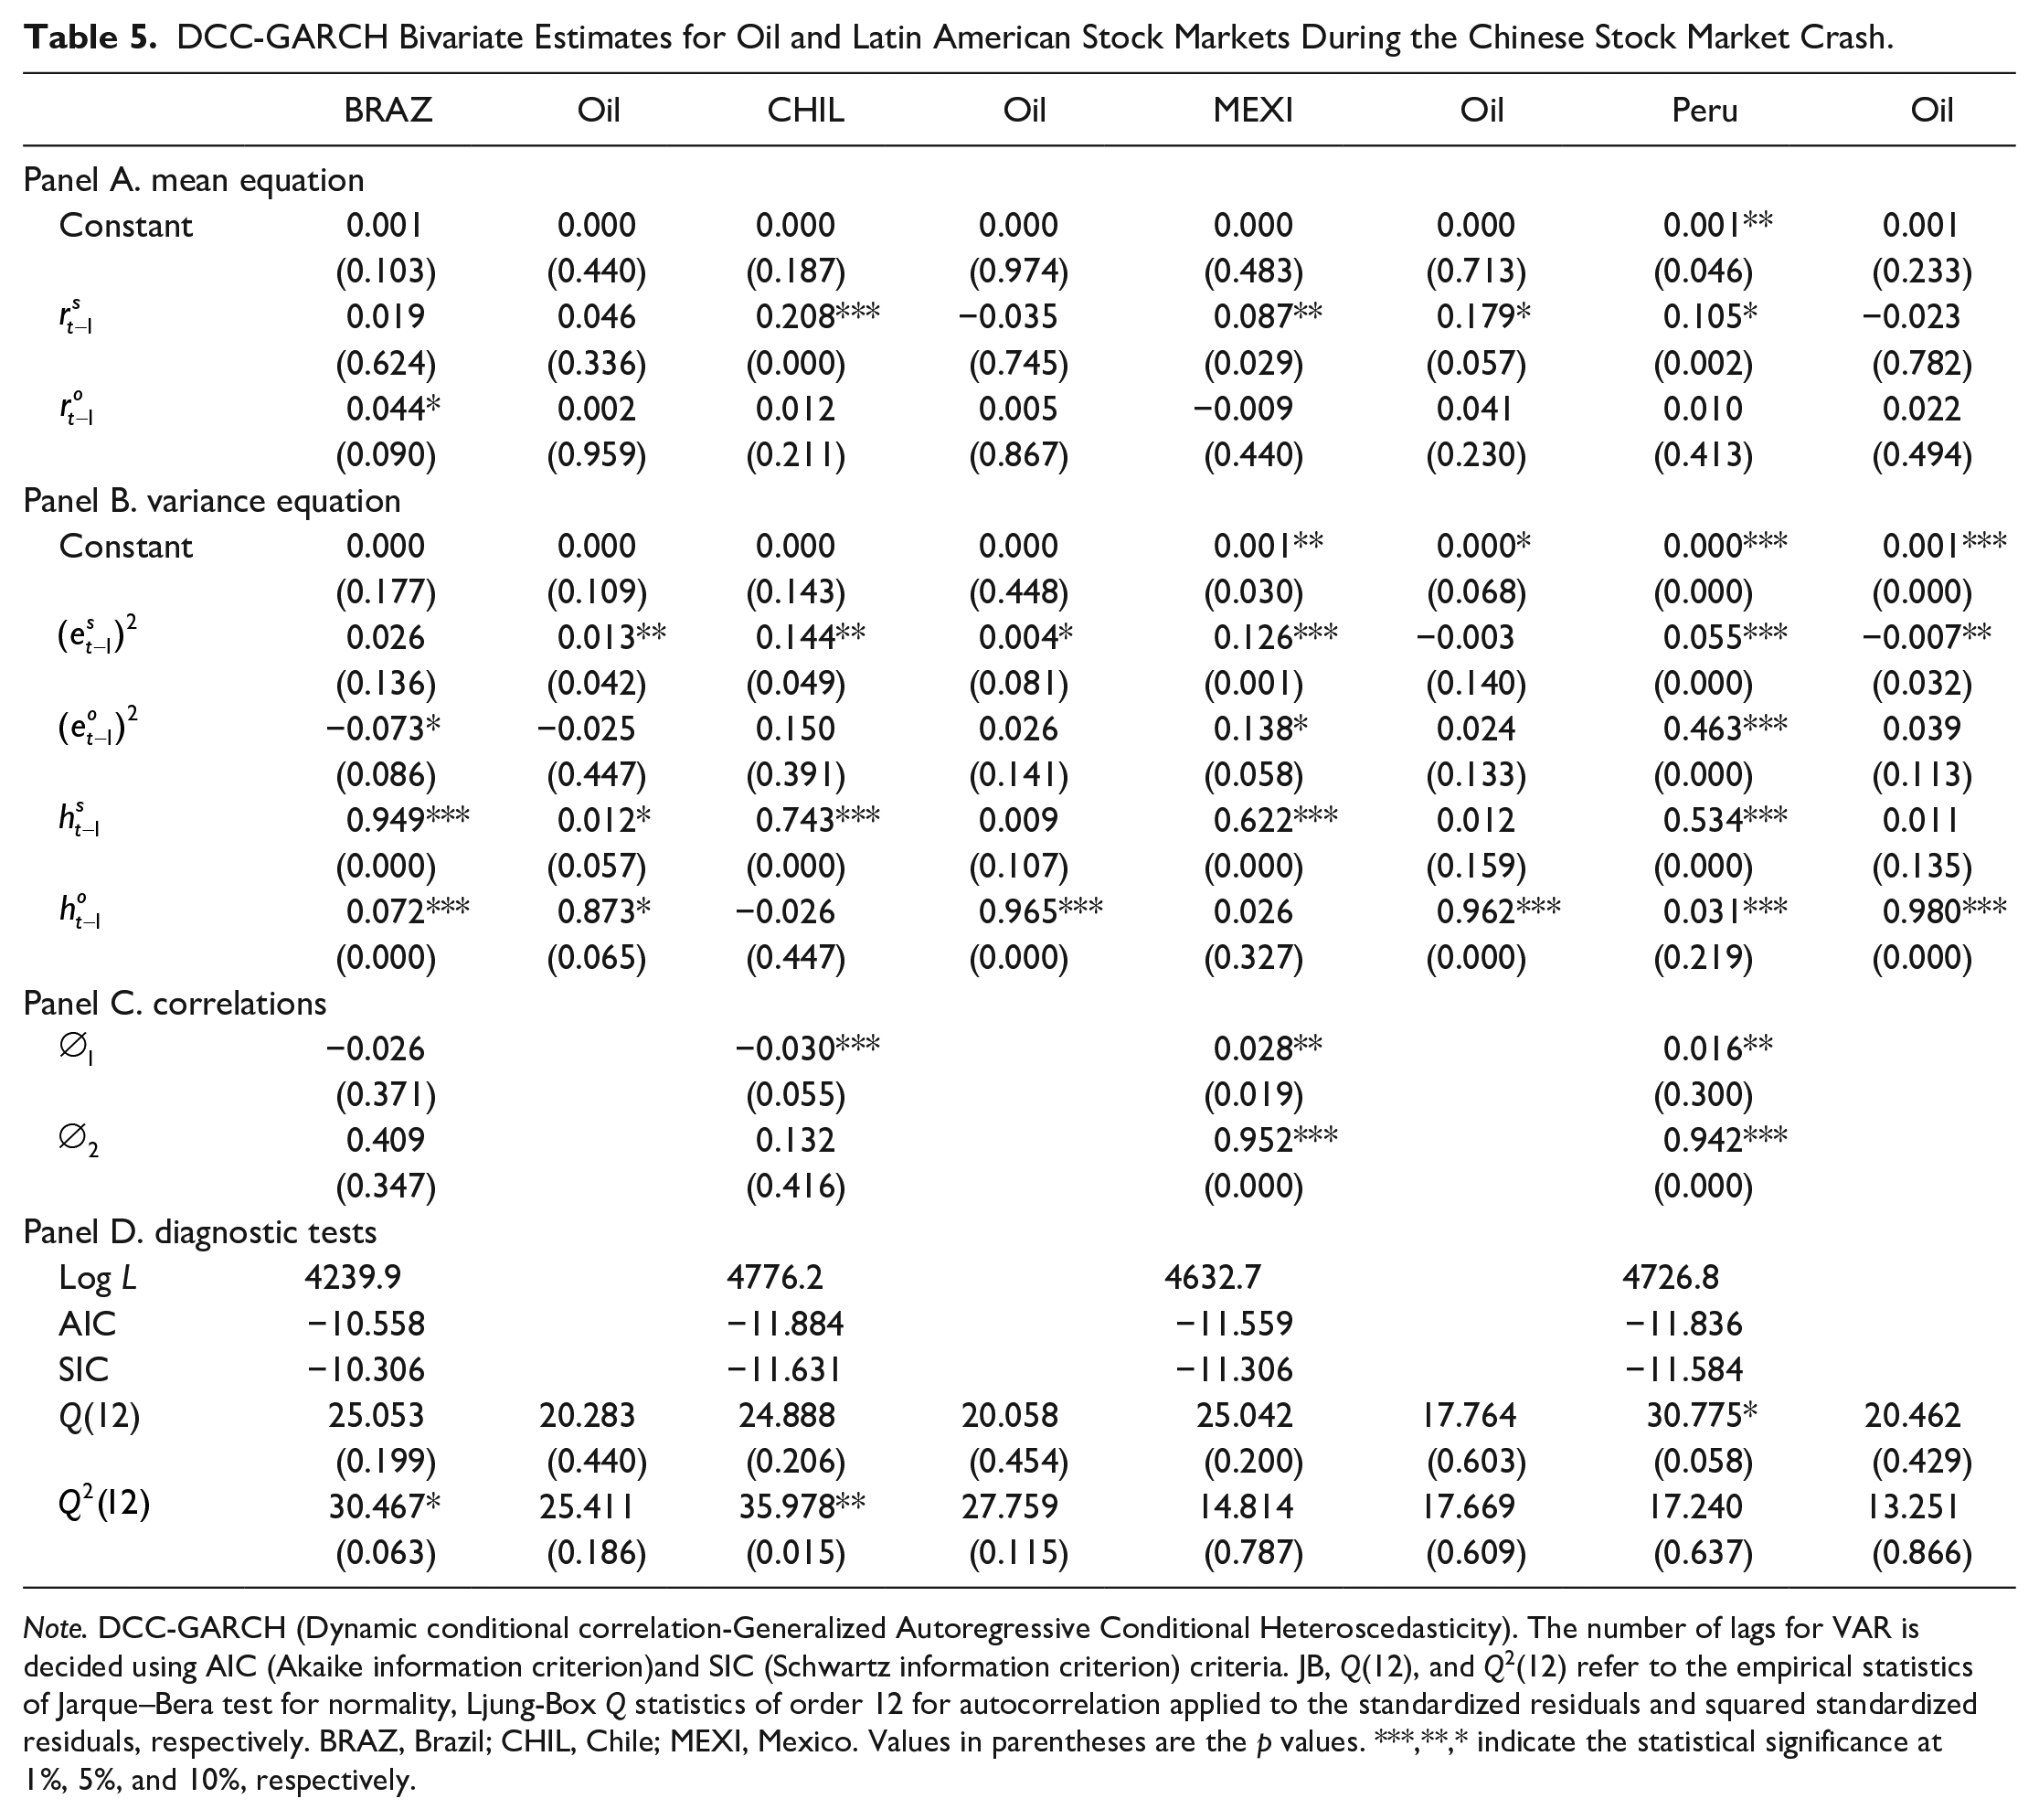
Note. DCC-GARCH (Dynamic conditional correlation-Generalized Autoregressive Conditional Heteroscedasticity). The number of lags for VAR is decided using AIC (Akaike information criterion)and SIC (Schwartz information criterion) criteria. JB, Q(12), and Q2(12) refer to the empirical statistics of Jarque–Bera test for normality, Ljung-Box Q statistics of order 12 for autocorrelation applied to the standardized residuals and squared standardized residuals, respectively. BRAZ, Brazil; CHIL, Chile; MEXI, Mexico. Values in parentheses are the p values. ***,**,* indicate the statistical significance at 1%, 5%, and 10%, respectively.
During the CSM crash, the return spillovers from oil to Brazil and Mexico to the oil market are unidirectional.
The past own shocks’ coefficient is significant in Chile, Mexico, and Peru markets. The past own volatility’ coefficients are significant in the LA markets. Since the coefficient of past own volatility is greater than the coefficient of past own shocks suggesting past own volatility plays a vital role in predicting future volatility in LA markets. The past volatility(shocks) significantly(insignificant) affects the current volatility in the oil market during the CSM crash.
During the CSM crash, there is bidirectional volatility across the oil and the Brazilian stock market, suggesting that investors can diversify their portfolio risk by making a portfolio of oil and Chile, Mexico, and Peru stock.
Portfolio Implications—Optimal Weights and Hedge Ratios
The optimal weights and the hedge ratios for the oil and stock portfolio for all sample periods are provided in Table 6. The optimal weight range is 0.62 for BRAZ/OIL to 0.85 for CHIL/OIL in the entire studying period. The weight of 0.62 for BRAZ/OIL indicates that, for a portfolio of $1, investors should invest 62 cents in Brazil stocks and 38 cents in crude oil. During the entire studying period, the hedge ratio varies between 0.04 for CHIL/OIL to 0.13 for BRAZ/OIL, implying $1 long position in Chile (Brazil) stocks can be hedged with 4(13) cents short position in crude oil.
Optimal Weights and Hedge Ratios.

Note.
During the global (Chinese) crisis, the portfolio weights vary from 0.68 (0.77) for BRAZ/Oil to 0.89 (0.95) for CHIL/Oil pair, and the hedge ratio varies between 0.10 (0.08) for CHIL/Oil to 0.29 (0.24) for BRAZ/OIL.
For optimal oil–stock portfolios, findings suggest that investors allocate at least 60% of their investment to emerging LA equity and the remainder to crude oil. Furthermore, during the GFC, the CSM crisis, the weights of oil in oil–equity portfolios decrease relative to entire studying period weights. The study’s finding suggests that portfolio investors should maintain less oil in both crises compared to the entire studying period in their portfolios. The findings show higher hedge ratios in all portfolios during both crises compared to the entire studying period. It infers that hedging is expensive during crisis periods. Also, hedge ratios are highest in the GFC compared to the CSM crash, which implies that less crude oil is required to reduce the stockholder’s risk during both crises.
Conclusion and Recommendations
We examine the spillovers (return and volatility) between the crude oil and the emerging LA stock markets during the entire studying period, the GFC, and the CSM crash using the DCC-GARCH model. We also compute the optimal weights and hedge ratios for the oil–stock portfolios.
The findings show that the linkage between crude oil and the LA equity markets varies across the different crises. This study reports bidirectional return spillover for the pairs of oil-Brazil and oil-Peru during the entire studying period, and unidirectional return transmission from Brazil and Mexico (oil) to the oil (Brazil and Mexico) market during the GFC (CSM crash).
The study finds unidirectional volatility spillover from Brazil to the crude oil market in the entire studying period, whereas the relationship is insignificant in the GFC, implying that investors can maximize the diversification benefits by making the portfolio of oil and LA stocks during the GFC. During the CSM crash, we find bidirectional volatility transmission between the oil and Brazil market, suggesting that investors can reduce their risk by adding oil in the equity portfolio of Chile, Mexico, and Peru during the CSM crash.
The study shows that oil assets weight decreased during the CSM crash in the oil–stock portfolio compared to the entire studying period and GFC, suggesting that portfolio managers and investors should reduce their investment in oil for the oil–stock portfolios during the CSM crash. On aggregate, all optimal weights suggest that investors should allocate at least 60% of investment in emerging LA stocks and remaining in oil assets for optimal oil–stock portfolios. However, the optimal hedge ratios are lower during the CSM crash compared to the GFC. It implies that fewer oil assets are required to reduce risk for equity investors during the CSM crash compared to the GFC. Finally, policymakers and regulators should take “changes in oil prices and volatility” into account when developing policies to stabilize their financial markets. The results offer valuable insights for asset pricing, portfolio diversification, and risk management.
Footnotes
Acknowledgements
The authors gratefully acknowledge Dr. Arshad Hassan (Professor/Dean of Management and Social Sciences, Capital University of Science and Technology, Islamabad) for their valuable suggestions. I am also thankful to Dr. Rehman Mian (Assistant Professor at NUST Business School, National University of Science and Technology, Islamabad) for providing data.
Author Contribution
I.Y. contributed in the conceptualization, estimations, formal analysis, and original draft preparation; S.A. contributed in data collection and review of draft; M.N. contributed in review and editing of draft; I.A. contributed in review and editing of draft. All authors have read and agreed to the published version of the manuscript.
Declaration of Conflicting Interests
The author(s) declared no potential conflicts of interest with respect to the research, authorship, and/or publication of this article.
Funding
The author(s) received no financial support for the research, authorship, and/or publication of this article.
Availability of Data and Materials
The data sets will be provided on request.