
Abstract
The study examines the return and volatility spillover among Asian stock markets in India, Hong Kong, Japan, China, Jakarta, and Korea using a six-variable asymmetric generalized autoregressive conditional heteroscedasticity–Baba, Engle, Kraft, and Kroner (GARCH-BEKK) model during February 2, 2007, to February 29, 2010. The author finds evidence of bidirectional return, shock, and volatility spillover among most of the stock markets. The magnitude of volatility linkages is low indicating weak integration of Asian stock markets. The study finds that own volatility spillover is higher than cross-market spillover. The overall persistence of stock market volatility is highest for Japan (0.931) and lowest for China (0.824). The implication of weak integration is that investors will benefit from reduction of diversifiable risk.
Keywords
JEL Classification:
C32, G15
Introduction
The growing international integration of financial markets has prompted several empirical studies to examine the mechanism through which stock market movements are transmitted around the world. These studies evaluate how stock returns in one national stock market influence the returns of other stock markets. These studies further examine their implications for pricing securities, hedging, other trading strategies, and framing regulatory policies. These issues have been of heightened interests to all the participants in the stock markets in the wake of October 1987 international crash of stock markets that saw large correlated price movements across most of the stock markets of the world. It has lead to introduction of various regulations and institutional rules to dampen the cross-market impact of large stock movements.
The extent of the global linkage of emerging markets improves access to the international capital markets. Strong global linkage reduces the insulation of the emerging stock markets from external shocks, hence limiting the scope for independent monetary policy (Li & Majerowska, 2007). From the perspective of the global investors, weak stock market linkage in the form of less than perfect correlation between their returns offers potential gains from international portfolio diversification, whereas strong market linkage or comovement in returns eliminates the potential benefits of diversification.
Although there is no dearth of literature on financial integration, there are only a few studies related to emerging stock markets of Asia. Moreover, the limited literature on the emerging stock markets in Asia has studied the comovements between the stock markets using cointegration and vector autoregression framework (Ahmad, Ashraf, & Ahmed, 2005; Bhattacharya & Samanta, 2001; Chelley-Steeley, 2005; Chung & Ng, 1992; Eun & Shim, 1989; Hoque, 2007; Voronkova, 2004; Wong, Agrawal, & Du, 2005; Yang, Hsiao, Li, & Wang, 2006). The studies do not take into account the interactions in terms of volatility among the markets.
It is believed that if markets are integrated, an unanticipated event in one market will influence not only returns but also variance in the other markets. The analysis of volatility is particularly important because it can proxy for the risk of assets. Scheicher (2001) studied the regional and global integration of stock markets in terms of return and volatility shocks in Hungary, Poland, and Czech Republic and Financial Times/Standard & Poor (S&P)’s world actuaries index by using multivariate generalized autoregressive conditional heteroscedasticity (MGARCH) with a constant conditional correlation. Using daily closing price values of the stock markets from January 1, 1995, to October 7, 1997, results revealed that the emerging stock exchanges were integrated with the global market, proxied by Financial Times/S&P’s actuaries’ world index only in terms of return. MGARCH results showed that the regional influences were the major cause of volatility of the markets. International volatility had no impact on the markets.
Chou, Lin, and Wu (1999) examined the price and volatility linkages of Taiwan stock market with United States using close-to-open, open-to-close, and close-to-close returns of indices of Taiwan known as Taikex and United States’ Standard and Poor’s 500 (S&P 500) composite index during January 1, 1991, to December 31, 1994. The results found that the volatility and return spilt over from United States to Taiwan. The results of MGARCH indicated some important linkage from the U.S. stock market to the Taiwan stock market. The spillover effects occurred for both the mean and the variance of Taiwan stock returns. It further pointed out that the volatility in U.S. stock markets affected total daily volatilities of the Taiwan stock market.
Karolyi (1995) examined the short run dynamics of returns and volatilities for stocks traded on the New York Stock Exchange (NYSE) and Toronto Stock Exchange (TSE) of Canada by applying MGARCH and vector autoregression models in time series of daily stock market indices at the close of markets in terms of local currency for S&P 500 and TSE 300 during April 1, 1987, to December 29, 1989. Results of MGARCH indicated the return and volatility spillovers from S&P 500 to TSE 300. The effects of shocks of return and volatility from NYSE to TSE measured by MGARCH were smaller and less persistent.
Harris and Pisedtasalasai (2006) applied constant conditional correlation MGARCH framework to investigate return and volatility spillover effects between the Financial Times Stock Exchange (FTSE) 100, FTSE 200, and FTSE small cap equity indices of U.K. stock market using daily return during January 1, 1986, to December 2002 using Glosten, Jagannathan, and Runkle (1993) specifications of MGARCH model to capture asymmetric effect. The study found that return and volatility transmission mechanism between large and small stocks in the United Kingdom were asymmetric. There were significant positive spillover effects from portfolio of larger stocks to the portfolio of smaller stocks.
Worthington and Higgs (2004) examined the transmission of equity returns and volatility among three developed Asian markets (Hong Kong, Japan, and Singapore) and six emerging markets of Asia (Indonesia, Korea, Malaysia, the Philippines, Taiwan, and Thailand) using weekly returns from January 15, 1988, to October 6, 2000. They employed Baba, Engle, Kraft, and Kroner (BEKK) parameterization of MGARCH model to identify the source and magnitude of volatility spillover. The study found the presence of positive mean and volatility spillovers. The mean return spillovers from the developed markets to the emerging markets were not homogeneous across the emerging markets. Application of MGARCH suggested that own stock market volatility spillovers were generally higher than cross-volatility spillovers for all markets, especially for emerging stock markets. Li (2007) examined the linkages between the two emerging stock exchanges, namely, Shanghai and Shenzhen of China and the established stock markets—Heng Seng of Hong Kong and S&P of the United States—by a MGARCH-BEKK framework using the daily share price indices of the stock markets, January 4, 2000, to August 17, 2005. The results indicated that there was no evidence of spillover effect in terms of return and volatility between the stock exchanges in China and U.S. market. There was an evidence of unidirectional volatility spillover from stock exchange in Hong Kong to those in Shanghai and Shenzhen. The study found that Chinese stock exchanges were integrated with the regional developed stock exchange in Hong Kong but the extent of the linkages between the stock exchange in Hong Kong and China was weak. The results further showed that there was a bidirectional shock spillover between the two Chinese stock exchanges. The study also found that there was an asymmetric response of volatility in all four stock exchanges under study.
Although there is a voluminous literature on equity market integration internationally, little research has been undertaken to study the interdependence structure of the Asian stock markets. In the light of the review of the existing literature on the linkages between the various stock markets, the present study tries to analyze volatility spillover among developed and developing Asian stock markets using MGARCH-BEKK framework. The rest of the article is organized as follows. Data and preliminary analysis are presented in the section titled “Data and Preliminary Analysis.” The “Method” section provides research design used in the study. Empirical results are discussed in the section titled “Empirical Results.” The “Summary” section summarizes the study.
Data and Preliminary Analysis
The study uses data on daily closing price of Bombay Stock Exchange (BSE) of India, Hang Seng of HIS Hong Kong (HSID), Nikkei 225 (N225) of Japan, Shanghai Stock Exchange (SSE) of China, Jakarta Composite Index (JKSE) of Jakarta, and Korean Stock Exchange (KS11) of Korea from February 2, 2007, to February 20, 2010. The reason for selecting the indices is that they represent the developed and emerging economies of Asian stock markets. Global Finance database is used to analyze the volatility of the stock markets. It will be instructive to examine the return and volatility spillover among the stock markets. Daily returns are identified as the first difference in the natural logarithm of the closing index value for the two consecutive trading days for the six indices. The indices used in this study are widely accepted benchmark indices for six stock markets. The Indian Stock Market is represented by the most popular index, namely, BSE's Sensex. The first index launched by BSE was the BSE sensitivity Index (Sensex) in 1986. It comprises of 30 companies from various industries’ groups. The companies have been selected so as to represent all major sectors of the economy. They are selected on the basis of market capitalization, volume of turnover, and strength of the companies’ fundamentals. Since then, in the last 15 years, it has offered 21 indices, including 12 sectoral indices. For stock exchange of Hong Kong, we use Hang Seng index, which includes the 33 largest firms in Hong Kong and represents about 75% of the total equity capitalization for all the Stock Exchanges of Hong Kong. Nikkei 225 (N225) is a widely quoted index of Japanese equity. Stocks are chosen based on liquidity and industry representation. The Shanghai composite index captures the price movement of all the shares listed on the Shanghai Stock Exchange (SSE). It is the largest in mainland China and fifth largest stock exchange in the world with more than 900 stocks listed on it. It is included in the study because China is the fastest developing economy in Asia followed by India. It is insightful to study the interactions of the stock markets. The inclusion of Hong Kong and Japan is because of the fact that they are regarded as one of the mature financial centers in Asia and play important role in the regional economy. The Jakarta SE Index is a capitalization-weighted price index including all listed stocks on the Jakarta Stock Exchange. The index was introduced in 1982 when 13 shares were traded and backdated to December 31, 1977, when one share was traded on the exchange. The index is calculated as the sum of the regular closing price multiplied by number of shares and divided by base value. The latest base value of August 14, 1991, is 100 covers 132 issuers divided into 10 economic sectors. The 132 issuers cover all companies whose shares are traded on the Jakarta Stock Exchange (JSX). The KS11 is the representative stock market index of South Korea. It has more than 700 components. The base is January 4, 1980 = 100.
Figure 1 presents time plot of the price series of Asian stock markets. The first impression is that all the indices follow a similar movement. It can be noticed that all the indices declined after mid-2007. The decline can be attributable to the global financial crisis. Overall, all the stock price indices are trending upwards during the recent time.

Stock indices during year 2001 to year 2010
Figure 2 represents the returns of the share price indices, the first difference of the natural logarithm of the share price indices, during the period under study. All six indices are characterized by volatility clustering where large (small) volatility is followed by large (small) volatility. As the cluster tends to occur simultaneously, between the indices, volatility must be modeled systematically.

Returns of the share price indices
Table 1 reports the summary statistics for the return series.
Summary Statistics of Returns Series

Note: DLBSE, DLHSID, DLN225, DLSSE, DLJKSE, and DLKS11 represent daily returns of India, Hong Kong, Japan, China, Jakarta, and Korean Stock Indices.
The performance of the indices as measured by the average return is better in Jakarta stock market followed by Indian and Korean stock markets. The average return of stock markets of China and Japan are negative. The Hong Kong, Chinese, and Indian stock indices exhibit higher volatility than other stock markets under study. The Jarque-Bera statistics reject the null hypothesis that the returns are normally distributed for all cases. Stock indices of Jakarta, Korea, Japan, and China have negative skewness, indicating that large negative stock returns are more common than large positive returns. In contrast, Hong Kong and Indian stock indices are slightly positively skewed. Furthermore, all the returns series are leptokurtic, having significantly fatter tails and higher peaks which can be seen from the kurtosis statistics that are greater than three. Generalized Autoregressive Conditional Heteroscedasticity (GARCH) models are capable of dealing with data displaying the above features. When modeling with GARCH, the nonzero skewness statistics indicate an ARCH order higher than one in the conditional variance equation. Subsequently, a MGARCH (1, 1) model should be preferred to an ARCH (p) model to examine volatility spillover effects for the sake of parsimony (Li, 2007).
Method
On the basis of the features discussed in the previous section, GARCH model is appropriate for the study. The aim of the study is to examine the interdependence across the six stock markets. The following model is used to examine the joint process relating to the share price indices under study.

where Yt is a 6 × 1 vector of daily returns at time t and Γ is a 6 × 6 matrix for parameters associated with the lagged returns. The diagonal elements in matrix Γ, γ
ij
, measure the effect of own past returns, whereas the off-diagonal elements, γ
ij
, captures the relationship in terms of returns across the markets, also known as return spillover. The 6 × 1 vector of random error, ϵt, is the innovation for each market at time t and has a 6 × 6 conditional variance–covariance matrix,
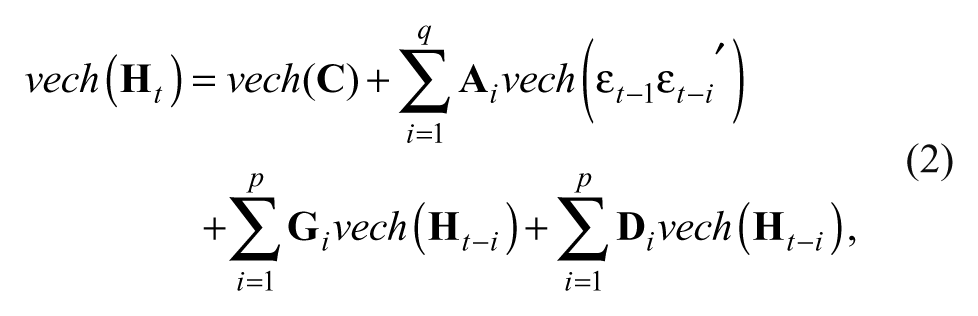
where vech is the operator that stacks the lower triangular portion of a symmetric matrix into a vector. The problems with this formulation are that the number of parameters to be estimated is large and restrictions on the parameters are needed to ensure that the conditional variance matrix is positive definite. Engle and Kroner (1995) propose the following new parameterization for
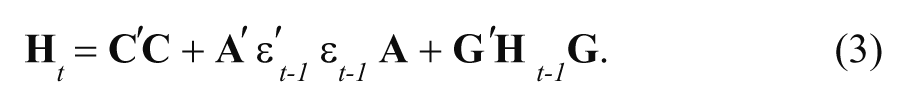
The BEKK model provides cross-market effects in the variance equation parsimoniously and also guarantees positive semidefiniteness by working with quadratic forms. Kroner and Ng (1998) propose to extend the BEKK model to allow for the asymmetric responses of volatility, that is, stock volatility tends to rise more in response to bad news than positive shocks, in variance–covariances.

where ξ t is defined as ϵ t if ϵ t is negative and zero otherwise. The last term on the right-hand side captures the asymmetric property of time varying variance–covariance. The notion used in the equation is as follows:
The BEKK systems can be estimated using maximum likelihood method. The log likelihood function of the joint distribution is the sum of all the log likelihood functions of the conditional distributions, that is, the sum of the logs of multivariate-normal distribution. Letting Lt be the log likelihood of observation t, n be the number of stock exchanges and L be the joint log likelihood which gives,

Empirical Results
In this section, we perform unit root test to check for nonstationarity of the stock markets series. We report the estimated results about market linkages. We will look for any statistically significant cross-market effects as evidence of linkages and measure the extent of the linkages by the estimated time-varying covariances using MGARCH asymmetric model. We organize the section as follows. In the “Unit Root Test Results” section, we discuss Augmented Dickey Fuller Test (ADF) results. In the section titled “The Evidence of Stock Market Linkages,” we report the evidence of market linkages in the estimated six-variable asymmetric GARCH-BEKK model.
Unit Root Test Results
Stationarity conditions of the stock market indices are tested by ADF. A unit root test is a statistical test for the proposition that in an autoregressive statistical model of a time series, the autoregressive parameter is one. It is a test for detecting the presence of stationarity in the series. The early and pioneering work on testing for a unit root in time series was done by Dickey and Fuller (1979, 1981). If the variables in the regression model are not stationary, then it can be shown that the standard assumptions for asymptotic analysis will not be valid. In other words, the usual “t ratios” will not follow a t distribution; hence they are inappropriate to undertake hypothesis tests about the regression parameters.
Stationarity time series is one whose mean, variance, and covariance are unchanged by time shift. Nonstationary time series have time varying mean or variance or both. If a time series is nonstationary, we can study its behavior only for a time period under consideration. It is not possible to generalize it to other time periods. It is, therefore, not useful for forecasting purpose.
The presence of unit root in a time series is tested with the help of ADF. It tests for a unit root in the univariate representation of time series. For a return series Rt, the ADF test consists of a regression of the first difference of the series against the series lagged k times as follows:

The null hypothesis is HO: δ = 0 and H1: δ < 1. The acceptance of null hypothesis implies nonstationarity.
We can transform the nonstationary time series to stationary time series either by differencing or by detrending. The transformation depends on whether the series are difference stationary or trend stationary. We report the results of unit root test in Table 2.
Unit Root Test Results

Note: BSE = Bombay Stock Exchange; N225 = Nikkei 225; SSE = Shanghai Stock Exchange; JKSE = Jakarta Composite Index; KS11 = Korean Stock Exchange. Mackinnon’s test critical values at 1%, 5%, and 10% are −3.439, −2.865, and −2.568, respectively.
Figures in the parenthesis indicate probability values.
ADF statistics reported in the Table 2 show that the null hypothesis of a unit root in case of all six indices is rejected. The absolute computed values for all the indices are higher than the MacKinnon critical value at 1% level. Thus, the results show that the return series are stationary. As the results suggest that the underlying return series are stationary, our next step is to examine the stock markets’ linkages.
The Evidence of Stock Market Linkages
The mean Equation 1 and time-varying variance–covariance Equation 4 are estimated simultaneously by the maximum likelihood method. Note that the stock exchanges BSE, Hang Seng, N225, SSE, JKSE, and KS11 are indexed 1, 2, 3, 4, 5, and 6, respectively. We first look at the matrix Γ in the mean equation, Equation 1 captured by the parameters γ ij , in Table 3, to see the relationship in terms of returns across the six indices. As the diagonal parameters γ(1,1), γ(2,2), γ(3,3), γ(4,4), and γ(6,6) are statistically insignificant, the returns of BSE, Hang Seng, Japan(N225), Shanghai (SSE), and Korea(KS11) do not depend on their first lag whereas the other Jakarta (JKSE) diagonal parameters is statistically significant suggesting that the returns of S&P500, BSE, and NSE depend on their first lags. The cross-market return linkages are represented by off-diagonal parameters and they are evident in the following pattern. Firstly, the off-diagonal parameters γ(4,5) and γ(5,4), γ(5,6) and γ(6,5) are statistically significant at 5% level indicating that there are bidirectional return spillover from SSE to JKSE and from JKSE to KS11, respectively. The parameters γ(2,1), γ(2,5), γ(3,2), γ(5,3), γ(6,1), γ(6,2), and γ(6,4) are found to be statistically significant at 5% level whereas their counterparts are not significant, implying that there is a unidirectional return linkage from Hang Seng to BSE, Hang Seng to JKSE, N225 to Hang Seng, JKSE to N225, and KS11 to BSE, Hang Seng, and JKSE. There are linkages from BSE to SSE and JKSE at 10% significant level.
Estimated Coefficients From Mean Equation 1
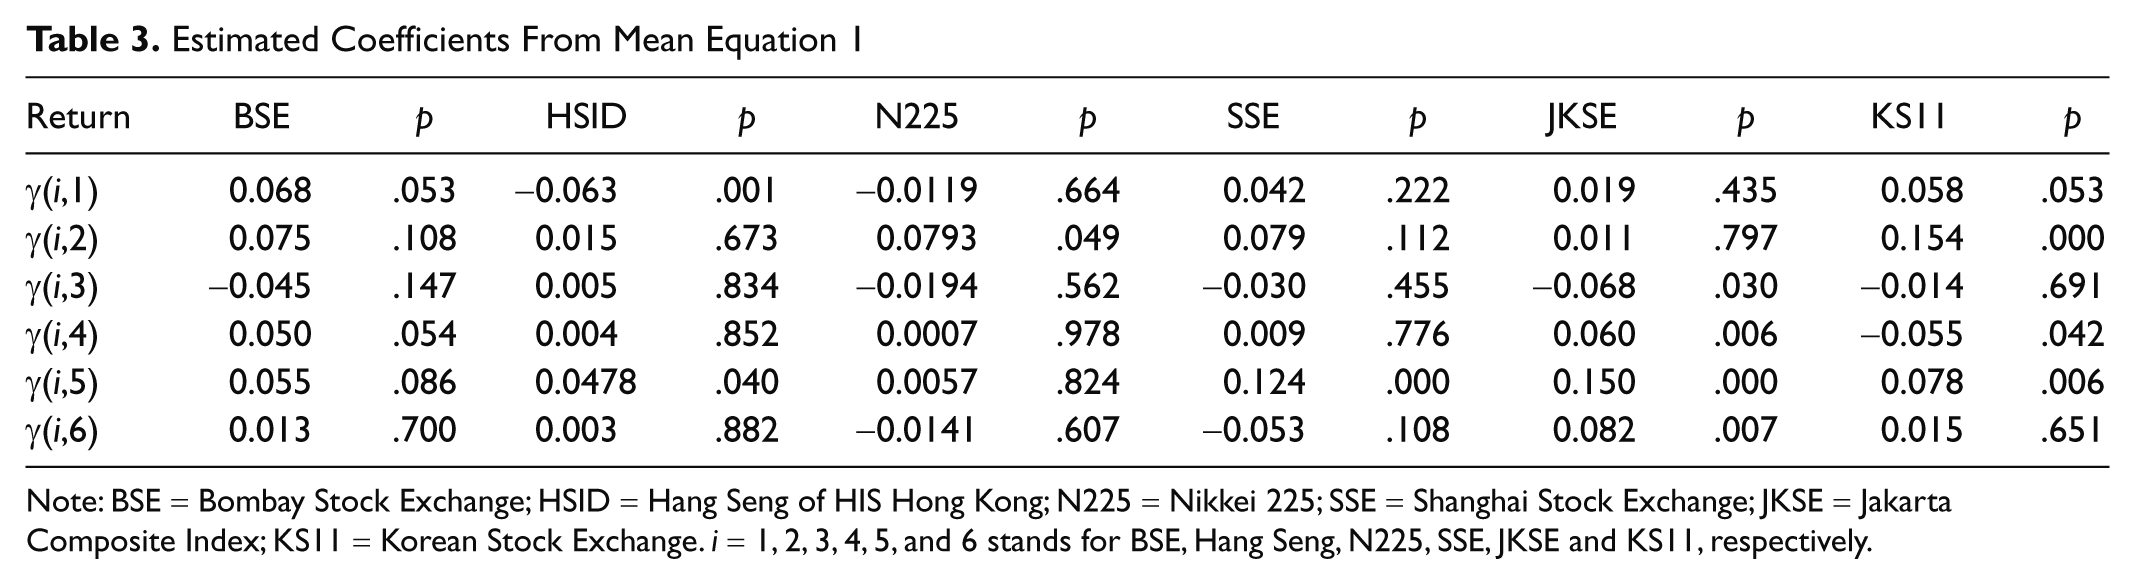
Note: BSE = Bombay Stock Exchange; HSID = Hang Seng of HIS Hong Kong; N225 = Nikkei 225; SSE = Shanghai Stock Exchange; JKSE = Jakarta Composite Index; KS11 = Korean Stock Exchange. i = 1, 2, 3, 4, 5, and 6 stands for BSE, Hang Seng, N225, SSE, JKSE and KS11, respectively.
Now, we examine the estimated results of the time-varying variance–covariance Equation 3 in the system. The results of six-variable asymmetric GARCH model are reported in Table 4.
Estimated Coefficients for Four Variable Asymmetric MGARCH

Note: LB-Qs = Ljung Box Q statistics. Figures in the parenthesis indicate probability values. Coefficients a, g, and d captures ARCH, GARCH, and asymmetric GARCH effects in the markets.
Now we examine the estimated results. It can be noted that the Ljung Box Q statistics for the 12th order and multivariate Q statistics for 12th orders in standardized and squared standardized residuals show that there is no series dependence in the residuals indicating the appropriateness of the fitted variance–covariance equations by the six variable asymmetric BEKK model. The matrices
The off-diagonal elements of matrix
Second, there are bidirectional volatility linkages between BSE and other stock markets, namely, Hang Seng, N225, JKSE, and KS11, between Hang Seng with N225, JKSE, and KS11. The bidirectional volatility linkages can also be found between N225 with SSE, JKSE, and KS11, between SSE with JKSE and KS11, and between JKSE and KS11 as respective coefficients in g are statistically significant. It indicates that the conditional variance of one index depends on past volatility of the other index, implying strong connection between them. Own-volatility spillovers in all markets are large and significant. The overall persistence of stock market volatility is highest for Japan (0.931) and lowest for China (0.824). In terms of cross-volatility persistence in the stock markets, the past volatility shocks in Japan, Jakarta, and Korea stock indices have some effects on the future volatility in all the stock markets.
In the meanwhile, the statistically significant g24 and g41and insignificant g42 and g14 indicate unidirectional volatility spillover from Hang Seng to SSE and from SSE to BSE.
As far as matrix
The significant values of a21, a24 to a26, g21 to g26, a31, a32, a33, a35, g31 to g36, a62 to a65, and g61 to g65 suggest that the most of the shock and volatility spill over from developed stock markets to emerging stock markets.
Summary
The study investigates volatility spillover effect between the stock markets in India, Hong Kong, Japan, China, Jakarta, and Korea. Summary statistics of returns series of all the stock exchanges suggest that they are leptokurtic, having significantly fatter tails and higher peaks. GARCH models are capable of dealing with the property of the data.
By applying a multivariate asymmetric GARCH approach to the daily stock indices, the study found evidence of linkages in terms of return and volatility. There are bidirectional return spillover from SSE to JKSE and from JKSE to KS11, respectively. There is a unidirectional return linkage from Hang Seng to BSE, Hang Seng to JKSE, N225 to Hang Seng, JKSE to N225, and KS11 to BSE, Hang Seng, and JKSE. There are linkages of return from BSE to SSE and JKSE at 10% significant level. We find evidence of bidirectional shock transmissions between BSE and N225 at 10% significance level, SSE and BSE; between BSE and N225; between Hang Seng and SSE, Hang Seng and KS11; and between JKSE and KS11. In terms of cross-shock spillover effects in the markets, past innovations in Hang Seng have the greatest effect (0.343) on future volatility in China. Our results reveal unidirectional shock spillover from Hang Seng to BSE and JKSE, from N225 to Hang Seng and JKSE, from JKSE to SSE, and from KS11 to N225 and SSE.
There are bidirectional volatility linkages between BSE and other stock markets, namely, Hang Seng, N225, JKSE, and KS11, and between Hang Seng with N225, JKSE, and KS11. The bidirectional volatility linkages can also be found between N225 with SSE, JKSE, and KS11; between SSE with JKSE and KS11; and between JKSE and KS11. There is also unidirectional volatility spillover from Hang Seng to SSE and from SSE to BSE. The overall persistence of stock market volatility is highest for Japan (0.931) and lowest for China (0.824).
We find evidence of asymmetric responses to negative shocks of own markets for all the stock markets except Hang Seng and SSE. The sign of the own past shocks affects the conditional variance of these indices. We do find the bidirectional cross-market asymmetric responses between Hang Seng and JKSE, N225 with SSE and KS11, between SSE and JKSE, and between JKSE and KS11. We also find the evidence of unidirectional cross-market asymmetric responses spillover from India to Korea, Hong Kong to India, Japan to India, and China to Korea.
Footnotes
The author(s) declared no potential conflicts of interest with respect to the research, authorship, and/or publication of this article.
The author(s) received no financial support for the research and/or authorship of this article.