
Abstract
This study examines the impact of environmental costs on corporate performance from the dual perspectives of economic and environmental outcomes, using a sample of 569 listed companies in China’s heavily polluting industries from 2013 to 2022. It also explores the moderating role of green credit in this relationship. The research results indicate that: (1) There is a significant U-shaped relationship between environmental costs and corporate economic performance. Meanwhile, a robust positive linear association exists between environmental costs and corporate environmental performance. (2) Further analysis reveals that ex-ante preventive environmental costs contribute more significantly to economic performance, whereas end-of-pipe treatment costs are more conducive to improving environmental performance. (3) Green credit exerts a nonlinear moderating effect between environmental costs and economic performance, but shows a positive moderating role in the context of environmental performance. (4) Mediation tests confirm that green technology innovation serves as a key pathway through which environmental costs affect corporate performance. (5) Heterogeneity analysis indicates that the moderating effect of green credit is more pronounced in regions with stringent environmental regulations and in state-owned enterprises. These findings provide empirical support for optimizing corporate environmental investment structures and implementing differentiated green finance policies.
Plain Language Summary
Imagine a company spending money to protect the environment—does it help or hurt its business? Our study of 569 major Chinese manufacturers over ten years reveals a nuanced answer. We found that while initial environmental investments can be a financial challenge, they can eventually lead to better economic performance. More consistently, these investments always lead to a cleaner environmental record. The key is strategy: spending on preventing pollution upfront boosts profits more in the long run, while spending on cleaning up pollution is very effective for immediate environmental gains. Importantly, we show that green credit policies can encourage companies to make these beneficial investments. However, this effect is stronger for companies facing strict environmental laws and state-owned enterprises. Ultimately, our findings provide a clear message: strategic environmental spending isn’t just a cost—it’s an investment that can pay off for both businesses and the planet. This insight can guide companies in planning their environmental budgets and help governments design smarter policies to support sustainable growth.
Keywords
Introduction
Driven by the “dual carbon” goal, the Chinese government strengthens corporate environmental responsibility through a dual path of environmental regulation and market-oriented measures. On the one hand, the government issues mandatory policies such as pollutant discharge permits and standards to constrain enterprise activities; On the other hand, continuously improving the green finance and taxation system, and incentivizing enterprises to save energy through tools such as carbon taxes and subsidies. Enterprises in heavily polluting industries, characterized by high environmental risks and substantial resource consumption, are not only key targets of environmental regulations but also a primary focus of green finance policies. These firms generally face stricter emission standards, higher compliance costs, and stronger public scrutiny. As a result, their environmental decision-making tends to exhibit greater complexity and is often considered more representative of sector-wide behavior (Su & Lian, 2018). As the main consumer of resources, enterprises exhibit significant dynamic game characteristics in their environmental decision-making behavior influenced by government investment in pollution control. Existing research shows that strengthening environmental governance by government departments may play a positive role in driving enterprises to improve their social responsibility performance and actively adopt environmental management strategies. Meanwhile, alongside the upgrading of China’s environmental monitoring systems and improvements in enforcement efficacy, institutional constraints on micro-entities have significantly intensified. Particularly for heavily polluting enterprises, driven by the trade-off between the risks of non-compliance and the benefits of conformity, there is a growing tendency to prioritize environmental strategies and proactively undertake environmental expenditures (Cui et al., 2019). However, government support or investment may also have a “crowding out effect,” where government led pollution control investments fail to effectively stimulate the willingness of enterprises to invest in the environment. Specifically, when the quality of regional ecological environment reaches a high standard due to public investment, enterprises may consider environmental costs as not essential expenditures based on economic rationality assumptions (Ma et al., 2016), which objectively weakens the motivation for internalizing environmental costs in enterprises through government governance behavior. From the perspective of classical agency theory, environmental investment is a managerial action that may reduce short-term financial performance. In the absence of effective supervision and incentives, management may avoid such expenditures to maximize their own self-interest (Peng et al., 2018). Research has shown that only when environmental investments are transformed into long-term competitive advantages (such as green technology innovation premiums), can companies have endogenous motivation for sustained emissions reduction (Khan et al., 2022). Therefore, exploring how environmental costs dynamically affect corporate performance is of great research significance for solving the “paradox of environmental investment” in green development.
The key to solving the dilemma of “crowding out effect” lies in building a synergistic mechanism between policy constraints and market incentives, and green credit serves as the key policy instrument for attaining this objective (Su et al., 2022). The green credit policy is particularly suitable for heavily polluting industries. By imposing differentiated financing conditions, it directly constrains high-pollution firms while incentivizing green transformation, thereby exerting a particularly significant influence on the environmental behavior of such enterprises (Li & Lu, 2015). Green credit, as a market-oriented innovation instrument for environmental governance, reconstructs the allocation pattern of government and enterprise environmental responsibilities through dual regulatory functions. From a macro perspective, the core of green credit is to guide the green transformation of industrial framework through price signals of financial resource allocation. Since 2007, commercial banks have established an environmental protection credit assessment system with a “veto power” mechanism. Here, corporate environmental credit ratings are directly tied to financing costs, forcing companies to factor in environmental expenditures when making investment decisions. This is also the beginning of China’s use of economic means to promote environmental protection actions (Zhang et al., 2021); On a micro-level, green credit reconstructs the logic of corporate environmental decision-making through three paths: firstly, the financing constraint adjustment function reduces the cost of obtaining funds for environmentally compliant enterprises through differentiated interest rate pricing, shortening the return cycle of environmental investment returns (Lu et al., 2021); Secondly, the market signal transmission function can enhance the environmental reputation of enterprises through the green certification system, which can be transformed into product market competition premiums, especially in the context of strengthening international green trade barriers to form export competitive advantages (Zhang, 2021); Thirdly, optimizing the internal resource allocation and business decision-making within the enterprise is expected to bring additional benefits and to some extent compensate for the environmental costs borne by the enterprise. Notably, by linking environmental performance to financing costs, green credit effectively serves as an external governance mechanism that addresses agency problems in corporate environmental management (Song et al., 2025). It helps mitigate managerial short-termism in environmental investment, thereby encouraging a greater focus on the firm’s long-term environmental value and sustainable development.
Therefore, this study focuses on heavily polluting firms to examine the interactive mechanisms among environmental costs, green credit, and corporate performance. The selection of these firms is primarily based on the following considerations. On one hand, the internalization of environmental externalities is more typical in heavily polluting enterprises, where the conflict between environmental costs and performance is more pronounced. On the other hand, such firms are generally more responsive to green credit policies, which facilitates the identification of heterogeneous policy effects (Tian et al., 2024). This study aims to address the following three questions: (1) Will the generation of environmental costs synchronously affect the economic and environmental performance of companies? (2) In situations where the cost of violating regulations is relatively low, which category of expense influences corporate performance more profoundly compared to the upfront prevention cost of voluntarily assuming environmental responsibility investment and the end of pipe remediation cost caused by being forced to bear environmental penalties? (3) How will the performance of a company be affected by the interaction between environmental costs as internal expenditures and green credit as capital obtained through external financing?
This article’s marginal contributions are primarily in two aspects: (1) From a research standpoint, this article breaks through the traditional single dimension and refines environmental costs into two categories: front-end prevention and end of pipe treatment, showing the varied effect of distinct stages of investment. At the same time, innovatively deconstructing corporate performance into two distinct aspects of economic and environmental performance overcomes the limitations of previous research that focused on economic indicators, provides a new perspective for balancing economic benefits and environmental responsibility, and deepens the theoretical basis for sustainable development. (2) In terms of research content, for the first time, green credit has been included in the analysis system of environmental costs and corporate performance, revealing its nonlinear regulatory, and compensatory effects. By verifying the dynamic adjustment mechanism of green credit between environmental costs and performance, the research boundary of green finance has been expanded, filling the gap of previous studies focusing on investment and financing constraints while neglecting policy synergy effects, and providing theoretical basis for policy combination design. Finally, the policy recommendations proposed in this article can offer decision-making guidance for different enterprises to pursue economic benefits while implementing environmental responsibilities and formulating development strategies. Figure 1 is the framework diagram of the entire text.

Framework diagram.
Literature Review
Classification of Environmental Costs and Economic Impact
Classification of Environmental Costs
The existing literature categorizes environmental costs into three primary groups. The first category is to classify environmental costs according to their spatial scope. As far back as 1998, Wang introduced a framework for categorizing environmental costs based on their spatial impact, distinguishing between internal and external costs. He contended that internal environmental costs are directly incurred by businesses and can be quantified financially (Wang, 1998). On the other hand, external environmental costs stem from a company’s operations but are not easily measurable or directly shouldered by the enterprise itself. Subsequently, Wang further investigated both internal and external environmental costs, recognizing internal environmental costs based on statement characteristics and calculating external environmental costs based on the shadow price method. The results showed that both total environmental expenses and particular internal and external environmental costs positively impact a company’s performance. Notably, the influence of internal environmental costs on performance is more pronounced than that of external environmental costs. This may be because internal environmental costs directly affect the firm’s cash flow. In contrast, external environmental costs remain uninternalized, primarily impacting the broader environment and minimally affecting the firm.
The second category classifies environmental costs according to their nature into capitalized and expensed costs. If environmental costs are expensed, the enterprise will charge this part to administrative expenses, non-operating expenses, and other accounts, affecting the current period’s profit and loss. If the environmental cost is capitalized, it indicates that the enterprise pays the cost for long-term environmental protection, which will be accounted for in the form of enterprise assets in subjects such as construction in progress, fixed assets, and intangible assets, and can subsequently affect the profit of the enterprise through amortization. However, the criteria for determining the capitalization of environmental costs are still controversial at the international level, with the International Accounting Standards Board (IASB) arguing that only expenditures caused by environmental factors dependent on an asset capable of generating future economic benefits can be capitalized. Conversely, the Financial Accounting Standards Board (FASB) in the United States maintains that environmental costs ought to be treated as capital assets, regardless of whether they enhance economic benefits, provided they meet the criteria of being significant for the organization’s long-term sustainability.
The third category categorizes environmental costs according to the time dimension into ex-ante and ex-post. From the perspective of the modern view of strategic control of environmental costs, the focus of environmental cost control should be on the control link before environmental pollution rather than the treatment link after environmental pollution occurs. Which approach has a greater effect on firm performance: ex-ante control or end-of-pipe treatment? This study examines how environmental expenses associated with proactive prevention and end-of-pipe measures influence the performance of firms.
Economic Impact of Environmental Costs
Current research identifies three primary viewpoints regarding the link between environmental expenses and business performance. The first perspective, rooted in the “facilitation view” proposed by Porter’s hypothesis, thinks that incurring environmental costs can actually enhance a company’s overall performance (Porter & Vanderlinde, 1995). Porter’s hypothesis suggests that these innovations will increase firm productivity, generating benefits that can offset environmental protection costs, in line with the cost-benefit principle (Wang, Chen, Wang, & Li, 2025). At the same time, the increase in environmental costs reflects the proactive attitude of enterprises toward fulfilling their social responsibilities, which can bring an excellent reputation to the company and thus improve its performance (Guo & Shi, 2022).
The second view is the “disincentive,” based on the traditional hypothesis that environmental costs can inhibit firm performance. The conventional hypothesis suggests that environmental regulations trigger corporate resource reallocation, diverting substantial capital toward environmental compliance costs. This financial shift leaves insufficient funding for green innovation initiatives, consequently constraining innovation capacity development and ultimately undermining productivity gains and competitive advantages. The conventional hypothesis posits that environmental regulations affect corporate resource distribution, indicating that substantial investments may be directed toward environmental costs, this will lead to insufficient investment in green innovation, inhibit innovation capacity development, and negatively impact productivity and competitiveness. In addition, considering the current constraints of limited corporate resources, with the continuous increase of environmental inputs, it will exert an influence on the production of the enterprise. At this juncture, the benefits reaped from fulfilling environmental responsibilities can’t offset the consequent losses. Therefore, they will hurt corporate performance (Cui & Jiang, 2019), resulting in the value of the enterprise with a low environmental cost being significantly higher than that of the enterprise with a high environmental cost (Jo et al., 2016).
The final perspective is known as the “dynamic view” grounded in the uncertainty hypothesis. This concept posits that the link between variables is not static but rather influenced by several variables. These include the specific characteristics of the industry, prevailing environmental regulations, and the timing of the analysis. Moreover, it suggests an “inverted U-shape” dynamic effect, indicating that the relationship changes as conditions evolve (Luo & Fu, 2019). When enterprises begin to fulfill their environmental responsibilities proactively, it will positively impact their economic performance. However, with the increasing investment in the fulfillment of environmental responsibility, under the conditions of limited corporate resources, in order to satisfy stakeholders’ environmental needs, it will inevitably cause depletion of the production and financial resources of the enterprise and the benefits generated by the fulfillment of environmental responsibility will not be able to make up for the consumed costs, thus reducing the efficiency of the enterprise (He et al., 2020; Wang, Chen, Shang, & Li, 2025). Although the majority of prior research in the field tends to highlight the conflicting aspects between Porter’s hypothesis and the conventional viewpoint, this study shifts its focus to examining and substantiating the evolving interplay between environmental expenditures and a company’s overall performance.
Factors Influencing Corporate Performance
Factors Influencing the Economic Performance of Enterprises
The established literature typically uses ROA, ROE, Tobin’s Q, and total factor productivity as measures of firms’ economic performance (Chen & Xie, 2022; Lee & Raschke, 2023), with growth in economic performance being reflected in increased profits, which in turn translates into firm market valuations. To achieve a robust market valuation, companies must leverage transparency to convey favorable signals to investors, with ESG disclosures playing a pivotal role in bridging the information gap between firms and stakeholders. By sharing ESG-related data, businesses enhance their transparency, diminish investment uncertainties, and align with investors’ risk-averse tendencies, ultimately drawing in a broader base of potential backers. Meanwhile, green finance can stimulate research and development innovation through capital aggregation and information transmission (Li, Wang, Li, et al., 2025; Yu et al., 2023). After receiving financial support from green finance, enterprises can allocate more resources to invest in the field of green research and development, which improves their labor productivity, total added value, and employment growth rate (Li, 2022). However, when there are many ongoing controversies in the company, such as layoffs and corporate crimes, the company’s image and reputation are damaged, leading to a decrease in the trust of upstream and downstream collaborators. Its financial results decline as a result of stakeholders’ responses (Nirino et al., 2021). This phenomenon becomes evident when customers stop purchasing goods, suppliers halt their deliveries, and shareholders offload their stakes, all driven by a breakdown in trust. Such actions inevitably take a toll on the company’s financial health.
Research on Elements Affecting Corporate Environmental Performance
Enterprise environmental performance is the strategic activity result of enterprise management’s impact on the natural environment, which is influenced by multiple factors. It is noteworthy that the perception of environmental performance has shifted from ex-post measurement to ex-ante prediction, with advanced data modeling techniques becoming pivotal tools for understanding and enhancing it. For instance, recent research demonstrates that a model integrating explainable machine learning with survival analysis can accurately predict hypoxia risks in semi-arid rivers, providing a cutting-edge methodological framework for identifying and managing complex environmental risks from a data-driven perspective (Partani et al., 2024). This trend signifies that environmental management has entered a new phase characterized by intelligence and precision. From a macro perspective, state-owned enterprises maintain strong political ties with central or local governments (Li, Shi, Liu, et al., 2025), and government involvement can influence regional carbon reduction outcomes. Actively responding to environmental policies by state-owned enterprises will also help alleviate social environmental pressure (Maung et al., 2016). At the micro level, technological advances by firms affect environmental performance by reducing emissions from production activities. Industrial digitization enhances environmental performance through cleaner production technologies and avoids pipeline-end pollutant treatment (Wen et al., 2021). Firms investing in digital technologies can improve resource use efficiency, enable mass production to gain scale effects, and indirectly achieve energy savings and reduce environmental burdens (Wang, Ye, & Li, 2025). In addition to technological instruments, firms’ financial instruments can affect environmental performance. An increase in FDI promotes an increase in the shadow price of CO2, leading to better environmental conditions (Li, Yang, & Wang, 2025; Zhu et al., 2022). By implementing green credit policies, environmental quality can be enhanced both directly and indirectly. These policies use tiered interest rates to restrict funding to high-pollution industries, effectively curbing their financial lifelines. As a result, strengthening green credit initiatives plays a pivotal role in mitigating pollution levels. Figure 2 is a literature review chart.

Literature review chart.
Theoretical Basis and Research Hypotheses
The Impact of Environmental Costs on Corporate Performance
In China’s institutional context of government-led environmental governance, various expenditures and taxes undertaken by enterprises to fulfill their environmental responsibilities—collectively termed environmental costs—represent their most direct economic response to environmental regulations. According to the Porter Hypothesis, well-designed environmental regulations can stimulate innovation offsets that partially or fully compensate for compliance costs, thereby ultimately enhancing corporate competitiveness. This theory finds strong support in the Chinese context. For instance, Wu and Wang’s (2022) study on the carbon emission trading pilot policy demonstrated that carbon price signals significantly improved firms’ total factor productivity by promoting technological innovation and management efficiency, providing direct micro-level evidence for the innovation offset effect of environmental regulations. Environmental regulations influence micro-economic agents’ decision-making behaviors to achieve governance effects, which in turn affect economic outcomes. Taking carbon emission trading and carbon tax policies as examples, while complying with policy requirements, firms also signal their active commitment to environmental responsibilities to the market, helping them gain legitimacy and build differentiated competitive advantages.
However, agency theory suggests that environmental resource investments may conflict with management’s short-term interest objectives (Sastroredjo et al., 2025; Wang, Chen, Jin, et al., 2025). When firms redirect resources originally allocated to projects with positive net present values toward environmental governance, opportunity costs arise, which also form an important component of environmental costs. Consequently, the impact of environmental costs on corporate economic performance exhibits complex dynamic characteristics: in the short term, resource reallocation may inhibit economic growth, but from a long-term dynamic capabilities perspective, strategic investments in green production technologies help cultivate green core competencies. These not only reduce future environmental expenses but may also generate market premiums through innovation offsets, thereby positively influencing corporate performance. In summary, the relationship between environmental costs and economic performance is not simply linear. Based on the cost-benefit principle and objective quantitative analysis, this study proposes the following hypothesis:
Environmental costs represent a strategic investment made by enterprises to improve societal environmental quality. According to stakeholder theory, actively undertaking environmental responsibilities is a crucial way for firms to meet the expectations of key groups such as investors, communities, and regulators. This helps companies gain legitimacy and build sustainable competitive advantages. Recent research further indicates that strong environmental performance not only enhances corporate reputation but may also create tangible financial value through channels such as easing financing constraints and improving tax burden management (Ai et al., 2024; Sastroredjo et al., 2025). Particularly against the backdrop of the growing mainstream adoption of socially responsible investing (SRI), an increasing number of investors are willing to accept moderately lower financial returns from companies demonstrating positive environmental contributions (Baldi & Pandimiglio, 2022). This trend makes environmental performance a significant dimension for corporate differentiation and competition. Therefore, investing environmental costs to improve environmental performance is essentially a strategic action aligned with long-term rational economic logic. Based on the above theoretical and empirical evidence, this study proposes the following hypothesis:
Based on the resource-based view and stakeholder theory, a firm’s management strategy regarding environmental costs can be seen as a crucial pathway for building sustainable competitive advantage. To deeply analyze the performance differences of various environmental management strategies, this study draws on the lifecycle assessment concept to categorize environmental costs into ex-ante preventive investments and ex-post end-of-pipe treatment. Ex-ante preventive environmental costs primarily refer to investments made upfront for developing or adopting environmentally friendly technologies, equipment, and products. Such investments help improve resource utilization efficiency and optimize production processes, thereby reducing pollution emissions at the source (Agyabeng et al., 2023; Lv et al., 2024). In contrast, ex-post end-of-pipe treatment costs are passive compliance expenditures, often manifested as administrative costs like outsourcing pollutant treatment. These represent more of a cost burden in passive response to regulatory pressure and are difficult to translate into a unique competitive advantage.
According to the resource-based view, ex-ante preventive investments help firms accumulate unique, hard-to-imitate green organizational capabilities, and technological resources, thereby obtaining a “green efficiency dividend.” For example, they can directly reduce operational costs through energy savings and consumption reduction, or increase market share through green product differentiation, ultimately enhancing economic performance. Research by Bonsu et al. (2024) on manufacturing firms in emerging markets provides empirical support, finding that the dynamic resources and innovation capabilities built through green innovation are a key path for improving environmental performance and gaining competitive advantage, strongly corroborating the dynamic resource-based view. Simultaneously, stakeholder theory suggests that proactive environmental management effectively meets the environmental expectations of diverse entities such as the government, communities, and investors, shaping a responsible corporate citizen image. This helps win greater legitimacy support and policy preferences, creating a more favorable operating environment for the firm.
However, agency theory also points out that in the context of strengthening environmental regulations, if management has a short-term orientation, they might choose passive acceptance of penalties—when the cost of upfront investment is perceived to be higher than the expected penalty cost—rather than making long-term investments (Huang & Lei, 2021), highlighting the limitation of an end-of-pipe treatment mindset. Recent research in the Chinese context also indicates that the key to guiding effects of policy instruments like the environmental protection tax lies in incentivizing firms to engage in green innovation at the preventive stage, rather than simply increasing end-of-pipe treatment burdens (Liu & Xiao, 2022). In summary, compared to passive, consumptive end-of-pipe treatment, ex-ante preventive environmental costs are more likely to simultaneously enhance both economic and environmental performance through the dual pathways of efficiency gains and legitimacy acquisition. Accordingly, this study proposes the following hypotheses:
The Moderating Role of Green Credit
Given the dominant position of commercial banks in the financial system, green credit has become an important source of external financing for firms (Wang & Wang, 2021). As a policy tool possessing dual attributes of environmental regulation and financial resource allocation, green credit exerts significant environmental constraint pressure on firms by guiding bank funds towards green projects and restricting credit allocation to polluting projects. According to signaling theory, a firm’s acquisition of green credit sends a positive signal to the market about its sound environmental management capabilities and sustainable development potential. This helps alleviate information asymmetry, enhance investor confidence and market expectations, and consequently improve financing conditions (Pan et al., 2019). However, in responding to environmental regulations, heavily polluting firms often need to divert limited resources to environmental activities, which may crowd out normal production and operation investments. This can lead to the delay or abandonment of projects with positive net present values, causing underinvestment issues. In this context, the injection of green credit can, to some extent, compensate for the resource gap caused by the firm’s assumption of environmental responsibilities, alleviate the financial pressure from resource reallocation, and provide crucial funding support for the green transition.
Furthermore, based on resource dependence theory, a firm’s reliance on bank credit incentivizes it to proactively adjust its operations to meet the environmental requirements of fund providers. Since environmental performance is a key criterion for banks approving green credit, heavily polluting firms are motivated to strengthen environmental management and optimize their environmental performance to maintain existing credit lines and secure new loans. Therefore, green credit not only acts as an exogenous incentive tool strengthening environmental constraints but also, through the resource dependence mechanism, guides firms to internalize environmental costs, shifting their environmental behavior from passive compliance to active strategic planning (Huang et al., 2023). In summary, green credit improves the corporate financing environment through the signaling mechanism and guides firms to enhance environmental management through the resource dependence mechanism, suggesting it may play a significant moderating role in the relationship between environmental costs and corporate performance. Accordingly, this study proposes the following hypotheses; Figure 3 illustrates the relationships among the relevant entities:

The relationship between environmental protection entities.
Empirical Research Design
Benchmark Regression Models
To examine the link between environmental expenses and corporate outcomes, this study developed a two-way fixed effects model to evaluate hypotheses H1a, H1b, and H1c. This model was specifically designed to test the proposed relationships:


In order to test which one has a greater impact on the performance of the enterprise, the environmental cost of early-stage prevention investment or the environmental cost generated by end of pipe treatment, the following model was constructed:


Moderating Effects Model
In order to verify the moderating role of green credit in environmental costs and firm performance, the interaction term (EC * GC) is introduced into the benchmark model, which is expanded into the following model:


Variable Design
Dependent Variable
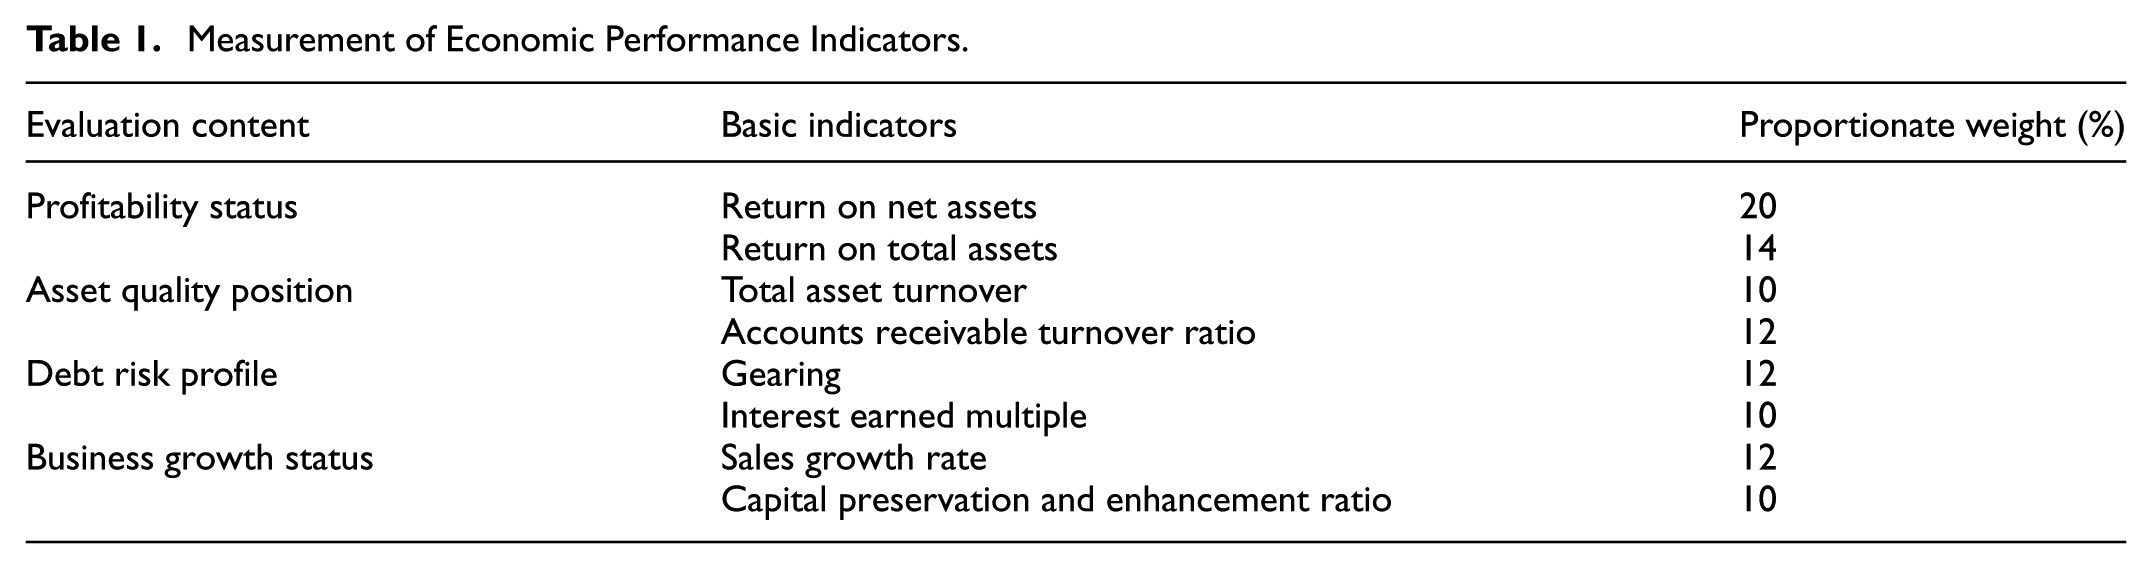
This article divides enterprise performance into two dimensions: economic performance and environmental performance. Firstly, economic performance is an essential criterion for evaluating the profitability, asset status, debt risk, and operation of enterprises, which can directly reflect the subsequent development ability of enterprises and the efficiency of economic and resource allocation and resource utilization. Indicators used in academia to measure economic performance include return on assets (ROA), return on equity (ROE), total factor productivity, etc. ROA serves as a metric to evaluate the net profit generated for each unit of assets. Additionally, it is a useful tool for gauging a company’s profitability in relation to the overall value of its assets. However, using only one indicator to make measurements appears to be rather one-dimensional and does not fully reflect the economic situation of the enterprise. This article weights the four evaluation components, namely, profitability, asset quality, debt risk, and operating growth, to calculate the profitability of an enterprise. The evaluation indicators of the comprehensive economic performance of the enterprises were weighted. The specific evaluation indicators and weights are shown in Table 1 below. Figure 4 shows the measurement index system of economic performance:
Measurement of Economic Performance Indicators.
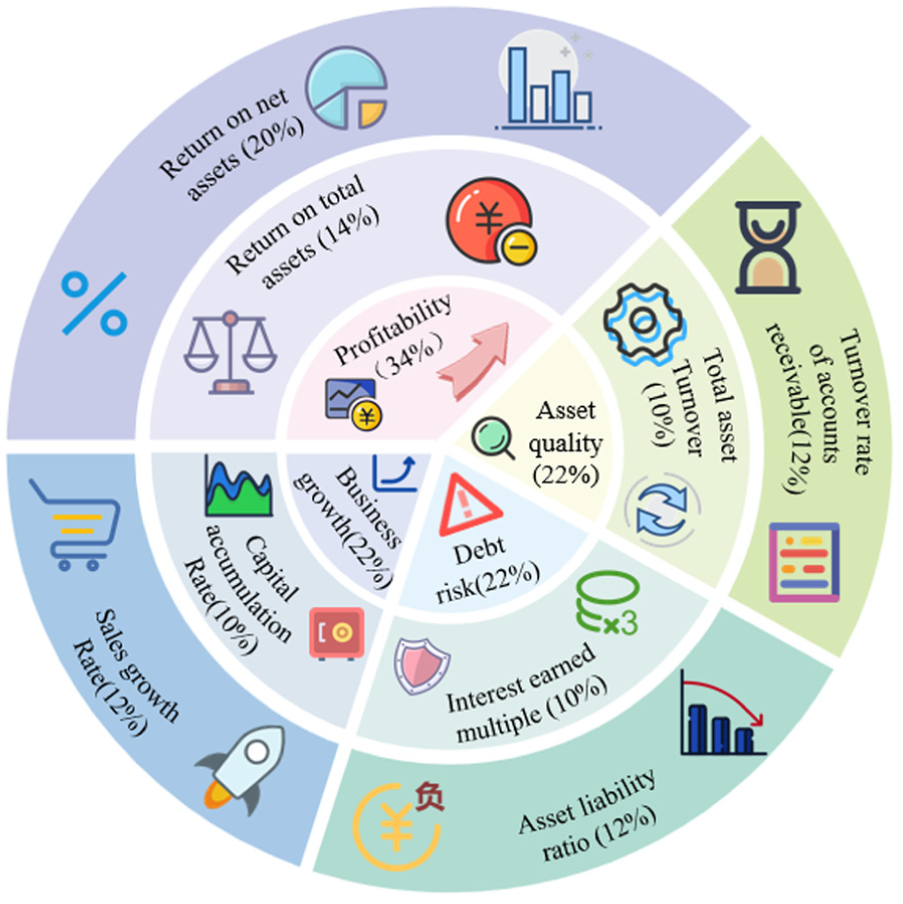
Measurement of FP.
Secondly, environmental performance pertains to how efficiently and effectively a company adheres to environmental regulations. By doing so, it can carve out a competitive edge in sustainable development, minimizing the negative impacts that business operations have on the natural environment (Chen & Ma, 2021). Environmental performance is demonstrated through a firm’s compliance with environmental regulations, and the rewards or penalties that a firm receives for its environmental performance are a direct manifestation of environmental performance; environmental offenses and performance are two opposite indicators; the better the environmental performance, the less likely it is that environmental offenses will be committed, and the fewer environmental offenses will be committed. Regarding the measurement of environmental performance, international studies commonly employ the Council on Economic Priorities (CEP) index or pollutant emission data. It is noteworthy that the global paradigm for measuring environmental performance is evolving toward more efficient and precise data-driven models. For instance, Partani et al. (2025) developed a reliable model for predicting Biochemical Oxygen Demand (BOD5) from Chemical Oxygen Demand (COD) levels, enabling a low-cost and rapid assessment of industrial wastewater biodegradability—a key environmental performance indicator. This provides a new approach to overcoming the limitations of traditional measurement methods. However, environmental performance evaluation started relatively late in China, and a comprehensive indicator system is lacking. There is also no unified metric for measuring environmental performance among domestic scholars, who primarily employ content analysis to assess it from both qualitative and quantitative dimensions. In this article, we will assign values from two dimensions, such as the emission of pollutants in enterprises and environmental regulation and certification, and finally form a comprehensive environmental performance score. In the baseline regression, an “equal-weight” aggregation method is adopted for each indicator, primarily based on the following considerations. First, pollutant emission status and environmental regulatory certification are two indispensable and equally important dimensions for measuring corporate environmental performance. Their respective sub-indicators represent key aspects of a firm’s environmental profile. When no theory suggests one indicator is definitively superior to others, the equal-weight method is a common baseline strategy in content analysis (Liu et al., 2024; Zheng et al., 2024), facilitating comparisons across studies. Second, the assignment rule for disclosure quality of emission data—using 0 (no description), 1 (qualitative description), and 2 (quantitative description)—is grounded in information economics. This approach recognizes that quantitative information possesses higher verifiability and information quality. This three-point scale has been widely validated in research on environmental information disclosure (Zhang et al., 2025). The specific selection of indicators and assignment of variables are shown in Table 2. Figure 5 shows the measurement index system of environmental performance.
Measurement of Environmental Performance.


Measurement of EP.
Explanatory Variables
This article investigates the relationship between environmental costs on firm performance, so the core explanatory variable is environmental costs (EC), that is, all environment-related expenditures incurred by firms, including the consumption of resources and subsequent compensation. Environmental costs are further categorized according to the time dimension. They are further divided into environmental costs arising from upfront prevention (
Moderating Variables
This article takes green credit (GC) as a moderating variable. In the existing literature, there are three primary approaches to choosing the measurement of green credit. Firstly, treating the policy associated with green credit as an exogenous incident and carrying out a quasi-natural experiment via the difference-in-differences method. Secondly, taking the green credit balance of 36 listed banks, divided by the annual broad money supply (M2), as a proxy variable for the green credit policy (Xu et al., 2023). Third, the energy-saving and environmental protection loan amount represents the level of green credit (He et al., 2019). In this article, we draw on the approach adopted by Xie and Liu (2019). Their method involves poring over the annual reports of listed companies and taking the share of green-credit received by companies in their total borrowing as a gauge. However, it must be noted that this measurement method based on annual report disclosures has certain limitations. For instance, the criteria and reporting standards for identifying green credit may vary across firms, and the voluntary nature of disclosure may introduce measurement errors or sample selection bias. Nevertheless, this indicator directly reflects the credit support actually obtained and recognized by the firms themselves as “green,” making it one of the most commonly used proxy variables in micro-level research.
Control Variables
To control for the potential influence of other factors on corporate performance, this study introduces the following variables as controls: (1) Firm size (Size), which determines the scope of daily operations and may influence the incidence of environmental costs. Following the approach of Wang, Li, and Liang (2025), it is measured by the natural logarithm of total annual assets. (2) Nature of ownership of enterprise (SOE), SOE = 1, non-SOE = 0. (3) The number of staff (Staff), calculated by the count of individuals participating in the company’s social security program. (4) The board of directors’ independence (Indep) is assessed by calculating the ratio of independent directors to the total number of board members. (5) If the chairman and the managing director are the same individual, the overlap of the chairman and CEO positions (Dual) is assigned a value of 1; otherwise, it is assigned 0. (6) Shareholding structure (Top1), where high ownership concentration can be reflected in solid control over managerial behavior (He & Kyaw, 2018), which can lead to lower environmentally related expenditures. (7) The stringency of environmental regulation (ER) prompts enterprises to place greater emphasis on environmental protection investment. (8) The management expense ratio (Mfee) also has an impact as companies do not have a separate account to account for environmental costs and can only charge the relevant incidence of environmental costs to management expenses. (9) The firm’s age (Age) affects the firm’s inputs. (10) Firm’s financing constraints (SA), if firms have to focus on their environmental performance to obtain additional funds in case of solid financing constraints (Shi et al., 2025). (11) Audit fees (audit fee): A firm’s investment in audit fees affects the firm’s resource allocation. (12) Financial background of business executives (FinBG): Executives with a financial background will have a more accurate grasp of the general trends of society. (13) Loss of the enterprise: The loss of the enterprise in the year will make the enterprise more prudent in allocating resources. (14) The average age of executives (TMTAge), the average age of the enterprise’s management, can be seen from the enterprise’s style of doing things.
The specific variable definitions are shown in Table 3 below.
Summary of Variables.

Sample Selection and Data Sources
This article takes Chinese A-share listed companies in the heavily polluting industry from 2013 to 2022 as the research sample. Data on green credit were manually collected from the annual reports of listed companies. Primary financial data were sourced from the China Stock Market and Accounting Research Database (CSMAR). Data on green patent applications were obtained from the Chinese Research Data Services Platform (CNRDS). Environmentally related data were derived from CSMAR. All data consist of aggregated, anonymized, macro-level corporate information and do not involve research with human participants or animals. Therefore, this study did not require ethical approval from an Institutional Review Board (IRB) or individual informed consent. Furthermore, all authors declare no known financial interests or personal relationships that could have influenced the work reported in this article. During the sample selection process, firms labeled as ST or ST* during the sample period and those with significant missing data were excluded, resulting in a final sample of 569 listed companies in heavily polluting industries. To mitigate the influence of outliers, all continuous variables were winsorized at the 1st and 99th percentiles.
Empirical Results and Analyses
Descriptive Statistics and Correlation Analysis
Descriptive Statistics
Table 4 shows the results of descriptive statistics of the variables.
Descriptive Statistics of Variables.

Correlation Analysis
This article uses variance inflation factor (VIF) to test whether there is multicollinearity among variables. The results are shown in Table 5, and the VIFs of the relevant variables are all less than 5, which can basically rule out multicollinearity and proceed to the next regression test.
Multiple Covariance Test.

Analysis of Regression Results
Study on the Impact of Environmental Costs on Firm Performance
Table 6 presents the benchmark regression results of the impact of environmental costs on firm performance, examining the relationship between environmental costs and two types of firm performance. From columns (1) and (2) of Table 6, it can be seen that adding the square term becomes significant. The coefficient of the first term is −8.899, significant at the 5% level, and the coefficient of the second term is .301, significant at the 5% level. The coefficient signs of the two are opposite, indicating a significant U-shaped relationship between environmental costs and corporate economic performance. From columns (3) and (4) of Table 6, it can be seen that after adding the square term, the quadratic coefficient is not significant. Therefore, there is a positive linear relationship between environmental costs and corporate environmental performance.
Regression Results of Environmental Costs and Firm Performance.

Note. Standard errors in parentheses. *p < .1. **p < .05. ***p < .01.
In further U-shaped relationship testing, the extremum point of the U-shaped curve can be obtained, which is the axis of symmetry of 14.80019 (as shown in Table 7). According to the descriptive statistics table in Table 4 above, it can be seen that the axis of symmetry is between the minimum value (7.501) and the maximum value (20.08) of environmental costs, satisfying the second condition of the U-shaped test. According to Table 7, the slope on the left side of the axis of symmetry is negative (−4.388728), and the slope on the right side of the axis of symmetry is positive (3.177131), which conforms to the U-shaped relationship test where the slope at the lowest environmental cost is negative and the slope at the highest environmental cost is positive. Thus, the results of this study indicate a U-shaped relationship between environmental costs and corporate economic performance. To further elucidate the economic significance of this U-shaped relationship, we calculated the marginal effect of changes in environmental costs on economic performance (measured by Return on Assets [ROA]). The calculations show that when environmental costs increase from the sample minimum (7.501) to the inflection point of the U-shaped curve (14.800), the firm’s ROA is projected to decrease by approximately 2.19 percentage points. However, when environmental costs continue to increase beyond the inflection point to the sample maximum (20.080), ROA instead increases by about 1.58 percentage points. This magnitude of change demonstrates that environmental cost investment has a substantial impact on corporate profitability. In the short term, excessively high environmental costs crowd out production resources, thereby suppressing profits. In the long run, however, the scale effects and green efficiency gains resulting from sustained investment can ultimately translate into significant competitive advantages and enhanced profitability. In conclusion, hypothesis H1a is not only statistically supported but its economic significance is also validated. Figure 6 illustrates the U-shaped relationship between environmental costs and corporate economic performance.
U-shaped Relationship Test.


U-shaped relationship.
According to the data presented in columns (3) and (4) of Table 6, the relationship between environmental cost and environmental performance is notably positive, with a coefficient of .123. In contrast, the coefficients for the linear and squared terms fail to show statistical significance once the squared term has been included. This indicates that environmental cost has a positive linear impact on the environmental performance of enterprises, that is, with the input of environmental cost, the environmental performance of enterprises will be improved, confirming hypothesis H1b.
Table 8 shows the empirical results after the study categorized the environmental costs, and regression analyses were conducted to analyze the relationship between environmental costs invested in pre-prevention and environmental costs generated by end-of-pipe treatment and enterprise performance, respectively. Column (1) shows that the relationship between the impact of pre-prevention on the economic performance of enterprises shows a significant U-shaped relationship, indicating that the environmental cost inputs of pre-prevention will inhibit the improvement of the economic performance of enterprises in a short period. In the long run, pre-prevention will promote the improvement of the economic performance of enterprises. This may be due to the need to transfer part of the resources for front-end green R&D investment in the early stage; column (2) shows that the impact of end-of-pipe management on the economic performance of the enterprise is not significant, that is, end-of-pipe management does not significantly affect the economic performance of the enterprise. To guarantee the validity of the findings, the model in column (3) examines the impact of environmental costs of upfront prevention (ECFG) and end-of-pipe treatment (ECEG) on firms’ economic performance at the same time. The regression results show that the coefficient of the environmental cost of pre-prevention inputs is significantly positive, which can indicate that the environmental cost generated by pre-prevention is more capable of enhancing the firms’ economic performance compared to the end-of-pipe treatment. From the coefficients of the two models, the coefficient of the quadratic term of the pre-prevention is positive, indicating that the environmental cost of the pre-prevention will negatively affect the enterprise’s economic performance in the beginning. However, the increase in the inputs will make this negative impact positive. Moreover, the end of the treatment of the quadratic term coefficient is opposing, indicating that at the beginning of the enterprise, in order to prevent the limited resources from being occupied, choosing to bear the environmental costs indeed will make the enterprise’s economic performance will not be affected, but with the later environmental management efforts to increase, and then continue to take a passive approach, will only negatively affect the enterprise’s economic performance. The absolute value of the environmental cost coefficient generated by prevention (.115) is greater than the absolute value of the environmental cost regression coefficient generated by end of pipe treatment (−.031), indicating that pre prevention has a more effective impact on the economic performance of enterprises than end of pipe treatment, thus verifying hypothesis H2a.
Impact of Front-End and Back-End Environmental Costs on EP.

Note. Standard errors in parentheses. *p < .1. **p < .05. ***p < .01.
Columns (4) to (5) of Table 8 examine the impact of categorized environmental expenses on corporate environmental performance. Column (4) demonstrates that early prevention measures do not significantly correlate with corporate environmental performance. Conversely, column (5) shows a highly significant positive impact of end-of-pipe treatment on corporate environmental performance. This suggests that investments in end-of-pipe treatment contribute to enhanced corporate environmental performance, thereby refuting hypothesis H2b. This could be attributed to the fact that as fines and pollution fees escalate, companies that heavily contribute to pollution are likely to become more mindful of environmental concerns. As a result, they may enhance their environmental practices and steer clear of incurring additional fines. The comparison between early prevention and end of pipe treatment in column (6) indicates that end of pipe treatment has a greater and more significant impact on corporate environmental performance than early prevention.
Study on the Regulatory Impact of Green Credit
To explore how green credit affects the relationship between environmental expenditures and corporate performance. The regression analysis results are presented in Table 9. Column (1) in Table 9 is a study of the moderating role of green credit in the overall environmental costs on firms’ economic performance, introducing the squared term of environmental costs to cross-multiply with green credit (EC2 * GC) and the results show that the coefficient of this interaction term is .508, which is significant at the 5% level, and columns (2) and (3) are subdivided with the point of inflection as the axis of symmetry, and column (2) is the case to the left of the point of inflection, the coefficient between environmental costs and firms’ economic performance is negative, indicating that environmental costs at this point are inhibiting the growth of firms’ economic performance. The interaction term between environmental costs and green credit is positive at this point, indicating that green credit alleviates the inhibiting effect of environmental costs on firms’ economic performance to some extent. In Column (3), we examine the scenario to the right of the inflection point, where environmental costs positively influence the economic performance of companies. The interaction term’s coefficient stands at .954, a value significant at the 5% level. This suggests that, at this juncture, green credit serves as a catalyst, enhancing the effect of environmental costs on the economic performance of these enterprises. From Figure 7, we can also intuitively see the regulatory effect of green credit. As green credit expands, the inflection point on the U-shaped curve moves to the left, further demonstrating the nonlinear regulatory effect of green credit and confirming hypothesis H3a. Column (4) examines how green credit influences the connection between environmental costs and a company’s environmental performance. By incorporating the interaction term (EC * GC) into the analysis, the regression results show that the coefficient of this term is 1.588, significant at the 5% level. This result validates hypothesis H3b, indicating that green credit notably strengthens the link between environmental costs and corporate environmental performance. Figure 8 reflects the moderating effect of green credit.
Moderating role of green credit between environmental costs and firms’ performance.

Note. Standard errors in parentheses. *p < .1. **p < .05. ***p < .01.

The regulatory role of GC in EC and FP.

The regulatory role of GC in EC and EP.
Robustness and Endogeneity Tests
Hysteresis Effect Test
Given that environmental costs may occur over an extended span, in line with Li’s approach (Li et al., 2020), the explanatory variables will be subjected to a one-period lag treatment prior to conducting empirical analyses. This is done to examine how environmental costs incurred in the previous period impact the current corporate performance. The empirical findings are presented in Table 10.
Empirical Results with One Period Lag.

Note. Standard errors in parentheses. *p < .1. **p < .05. ***p < .01.
As indicated in column (1) of Table 10, a notable U-shaped connection persists between the one-period-lagged squared term of environmental costs and the corporate economic performance. This finding gives credence to hypothesis H1a. From column (2), a significant positive correlation with a one-period lag exists between environmental costs and environmental performance, supporting hypothesis H1b.
Instrumental Variables Test (IVT)
In light of the potential issue of omitted variables, this study utilizes the approach suggested by Cui et al. (2019). Specifically, it selects industrial carbon dioxide emissions as an instrumental variable. This variable meets the requirement of correlating with the explanatory variable (environmental costs) yet has no direct link to the explained variable (firm performance). The findings derived from the two-stage least squares analysis are presented in Table 11. The findings from the regression analysis indicate that substituting environmental costs with carbon dioxide yields results that align with the primary regression outcomes. Furthermore, the test results corroborate those presented in the earlier section, thereby reinforcing the credibility of the research findings.
Regression Results of the Two-Stage Least Squares Method.

Note. Standard errors in parentheses. *p < .1. **p < .05. ***p < .01.
Further Analyses
Influence Pathways of Green Technology Innovation
Examination of the Pathway Mechanisms in Green Technology Innovation
The Porter Hypothesis posits that well-designed and stringent environmental regulations can stimulate firms to engage in green technology innovation through an innovation compensation effect, thereby helping them build core competitiveness, offset compliance costs, and gain competitive advantage in the market (Chen et al., 2022; Luo et al., 2023; Yu, 2021; Zhang, Deng, & Wu, 2022). Following the method proposed by Wen and Ye (2014), this article constructs a stepwise regression model to verify the mediating role of green technology innovation:


Where
Intermediation Mechanism Test
The primary regression link between environmental costs and corporate performance has been confirmed, which is why Table 12 presents only the outcomes from the final two stages, specifically the effect of the quadratic component of environmental costs on the mediating factor of green technology innovation. According to the FP column in Table 12, the impact coefficient of environmental costs on green technology innovation is 2.702, indicating a significant relationship at the 5% level. When both environmental costs and green technology innovation are factored in, the influence of environmental costs on economic performance is significant at the 10% level. The impact coefficient of green technology innovation on enterprises’ economic performance stands at .295 and is significant at the 5% level. This shows that green technology innovation has a somewhat mediating function. As for the EP column, the impact coefficient of environmental cost on green technology innovation is .411, significant at the 1% level, suggesting that environmental cost has a notably positive impact on green technology innovation. Once environmental costs and green technology innovations are integrated into the model, it is revealed that the impact coefficient of green technology innovation on the environmental performance of enterprises stands at .078, which is statistically significant at the 1% level. The environmental costs exhibit a notably strong positive relationship with enterprise environmental performance at the 1% significance level. This suggests that green technology innovation plays a partial mediating role between these environmental costs and the performance of the enterprise in environmental matters.
Mediating Mechanism Test for Green Technology Innovation.

Note. Standard errors in parentheses. *p < .1. **p < .05. ***p < .01.
Heterogeneity Test
The Effect of Heterogeneity of Firm Ownership Rights
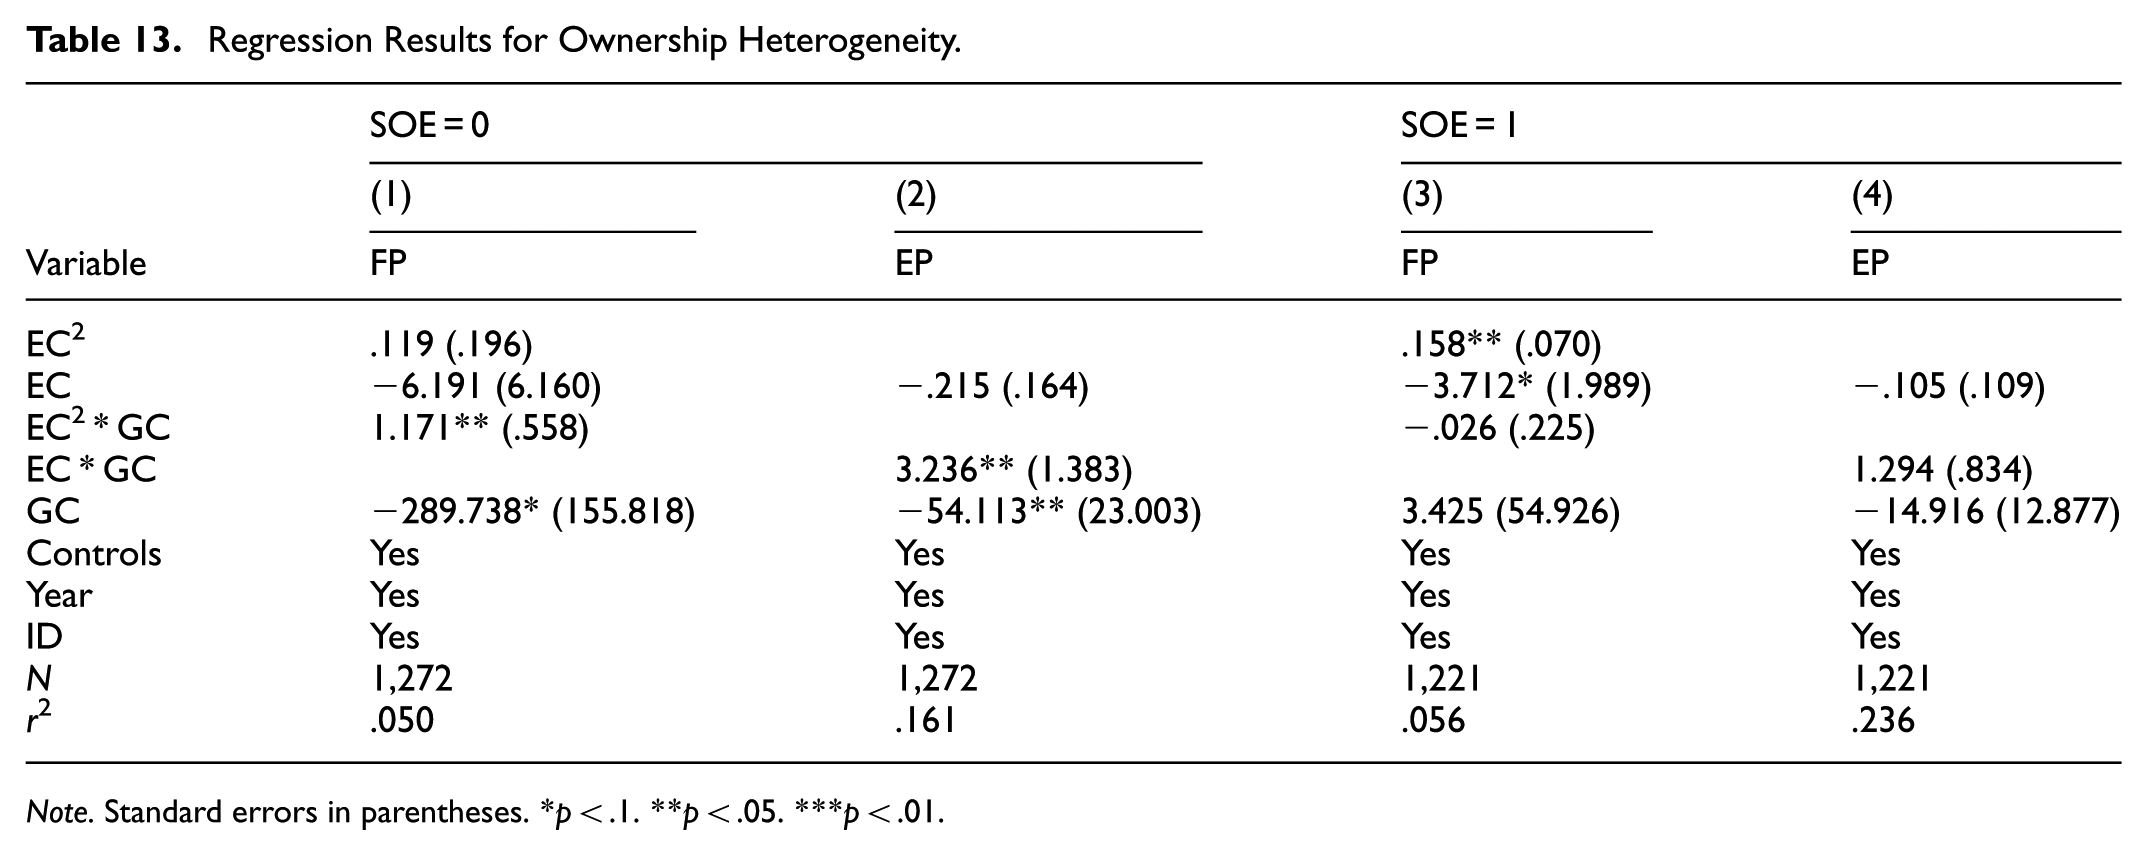
Green credit, as a market-based policy tool, embodies more credit constraints. To examine the strength of green credit’s regulatory impact on businesses with varying ownership structures, this study categorizes the sample firms into state-owned enterprises (SOEs) and non-state-owned enterprises (non-SOEs), with the regression findings presented in Table 13. Columns (1) and (2) illustrate the moderating impact of green credit in state-owned enterprises, whereas columns (3) and (4) depict its effect in non-state-owned enterprises. The study finds that the coefficient of the interaction term between environmental costs and green credit is significantly positive in state-owned enterprises (SOEs), indicating that green credit enhances the promoting effect of environmental costs on corporate performance. This may stem from the dual advantages in resources and institutional mechanisms possessed by SOEs: on one hand, they enjoy greater resource support in accessing green credit; on the other hand, as entities that reflect government objectives, SOEs are more proactive in responding to national policies, making it easier for them to obtain green credit support.
Regression Results for Ownership Heterogeneity.
Note. Standard errors in parentheses. *p < .1. **p < .05. ***p < .01.
The Effect of Heterogeneity in the Degree of Environmental Regulation
The intensity of environmental regulation varies from region to region, where the intensity of environmental regulation is high, the criteria for granting green credits will be more stringent. Therefore, this article uses the proportion of environmental protection related vocabulary in government reports as an indicator to assess the strength of environmental regulations, and uses the median of environmental regulation intensity as a classification basis to divide the region into high environmental regulation areas (ER = 1) and low environmental regulation areas (ER = 0), aiming to explore the regulatory role of green credit under different environmental regulation intensities. Table 14 presents the regression outcomes. Columns (1) and (2) illustrate how green credit influences regions with stringent environmental regulations, while columns (3) and (4) highlight its impact in areas where such regulations are less rigorous. The interaction between environmental costs and green credit (EC * GC) reveals that green credit plays a more substantial role in influencing firm performance in areas with stringent environmental regulations compared to those with lax regulations.
Regression Results for Environmental Regulation Heterogeneity.

Note. Standard errors in parentheses. *p < .1. **p < .05. ***p < .01.
Conclusions and Research Outlook
Conclusions
Drawing on data from 2013 to 2022, this study explores how environmental costs influence the performance of businesses, while also examining the underlying mechanisms at play among publicly traded firms within the heavy pollution sector. The findings indicate the following: (1) There exists a non-linear association between environmental costs and enterprise economic performance, which is a significant negative correlation in the short term and a significant positive correlation in the long run. The environmental cost and the environmental performance of enterprises present a long-term significant positive correlation. (2) After classifying the environmental costs according to the time sequence, it is found that the influence of the environmental costs invested in the pre-prevention on the economic performance is more significant than the impact of the environmental costs generated by the end of the treatment on the economic performance. The environmental costs generated by the end-of-pipe the treatment on the environmental performance of the enterprise are more significant than the impact of the environmental costs invested in the pre-prevention on the environmental performance. (3) Under the regulating effect of green credit, the negative impact of environmental costs on the economic performance of enterprises is mitigated, and the positive impact is promoted. The positive impact of environmental costs on environmental performance is promoted. (4) In further analysis, it was found that environmental costs have a significant impact on corporate performance through the pathway of green technology innovation. In the heterogeneity discussion, it was discovered that the moderating effect of green credit is more pronounced in state-owned enterprises than in non-state-owned ones. In regions with higher environmental regulation levels, the regulatory function of green credit is more prominent than in those with lower levels.
Limitations and Research Outlook
Although this study has made some marginal contributions, it is not without its limitations. One limitation concerns the measurement of environmental performance, which in this study is primarily based on content analysis. Although this method demonstrates good applicability in specific research contexts, the composite score approach based on categorical indicators still has room for optimization in terms of weight allocation. Future research could explore introducing more sophisticated weighting methods or machine learning techniques to further enhance the accuracy and objectivity of environmental performance measurement.
Footnotes
Ethical Considerations
This article does not contain any studies with human or animal participants. There are no human participants in this article and informed consent is not required.
Consent to Participate
All the authors of this article were consented to participate.
Consent for Publication
This study was consented to be published.
Author Contributions
Liping Wang: Formal analysis, Project administration, Supervision, Writing – review & editing. Ru Li: Data curation, Formal analysis, Writing – original draft. Min Chen: Resources, Validation, Writing – original draft. Chuang Li: Conceptualization, Formal analysis, Funding acquisition, Methodology, Writing – review & editing.
Funding
The authors disclosed receipt of the following financial support for the research, authorship, and/or publication of this article: The research is supported by the National Social Science Fund of China (24FJYB037) and the Innovation Strategy Research Plan Project of Fujian Province (2025R0046).
Declaration of Conflicting Interests
The authors declared no potential conflicts of interest with respect to the research, authorship, and/or publication of this article.
Data Availability Statements
Data will be made available on request.