
Abstract
Environmental regulation has emerged as an institutional response to the global ecological crisis, leading to discussions on its impact on green technology innovation. However, due to variations in indicator selection and data analysis, the academic community has yet to reach a consensus on this matter. To shed further light on the relationship between environmental regulation and green technology innovation, this study focuses on innovation investment in Chinese provincial regions from 2008 to 2019. By incorporating spatial econometrics, mediation effects, and threshold models, the study investigates the role of innovation investment in the influence of environmental regulation on the process of green technology innovation. The findings reveal the following: (1) The impact of environmental regulation on green technology innovation follows a non-linear “U-shaped” relationship. (2) Innovation investment acts as a mediator in the promotion of green technology innovation by environmental regulation, but this mediating effect exhibits stage-specific characteristics. (3) Environmental regulation has a threshold effect on the promotion of green technology innovation, with a more significant impact observed beyond the threshold value. Overall, these conclusions highlight the crucial role of innovation investment in driving the development of green technology innovation under environmental regulation.
Introduction
In the post-pandemic era, the world faces unprecedented challenges in both climate change and economic recovery. The global climate change, exacerbated by the dominance of industrial civilization and its brown economy, has resulted in increasingly frequent extreme weather conditions, such as droughts, floods, and glacial melting (Azarpajouh, 2022; Sempertegui, 2022). The urgency to address these issues has become paramount. Green technology innovation (GT) emerges as a promising solution within this context. GT, as a novel technological system, offers avenues for energy conservation, emission reduction, and mitigating the impact of environmental pollution on the global climate. Moreover, it serves as a catalyst for the development of ecological civilization (Barbieri et al., 2020). Recognizing the significance of GT, the “14th Five-year Plan” explicitly emphasizes the necessity of constructing a market-oriented GT system and strengthening the waste pollution control system (Sun et al., 2017). However, despite its potential benefits, GT faces challenges, particularly regarding its substitutability. Without external intervention, high-polluting industries often prioritize traditional methods due to market scale effects and the perceived profit advantage of conventional innovation. This reluctance to adopt GT exacerbates environmental pollution and hampers progress toward sustainability. Hence, governmental intervention becomes imperative. Environmental regulations (ER) serve as effective tools to incentivize and guide heavy-polluting industry enterprises toward GT adoption (Y. J. Zhang et al., 2017). In essence, the synergy between GT and environmental regulations offers a pathway to address the intertwined challenges of climate change and economic recovery in the post-pandemic era. Through targeted policies and collaborative efforts, governments and industries can pave the way for a greener and more sustainable future.
Green technology innovation encompasses various techniques aimed at reducing energy consumption and environmental pollution across different sectors such as production, energy utilization, engineering construction, and logistics (Chen et al., 2016) . has remarkable positive spillover effects on the environment and stimulates innovation by sharing knowledge. (W. Cai & Li, 2018); environmental positive externalities may lead to market failure, and without external constraints and incentives, companies lack the enthusiasm to GT (Ghisetti & Pontoni, 2015; Marino et al., 2019); undoubtedly distorts the competition between GT and traditional innovation; means that GT is a strongly policy-driven innovation model in the absence of market forces, in which ER is an important driving force for GT (Guo et al., 2017; Johnstone et al., 2017), and scientifically reasonable ER can effectively resolve the positive externalities of GT and solve market failure issues (Hille & Möbius, 2019; F. Z. Wang et al., 2018); there is currently no consensus on whether ER can promote GT (D. Zhang & Vigne, 2021), mainly forming three levels:
(1) The promotion theory suggests that strengthening ER can stimulate companies’ willingness to innovate green technologies (Cainelli et al., 2019; Feichtinger et al., 2005); Feichtinger et al. (2005) and Cainelli et al. (2019) found that mandatory enforcement of policies during the implementation of controlled ER can internalize the external effects of environmental pollution (Xie et al., 2017). By imposing higher costs on pollution control, a “crowding-out effect” can be induced, which can bring energy-saving and emission-reducing pressure to companies and stimulate their willingness to innovate green technologies (X. Yang et al., 2020). On the flip side, incentive-based ER, With their inherent flexibility, companies are granted complete autonomy, enabling them to fully unleash their initiative, enhance investments in green technologies through diverse channels, convert environmental externalities into endogenous ones, and elevate their expectations regarding income generated from research and development (R&D; Xepapadeas & Zeeuw, 1998).
(2) The inhibition theory suggests that the introduction of ER has a “crowding-out effect” on corporate investment in innovation (Guo et al., 2017). The presence of ER escalates the expenses associated with corporate pollution control, consequently diverting funds away from investments in GT. Simultaneously, stringent ER shift significant environmental responsibilities onto enterprises, resulting in augmented investment costs. (Y. J. Zhang et al., 2017). Based on the cost-effectiveness principle, companies will reduce innovation investment. In line with the “pollution haven hypothesis,” companies often relocate polluting industries to regions with less stringent ER, consequently diminishing their contribution to local green technology investments (Wu et al., 2020). Furthermore, Schumpeter’s threshold theory implies that ER can erode the scale and capital advantages held by large enterprises, consequently impeding GT. This is primarily due to escalated production costs and the potential for government rent-seeking behavior, which further exacerbates the negative impact on innovation (Tang et al., 2020).
(3) Nonlinear relationship: mainly refers to the non-synchronous positive and negative effects of ER on GT—the negative effects start to play a role In the present period, we observe the emergence of negative effects, while the positive effects are delayed due to the lengthy cycle of green technological innovation activities and the associated high risks (Jiang et al., 2013). In the short term, companies have limited options and can only choose to adjust the types and quantities of products, which would result in lower corporate profits and directly weaken the company’s R&D capabilities. This is especially true for small-scale enterprises with low profits. However, in the long run, as ER improve, the relative profitability of GT increases. Enterprises can then adapt their technological innovation strategies to align with the level of ER, thereby promoting GT. This dynamic relationship ultimately leads to a U-shaped correlation between GT and the ER system (W. G. Cai & Li, 2019; J. Zhang et al., 2019); However, neighboring provinces exhibit an inverted U-shaped relationship with GT (Dong & Wang, 2019); In addition, Yang et al. (2012) argues that ER will force high-pollution, energy-consuming enterprises to treat waste, squeeze innovation investment, and that there doesn’t appear to be a clear correlation between increased emission reduction expenditures and GT (C. H. Yang et al., 2012). However, incentive ER such as fiscal, taxation and finance can effectively promote regional ER, which also verifies the differences in ER in different regions and causes differences in GT effects (Horváthová, 2012).
It is evident that the academic community has extensively researched the field of ER and GT, leading to a substantial accumulation of research findings. However, a consensus has not yet been reached, possibly due to variances in research subjects, sample types, sample regions, and sample time intervals. These factors have contributed to the divergence of opinions, offering valuable research clues for further in-depth exploration of the topic.
From the micro level, whether to achieve a win-win situation of ER and GT mainly depends on the compensation effect of GT. In the process of ER to resolve the problem of “market failure” caused by GT, innovation investment plays an indispensable key role. The reason is that GT requires more innovation capital investment than traditional innovation, and relying only on limited government innovation investment and financial subsidies cannot effectively make up for the gap of GT capital (Pei et al., 2019); In addition, GT has higher market and R & D risks than traditional technology innovation, and has a long return cycle. Enterprise innovation investment is still the main source of funds and guarantee for current GT; Strict ER can force enterprises to make aggressive venture capital decisions, increase innovation investment, and Facilitate the advancement of GT (Meng & Han, 2017); However, innovation investment of enterprises is still difficult, which is mainly reflected in the fact that ER force enterprises to dispose of pollution ends, increase the environmental treatment costs of enterprises, and form a “squeeze effect” and a “restraint effect” on innovation investment funds. Moreover, under the harsh financing conditions, innovation investment of enterprises is difficult (S. S. Wang et al., 2020). In short, innovation investment is among the key factors influencing the implementation of the “Porter Hypothesis,” but it is also constrained by ER.
The subsequent content arrangement of this article is as follows: The second part presents the construction of the theoretical model, providing a systematic explanation of the theoretical mechanism of the impact of ER on GT from the perspective of innovation investment. The third part focuses on the design of the model and the selection of indicators, laying the foundation for empirical research in the subsequent sections. The fourth part conducts empirical research to validate the relationships among variables. The concluding section summarizes the primary findings and offers policy recommendations.
Theoretical Model Construction
According to the different subjects of Innovation investment Innovation investment can be categorized into traditional industry Innovation investment and green industry Innovation investment. Green industry Innovation investment is mainly aimed at balancing the relationship between economy and environment, and pursuing maximum ecological effects, while traditional industry Innovation investment is aimed at maximizing market profits. Under the strong ER, Traditional industry innovation investment and green industry innovation investment have varying effects on GT. To scientifically unlock the mechanism of the role of enterprise Innovation investment in the process of ER affecting GT, this paper draws on the research of scholars such as Ji et al. (2021) and constructs a theoretical model in this paper.
Environmental Regulation and Innovation Investment
Assuming that the production functions corresponding to the Innovation investment of traditional industry and green industry are

Among them,
From this, according to the Lagrange multiplier method, under the objective constraint function, the optimal decision equation is:
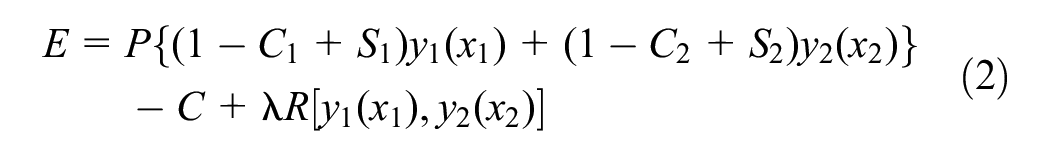
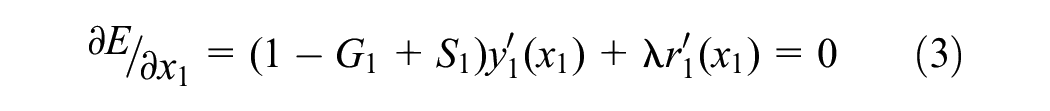


(1) Under the scenario of low ER, driven by profit, the traditional innovation model dominates, and rational enterprises may choose to “free ride” and reduce investment in GT. At this time, government subsidies tend to focus on GT R&D, resulting in
When ER is low, under the dominance of profit-driven traditional innovation, the scale of GT R&D investment within traditional industries is continuously reduced, indirectly weakening GT.
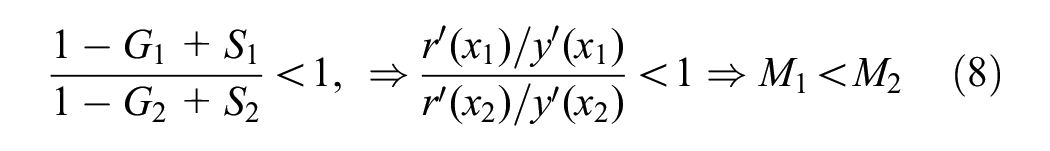
(2) Under the scenario of high ER, the government increases the punishment for waste emissions. Under regulatory pressure, enterprise innovation investment gradually shifts from traditional innovation to GT. In the market competition and scale effect, traditional industries will have to pay more investment costs on the road of green innovation than the green industry, that is,

That is, when ER are at a high level, the high cost of waste disposal forces companies to invest in GT, and the “innovation compensation” effect gradually emerges.
Innovation Investment and GT

Among them,

When ER is at a low level, the output of GT in the green industry is relatively high, which leads to
That is, when the ER is at a low level, the investment in green innovation in traditional industries is insufficient, which is not conducive to the output of GT in society as a whole.
(2) When ER are at a high level, traditional industries will increase their investment in green innovation and promote the output of GT under high-pressure policies, at which point
It can be seen that there is a certain nonlinear relationship between innovation investment and GT, and the promotion or inhibition depends on the intensity of ER. From the above theoretical models, it can be seen that the ER has different effects on GT at different stages.
Model Design and Indicator Selection
Model Design
The SDM model combines the advantages of the SAR and SEM models and can effectively analyze the impact of ER on GT. Therefore, this article will be based on the SDM model to construct relevant models, as follows:

Where


Indicator Selection
The variable data utilized in this study is derived from provincial-level panel data spanning from 2008 to 2019. However, it should be noted that due to significant data gaps in Tibet, it was not included in the analysis. The data primarily originate from 30 provinces and cities in China, with data sources including the “China Statistical Yearbook,” the “China Environmental Statistical Yearbook,” the “China Science and Technology Statistical Yearbook,” as well as the website of the State Intellectual Property Office of China (SIPO) and the National Intellectual Property Administration (CNIPA). These yearbooks and websites serve as the primary sources of raw data.
Dependent Variable
Green technological innovation (GT): Green technology innovation (GT) makes pivotal contributions in reduction of environmental burden. The measurement of GT has not reached consensus according to existing literature, among which, indicators regarding efficiency and patent are often applied. However, GT efficiency includes indicators that are not highly related to environmental pollution, which is less representative. Therefore, this paper selects the number of green technology invention patent grants to represent the progress of green technology. By utilizing the International Patent Classification (IPC) codes for green patents listed in the Green Patent Index provided by the World Intellectual Property Organization (WIPO; http://www.wipo.int/classifications/ipc/en/est), and setting parameters such as patent type, IPC classification codes, and addresses of the inventing entities (individuals), patent data at the provincial level is obtained from the State Intellectual Property Office of China’s patent publication and announcement website (Dong & Wang, 2019) .
Core Explanatory Variable
Environmental Regulation (ER): Scholars have measured environmental regulation from various perspectives, such as environmental policy, investment in environmental governance, pollution emissions, and environmental management performance. However, these indicators only reflect the level of environmental regulation from one aspect and do not capture its comprehensive level. Following the approach of Kang and others, this paper uses the ratio of regional gross domestic product (GDP) to total regional energy consumption to reflect the intensity of environmental regulation. This ratio can indicate the overall effect of regional environmental regulations. The higher the ratio, the more evident the energy-saving and emission-reduction effects are under a given level of GDP, which also means a greater intensity of environmental regulation (Kang & Ru, 2020) .
Mediation Variables (Threshold Variables)
Innovation Investment (GI): To scientifically represent innovation investment, this paper adopts Gu’s research findings and calculates the capital stock of innovation investment using the perpetual inventory method (Gu & Zhao, 2021) . The specific calculation formula is as follows:


Control Variables Cover FDI, ISU, URB, GF
Foreign Direct Investment (FDI):Foreign investment introduces capital and advanced technology, stimulating the vitality of enterprises’ green innovation, and positively impacts the research and development of green technologies. Based on this, the paper draws on the research findings of Sun et al., measuring it by the logarithm of the total actual foreign direct investment (Sun et al., 2017).
Urbanization level (URB) influences green technology innovation through agglomeration effects and improved infrastructure, which accelerate technology exchange and application. Based on this, the paper characterizes urbanization level by the proportion of urban population to total population at year-end (Guo & Tan, 2024)
Industrial structure upgradin (ISU): Industrial structure upgrading specifically denotes the transition of industries from low-end to high-end sectors, facilitating green technology innovation through optimized resource allocation. Regarding the measurement of industrial structure upgrading, there is no unified standard within the domestic academic community yet. To scientifically represent the level of domestic industrial structure upgrading, this paper constructs an index based on Wang’s method for industrial structure upgrading, with the specific formula as follows (W. Wang et al., 2015):

Where
Government support (GS): Government support boosts green technology innovation through financial incentives, regulations, and fostering industry-research collaboration, accelerating sustainable development. Based on this, the paper characterizes government support for green technology innovation by the proportion of innovation investment in government expenditures.
To scientifically reflect the accuracy of variable data, the paper conducts a descriptive statistical analysis of the variables, as detailed in Table 1.
Descriptive Statistics.

Empirical Research
Direct Effect
Moran’s I Index of Core Variables From 2008 to 2019.

p < 0.01. **p < 0.05. *p < 0.1.
Model Test.

Estimated Results of ER and GT.

p < .01. **p < .05. *p < .1.
Endogeneity Test
Due to omitted variables or reciprocal relationships between variables, endogeneity issues may arise, affecting the scientific validity of the conclusions. Based on this, the study employs the SYS-GMM model to conduct an endogeneity test, aiming to explore the scientific validity of the research findings. The research conclusions are presented in Table 5.
Endogeneity Test.
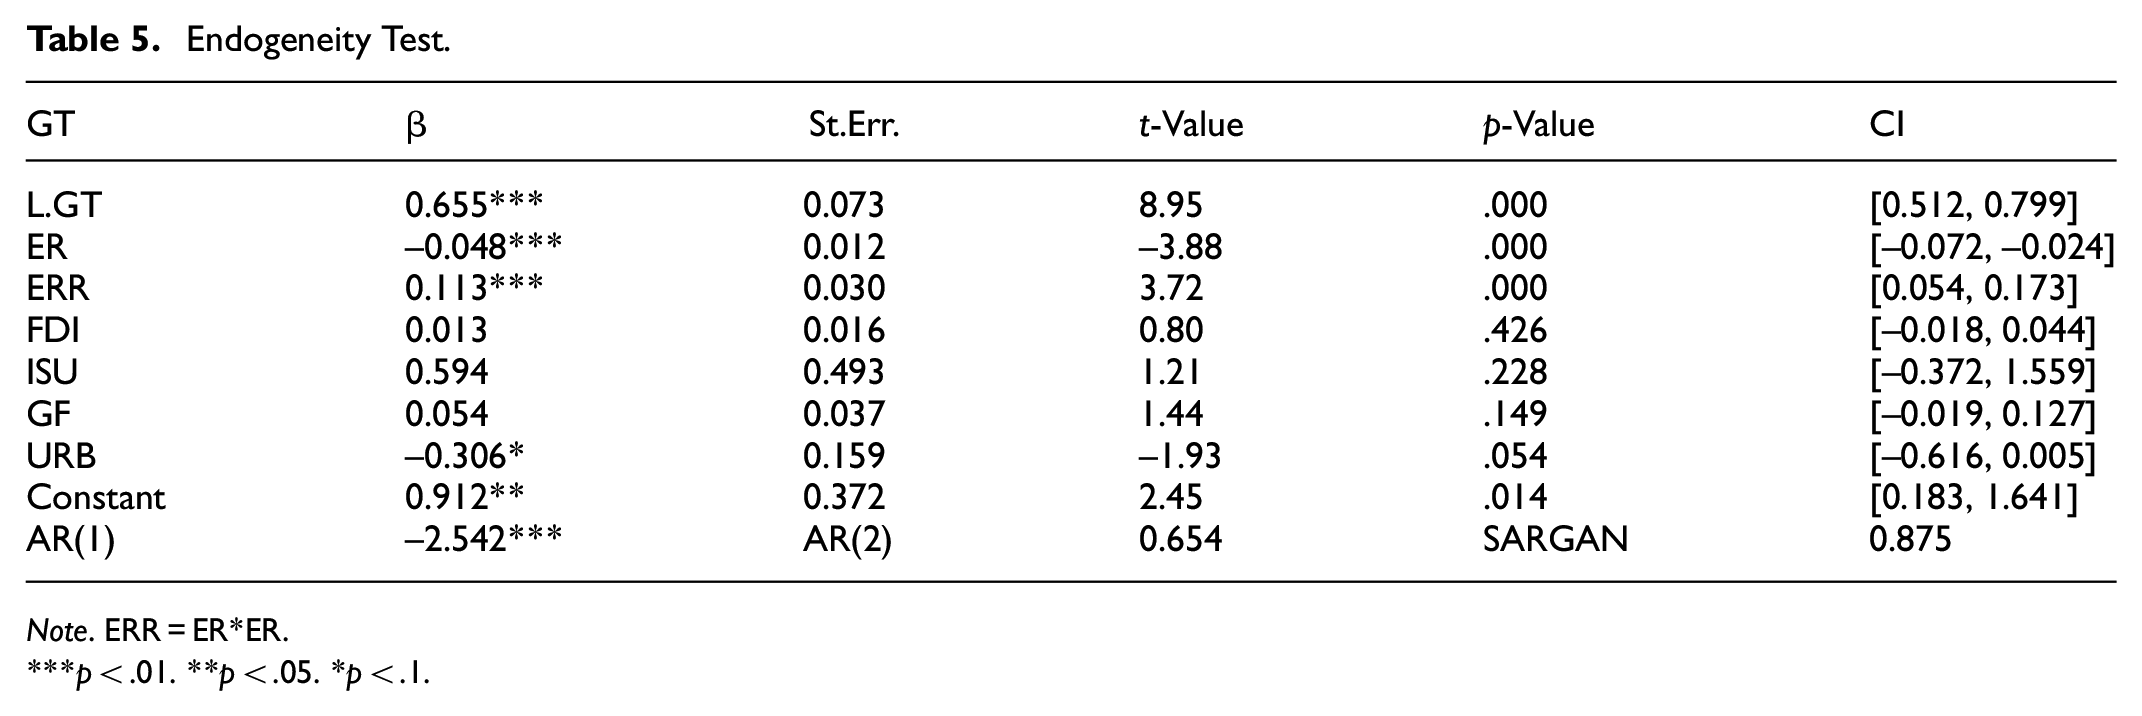
Note. ERR = ER*ER.
p < .01. **p < .05. *p < .1.
Table 5 reveals a significant positive coefficient for the lagged variable of GT (L.GT), indicating the presence of the “ratchet effect.” This analysis warrants the use of SYS-GMM. Furthermore, the absence of second-order serial correlation in the error terms, as confirmed by the AR(2) test, along with the validity of the results established by the Sargan test, reinforces the reliability of the SYS-GMM regression results.
From Table 5, it is evident that the first-order term of ER significantly inhibits green technology innovation, while the second-order term promotes it. Thus, considering endogeneity issues, there still exists a U-shaped non-linear relationship between ER and GT, confirming the accuracy of the conclusions.
Mediation Effect
According to Model 4 in Table 6, there is a “U”-shaped nonlinear relationship between ER and GT. Only when ER reaches a certain level can it significantly promote GT, confirming the existence of Porter’s hypothesis. Model 5 reflects the impact of ER on GI. The first-order term of ER has a driving effect on GI, however, it lacks statistical significance. The quadratic term significantly influences enterprise innovation investment. Hence, it is only when ER reaches a high level and the associated regulatory costs become burdensome for enterprises that they are compelled to increase their investment in technology innovation. This leads to an innovation compensation effect, which helps counterbalance the negative impact of compliance costs on enterprises.
Test of the Mediating Effect of ER on GT: GI as the Mediating Variable.

p < .01. **p < .05. *p < .1.
Based on Model 4, a mediating variable was added—innovation investment, forming Model 5. From Model 6, it is found that after incorporating innovation investment, the quadratic term of ER continues to have a significant positive impact on the promotion of GT, but the first-order term inhibits it. Compared with Model 4. The indirect effect of ER on GT through GI declined from 0.086 to 0.074. This suggests that the causal path of “ER → GI → GT” is established, and GI acts as a mediating role. However, this mediating effect is contingent upon the specific stage of development and the strength of ER, and the role of enterprise innovation investment cannot be ignored.
Threshold Model
The direct and mediating effects of ER on GT analysis demonstrate a non-linear relationship, characterized by a “U-shaped” pattern, between ER and GT, the mediating effect of innovation investment has stage-specific features. To scientifically analyze the variations in the influence of ER on GT at different stages of innovation investment, this study, in collaboration with Hansen’s threshold model. The Bootstrap sampling method was utilized to explore the threshold value of the mediating effect of innovation investment, as shown in Table 7.
Threshold Test.

Note. trim(0.01 0.03) grid(100) bs(500 500).
From Table 7, it can be seen that enterprise Innovation investment passed the single threshold effect test but failed the double threshold test. Therefore, it can be concluded that there is a single threshold effect of enterprise Innovation investment in the process of ER promoting GT. Furthermore, Figure 1 presents the relationship between threshold estimation values and LR. The corresponding confidence interval for the threshold value of 16.400 is [16.327, 16.431]. Confidence interval corresponding to the threshold value of 16.400 is [16.327, 16.431]. The critical value of the likelihood ratio test at the 5% significance level is 7.35, based on which it can be considered that the threshold effect estimation value of Innovation investment is reliable and valid.

Estimate of innovation investment threshold and confidence interval.
Following the threshold test, an innovation investment threshold variable was utilized to conduct a panel regression analysis. The regression results presented in Table 8 indicate that there is a positive but statistically insignificant impact of ER on GT when the level of innovation investment is relatively low (GI < 16.400). This finding is in line with the theoretical analysis presented in this paper, which suggests that when enterprise innovation investment is at a relatively low level, traditional innovation profit-driven factors hinder breakthroughs in GT, and it is difficult to offset the “crowding out effect” of ER on environmental pollution end-of-pipe disposal resources. Furthermore, as the primary source of investment in GT, the government may lack the same level of sensitivity to market information as enterprises. This can make it challenging to capture and respond to the social demand for GT in a timely manner, hindering the formation of a mutually beneficial relationship between ER and GT.
Shows the Threshold Estimation Results.

p < 0.01. **p < 0.05. *p < 0.1.
Further analysis reveals that when the level of innovation investment in enterprises exceeds the threshold value of GI > 16.400, the effect of ER on GT becomes statistically significant at the 1% level, with a path coefficient of 0.330(as detailed in Table 8). This indicates that ER can significantly promote GT when enterprise innovation investment surpasses the threshold. As the level of innovation investment increases, a higher proportion of funds is allocated to GT, driving breakthroughs in green technology and partially compensating for the “crowding-out effect” of ER on enterprise financial resources. This creates an “innovation compensation effect” and achieves a dual impact of ER on GT. The research conclusion indirectly reflects the threshold effect of innovation investment in promoting GT through ER.
Conclusion and Policy Recommendations
Conclusion and Discussion
Based on the above research conclusion, the study integrates GI, ER, and GT into a unified research framework, constructing a theoretical model to systematically delineate the relationships among them, thus revealing the theoretical “black box” among the three. Building upon this, utilizing spatial econometric models, mediation models, and threshold models with support from provincial panel data, the study elucidates the underlying mechanisms of how GI mediates the promotion of GT by ER. The research findings are as follows:
(1)
(2)
(3)
In summary, this study not only expands the understanding of the relationship between ER, GI, and GT in theory but also provides a unified research framework in methodology. It helps to deeply understand the complex interaction among the three, offering important theoretical support for promoting green technology innovation.
Research Limitations
(1)
(2)
(3)
Policy Recommendations
(1) Develop ER tailored to local conditions. Based on regional characteristics, clarify the goals of ER under the context of green development, and scientifically and reasonably develop ER policies that are in line with regional development to ensure the credibility and effectiveness of policies. Establish regional environmental regulatory monitoring mechanisms in sections to adjust government ER efforts in a timely manner, Facilitate the advancement of regional GT systems and strengthen the depth of GT systems.
(2) Use ER as a guide for enterprise innovation investment. Enterprises are profit-driven, and their goal is to maximize profits through innovation investment. However, under traditional profit-oriented incentives, companies tend to invest funds in industries that are highly polluting and energy-consuming, which is not conducive to GT. To address this issue, the government should develop scientifically reasonable ER based on regional industrial characteristics and environmental governance pressure. By using external regulatory forces, the government can steer enterprise innovation investment toward green industries, promoting the progress of GT. This approach aims to strike a balance between economic development and environmental governance, ultimately achieving a win-win situation.
(3) Promote enterprise innovation investment. Chinese provincial governments should formulate scientifically reasonable policies to encourage innovation investment, taking into account environmental governance objectives and the stage of economic structural transformation. These policies should guide investment funds from enterprises toward green industries, Consequently, it will invigorate the growth of GT in Chinese provinces. The ultimate goal is to foster green development and achieve high-quality economic growth in these provinces.
Footnotes
Funding
The author(s) disclosed receipt of the following financial support for the research, authorship, and/or publication of this article: The National Social Science Fund of China (24BGL207).
Declaration of Conflicting Interests
The author(s) declared no potential conflicts of interest with respect to the research, authorship, and/or publication of this article.
Data Availability Statement
The datasets used and/or analyzed during the current study are available from the corresponding author on reasonable request.