
Abstract
The innovative use of green credit policy for financial regulation in environmental governance is a significant effort to balance environmental preservation and economic growth. The objective of this paper is to study the effect of green credit on the polluting firms’ eclectic business strategy, which is financialization, and the related mechanisms. Based on the sample of Chinese public firms from 2008 to 2019, we employ the DID model constructed by the Green Credit Guidelines promulgated in 2012 to investigate the causality between green credit policy and firms’ financialization. The results of theoretical and empirical studies show that the green credit policy helps to mitigate the financialization of heavy polluters compared to non-heavily polluting firms, thereby realizing the optimal allocation of financial resources. The mechanism test indicates that green credit policy has a suppressive effect on the financialization level of heavily polluting firms, mainly through promoting green innovation while reducing excess cash and banks’ credit willingness. The heterogeneity test further indicates that green credit policy is more pronounced in SOEs, strong environmental regulation enforcement regions and higher market competition industries. Our study confirms the effectiveness of green credit policies from the perspective of firms’ business strategy, which not only provides empirical evidence for the evaluation of green credit policy effects, but also sheds lights on the green transformation and sustainable development of heavily polluting firms.
Plain language summary
The green credit policy represents a crucial innovation in environmental governance and financial regulation. This study investigates the impact of green credit on the business strategies, particularly financialization, of polluting firms and associated mechanisms. Analyzing data from Chinese non-financial publicly listed firms between 2008 and 2019, we found that the green credit policy notably reduces financial investments in heavily polluting firms compared to non-heavily polluting ones, leading to improved allocation of financial resources. These results hold up under various tests. Mechanism analysis reveals that the green credit policy curbs financialization through promoting green innovation, reducing excess cash, and decreasing banks’ willingness to extend credit for heavily polluting firms. Heterogeneity testing further demonstrates stronger impacts in State-Owned Enterprises (SOEs), regions with stringent environmental regulations enforcement, and industries with higher market competition. This study confirms the effectiveness of these policies in shaping business strategies while providing valuable insights for transforming heavily polluting firms toward greener practices.
Introduction
In September 2020, China pledged that it’s carbon dioxide emissions would peak before 2030 and strive to achieve carbon neutrality by 2060. Since then, how to promote the transformation of polluting industry have received widespread attention. For a long time, the transformation of polluting industry in China has faced with a relatively complex external environment of threats and opportunities, leading to a dilemma in firms’ business strategy. On one hand, Polluting firms are faced with severe threats. For one thing, China’s environmental regulation has become stronger over time. During 2014 to 2018, Chinese government promulgated a series of policy and laws regarding to environmental protection, including the “Environmental Protection Law,” known as the strictest in history, the “Environmental Protection Tax Law,” and the “Regulations on the Implementation of the Environmental Protection Tax Law.” All these greatly strengthened the punishment of environmental violations, aggravated the cost of continuing to expand the production of polluting industries, therefore making the polluting production mode unsustainable.
However, firms in polluting industry are lack of motivation for green transformation and innovation. Firms face great risks and huge costs in transformation, which comes from upgrading polluting equipment, enhancing manpower, fierce competitive pressures, and so on. All these making polluting firm have little incentive to carry out green transformation and innovation. Therefore, it is worth noting that polluting firms still have some advantages and opportunities in accessing financial resources. In Chinese context, banks as the main body of indirect financing dominates the financial system. Banks require collateral to make loans, making it easier for polluting enterprises to obtain bank loans as they have relatively large amounts of machinery and land rather than some small and medium-sized enterprises that lack collateral (Wang et al., 2022). This provides polluting firms in the dilemma with an eclectic choice, which is join in the financialization.
Financialization is a phenomenon in which corporate profits shift from traditional business to financial investment business (Krippner, 2005). To implement financialization, polluting firms can obtain funds through their own credit advantages, and then invest in financialized business, in a disguised way to provide funds for small and medium-sized enterprises which are excluded by finance, so as to obtain profits. In that case, polluting firms do not need to expand polluting production, nor do they need to truly engage in transformation and take risks. However, the financialization in firms has a relatively negative impact on the whole real economy in the long run. For example, the financialization of polluting firms will lead to firm zombification, thus decreased effectiveness in allocating financial resources and slower industrial upgrading (Riccetti et al., 2016; Sokol, 2017).
To solve this problem, the green finance policy was introduced to break the eclectic choice in polluting industries. Green finance pertains to economic endeavors that contribute to environmental enhancement, preventing climate change, and promote the effective utilization of natural resources. It including green credit, green bonds, green investment, green insurance, and carbon emission finance which guide the flow of funds to environmentally-friendly industries and cleaner producers to promote the optimization of industrial and energy structures (Ng, 2018). Since the establishment of green finance policy, the test of policy effect has been widely concerned. Existing research mainly focus on the environmental and innovation perspective. Based on Chinese data, previous studies found that the green finance policy play an important role on green innovation, carbon emissions and environmental quality (Ahmad et al., 2019; Cui et al., 2022; Irfan et al., 2022). Current studies find the policy exert negative effect on R&D investment (D. Zhang & Kong, 2022). This suggests that the economic impacts of green finance are varied, and further exploration is required to thoroughly understand its scope and implications.
This paper takes the promulgate of Green Credit Guidelines (GCG) in China as a quasi-experiment to investigate whether the green finance can break the eclectic choice to restrain financialization in polluting firms. The reason of using GCG as an exogenous shock is that green credit policy plays an important role in green finance system. According to the guideline, banks have to accurately identify, evaluate, oversee, manage, and reduce environmental and social risks in their credit activities (green loans etc) while enhancing their credit policies and processes accordingly. The guidelines also set out specific steps to incorporate environmental risks into credit reviews. Lenders must carefully examine the borrower’s compliance with environmental laws to identify customers with “significant environmental and social risks,” to clarify appropriate approval authority, and to establish separate write-off procedures for “state-defined restrictive industries and industries with significant environmental and social risks.” What’s more, a series of regulation and rules supported by government are impose on banks to ensure the effective of the guideline. The “Regulatory Guidelines for the Performance Evaluation of Banking Financial Institutions” issued by the China Banking Regulatory Commission in 2012 include environmental protection as a key item in the social responsibility index when evaluating the performance of banks. In 2013, China Banking Regulatory Commission issued “Opinions on Green Credit Work” urges regulators and banks at all levels to incorporate the concept of green credit into their daily supervision and operations. In 2018, the People’s Bank of China expanded the range of collateral for the Medium-Term Lending Facility (MLF) to officially include green loans, enabling substantial market incentives for green credit to be implemented nationwide. All these actions have greatly strengthened banks’ willingness to enforce green credit regulations. This makes the green credit policy the most influential policy within the green finance system.
The objectives of this paper are as follows: First, what impact does green finance policy have on firms’ financialization? Second, what are the specific mechanisms? Third, what are the heterogeneous effects? Using data from 2008 to 2019, we found that the green credit policy help to diminish firms’ financial assets investments by limiting the scale of financial investment and investment gains. This result is robust across different estimation methods. The mechanism test shows that the promulgation of Green Credit Guidelines restrains firms’ financialization by improving the green innovations of heavily polluting firms, decreasing excess cash, and reducing credit availability to heavily polluting firms. We also found that this effect has become more prominent among state-owned enterprises, in areas with stronger environmental enforcement, and in highly competitive industries.
Our research has the potential to make significant contributions. Firstly, we assess the influence of green credit policy on firms’ business strategies, a relatively overlooked area. Our findings suggest that green finance implementation disrupts the financialization of polluting firms, facilitating their transformation. Secondly, we clearly establish the link between green finance and firms’ financialization, contributing to a better understanding of green credit policy. Through an investigation of policy mechanisms, this paper offers policy implications for the optimization of future green finance policies. Lastly, our research highlights how environmental enforcement and industry competitiveness affect the relationship between “green finance” and “firm financialization,” urging policymakers to consider these factors when addressing financialization in polluting firms.
The rest of the paper is organized as follows. Literature review is in Section 2. Hypotheses development is in Section 3. The next section offers data source and measurement of related variables and methodology. Section 5 reports the baseline results, robust check, mechanism tests, and cross-sectional tests, respectively. Section 6 contains the discussion and conclusion.
Literature Review
Our research is closely related to two interconnected branches of literature. The first one is the motivations of firms’ financialization. According to the existing research, there are two motivations making firms to implement financialization strategies. One is the risk-averse motive. Under the traditional financial system, the information asymmetry between banks and firms making banks mainly allocate credit through the screening of static characteristics such as enterprises’ financial performance and collateral assets, leading to an obvious credit mismatch. The financial mismatch making firms facing the risk of uncertain financing availability in the future production and operation process (Gomber et al., 2017). In order to cope with this, firms tend to hold internal cash in the form of financial assets as “precautionary savings” (Demir, 2009). Another one is the “profit-seeking” motive. With the widening gap between the return on real and financial investments, firms incline to reduce their real investments and shift to financial investments with higher yields to maximizing short-term interests (Orhangazi, 2008).
Another strand of literature is the policy effectiveness evaluation of green finance policy in China. Green credit is a financing method that integrates environmental protection into the bank credit process. Unlike traditional bank credit, green loans regulaton requires banks to thoroughly assess the environmental practices of businesses when granting loans and to closely monitor fund usage at each stage of the enterprise (B. Li et al., 2023; D. Zhang & Kong, 2022). In 2012, China introduced the GCG, which offer specific operational guidance for green credit activities across different banks, establishing a solid foundation for the advancement of green finance in China. The issuance of the GCG presents a valuable quasi-natural experiment for related studies.
At the micro level, the economic impact of green credit is primarily focused on the green transformation of polluting firms and corporate performance. Unlike the command-and-control approach, green credit can contribute to environmental governance by guiding capital allocation (Zhao et al., 2023). Green credit is effective in reducing pollutants discharged by polluting firms. The internalization of negative externalities raises the cost of pollution for enterprises through credit channels, thereby compelling enterprises to adopt environmentally friendly practices, such as stimulating green innovation (Hu et al., 2021; Irfan et al., 2022; Tan et al., 2022), reducing pollutants emission (Lin & Pan, 2023; Su, Umar & Gao, 2022; A. Zhang et al., 2022), and increasing the exit rate of highly polluting firms (D. Zhang et al., 2019). Furthermore, the green credit policy significantly enhances the risk-taking capacity (Al-Qudah et al., 2023), production efficiency (Lv et al., 2023) and labor investment efficiency (Liu et al., 2023) of enterprises, thereby improving the company’s overall performance (W. Li et al., 2023). Moreover, Tan et al. (2022) find the Green Credit Guidelines could strengthen the peer effect of green innovation in non-high energy intensity and overcapacity industries.
From the macro perspective, the prominent research primarily examines the impact of green credit on macro-level environmental governance and its influence on economic growth. Current literature believes that the implementation of green credit can effectively improve environmental quality (Hou et al., 2023; Su, Li, Umar, & Lobont, 2022; Umar & Safi, 2023). Based on Granger causality test, Su, Li, Umar, & Lobont (2022) found that the effect of green credit on environmental improvement depends on a more comprehensive policy and the joint efforts of banking institutions and enterprises. Hou et al. (2023) discovered that the impact of green credit exhibits regional variability, with a more pronounced policy effect observed in the eastern region compared to the central and western regions. Umar and Safi (2023) find that green credit is an effect tools to reduces carbon emissions in OECD countries. For the aspect of economic growth, there is no uniform research conclusion. Most of the studies believe that green credit can optimize the industrial structure (Zhu, 2022) and promote the advancement of green technology (Lv et al., 2023), thereby fostering economic development (Guo et al., 2022; Han et al., 2023; Yin & Xu, 2022). Few of the studies drew the conclusions that green credit policy has a negative or nonlinear impact on economic growth (Wu et al., 2022).
To sum up, previous research explores the economic consequence of green finance in different perspectives and find opposite results, indicating that the mechanism of green finance policy needs further study. Among those, few research provided empirical evidence on the impact of the green credit policy on heavily polluting firm’s financial assets holdings in China, which is still worth exploring.
Research Hypothesis
The promulgation of Green Credit Guidelines drives banks to support green development through a variety of loan terms, interest rates, and quotas. While banks impose restrictions on lending to industries with high pollution, high energy consumption, and overcapacity, they are also incentivized to offer financial assistance for the eco-friendly transformation of enterprises. This enables banks to regulate the economy and foster a sustainable economic framework aligned with ecological civilization. We think that the Green Credit Guidelines could influence the financial investment of companies through the following three mechanism.
Firstly, the green credit policy implementation has greatly affected environmentally harmful companies’ finance accessibility. It has made green transformation and innovation the preferred solution, thereby promoting green innovation and restraining the financialization of polluting firms. The policy signals the government’s continuous support for green development while restraining high-emission and high-pollution industries. This ongoing progress has made it clear to polluting firms that environmental policy is not temporary, posing a significant threat to their operations and emphasizing the necessity of green innovation and transformation. Additionally, the policy effectively regulates the allocation of credit resources, stimulating incentives for green innovation. Polluting firms require a long-term treatment mechanism to improve their environmental performance and offset the negative impact of rising costs due to environmental regulations on their survival and development (He et al., 2022). According to Porter’s theory, technological innovation, as the choice of an organization under the pressure of reasonable environmental regulation, can have a “compensation for innovation” effect and help enterprises achieve environmental and economic win-win goals (van Leeuwen & Mohnen, 2017). Moreover, the “environmental image” optimized with the advancement of green innovation of enterprises will improve their relationship with investors, consumers, and other stakeholders, helping them to obtain key resources and “reputation premium.” Furthermore, the apparent preference and certainty of green credit policy can also greatly reduce the uncertainty of green innovation and provide polluting firms with timely market information on technological improvements, thus prompting them to actively engage in green innovation (D. Zhang & Kong, 2022). In this context, the polluting firms will be inclined to invest more in environmental expenditure while decreasing the firm’s financialization.
Secondly, the green credit policy may restrain financial investment by reducing excess cash through the corporate governance mechanism. According to Meckling and Jensen (1976), cash is the most vulnerable asset to embezzlement and a tool for management to gain personal gain. To maximize their own interests, management tends to hold excess cash at the expense of shareholders’ interests. Moreover, previous studies have also found that excess cash will trigger financialization (Orhangazi, 2008). The promulgation of Green Credit Guidelines asks banks to strengthen supervision in the lending business, bridging the information asymmetry between firms and banks, thereby enhancing corporate governance in polluting firms (S. Zhang et al., 2022). Furthermore, the improvement in corporate governance will constrain executives’ profit-seeking motivation, leading to a decrease in excess cash among polluting firms, thus restraining firms’ financialization.
Thirdly, green credit policies can curb firms’ financialization by reducing the banks’ willingness to supply loans, thereby weakening the credit advantage of polluting firms. According to the Green Credit Guideline, the development of green credit business has become an important part of banks’ assessment. The guidelines require banks to generate positive externalities in the process of credit resource allocation. Specifically, green credit policy requires banks to penalize polluting firms with loan suspension and recovery. Consequently, the willingness to supply loans to heavily polluting enterprises will be reduced among banks. As a result, polluting firms lose their advantage in credit access, thus lacking sufficient funds to engage in financialization activities.
Based on the above discussion, the following hypotheses are proposed.
Hypothesis1: The promulgate of GCG will decrease firms financialization.
Hypothesis 2: The promulgate of GCG curbs financialization of heavily polluting enterprises by increasing green innovation.
Hypothesis 3: The promulgate of GCG curbs financialization of heavily polluting enterprises by reducing excess cash.
Hypothesis 4: The promulgate of GCG curbs financialization of heavily polluting enterprises by reducing the banks’ willingness to supply loan.
Methodology
Data Sources
The 2012 Guidelines, as the initial regulatory document for green credit, represented a significant advancement in establishing standardized and legal frameworks for the development of green credit. Considering the timeframe and data availability, this study focuses on Chinese A-share listed companies in Shanghai Exchange and Shenzhen Exchange from 2008 to 2019. The following measures were taken: (i) excluding financial insurance companies and real estate industry A-share listed firms; (ii) removing companies with abnormal trading statuses like ST, *ST, and PT; (iii) eliminating companies with clearly abnormal operating conditions such as asset-liability balance ratios outside the range of 0 to 1 or zero operating income and costs; and (iv) excluding companies with substantial missing data. To mitigate the impact of extreme values, continuous variables were truncated at the 1st and 99th percentiles. Firm’s financial data and green innovation data was obtained from the CSMAR (China Stock Market & Accounting Research) and the CNRDS (China Research Data Service) database, respectively. Provincial-level data was collected from both the China Statistical Yearbook.
Measure of Firm’s Financial Investment
The first proxy variable is measured by the share of financial investment to total assets, which indicates the nature of firm’s financial investment behavior. Following C. Zhang and Zheng (2020) The variable is defined as follow, FinI1 = (held-to-maturity investments+ financial assets available for trading + investment real estate + financial assets available for sale + dividend receivable + interest available)/total assets. We also measure financialization from the perspective of gain from financial investment. It is defined as follow, FinI2 = (Financial Investment income, gain or loss on fair value changes and other comprehensive income)/Earnings before interest and taxes.
Green Credit Guidelines
To promote the development of green credit by banking financial institutions, the China Banking Regulatory Commission (CBRC) formulated the Green Credit Guidelines (GCG). The guidelines were issued on 24 February in 2012. The guidelines consist of general provisions, organization and management, policies and systems, capacity building, process management, internal control management, information disclosure, supervision and inspection. It includes 7 chapters and 30 articles of supplementary provisions. Village banks, loan companies, rural mutual aid societies and non-bank financial institutions shall be implemented with reference to these guidelines. The CBRC shall be responsible for the interpretation of these guidelines. The guidelines require banks promote green credit from a strategic height, increase support for green economy, low-carbon economy and circular economy, prevent environmental and social risks, improve their own environmental and social performance, and thus optimize the credit structure, improve the level of service, and promote the transformation of development mode.
Identification Strategy
To quantitatively assess the impact of green credit policies on the financialization of heavily polluting firms, an empirical analysis was conducted using a fixed-effects difference-in-difference model. According to Yao et al. (2021), we distinguish between the experimental companies and the control companies based on the environmental attributes of the sectors. The 2010 issuance of the Guidelines for Environmental Information Disclosure of Listed Companies (Draft for Seeking Feedback) categorized 16 sectors as heavily polluting industries, including electrolytic aluminum, tanning, and others. The specific model for the analysis is below.
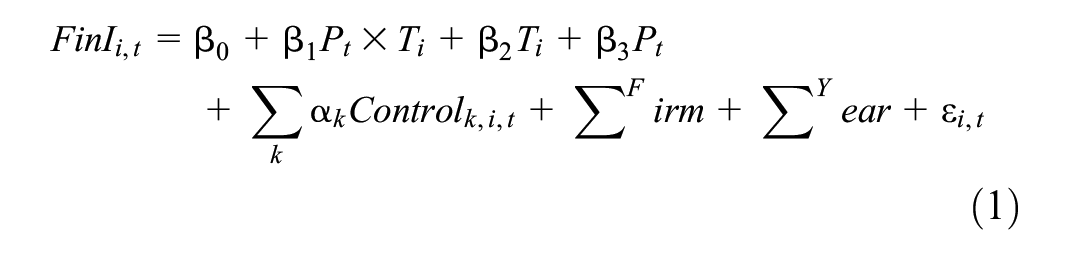
Where FinI is the proxies of firms’ financial investments, which included FinI1and FinI2, respectively. Subscripts i and t denote firm i at year t. We create a time indicator variable P which takes the value of 1 for the years 2012 and beyond, and 0 for years before 2012. The sample are categorized into two groups according to their industry characteristics. Companies operating in highly polluting sectors are assigned to the treatment group (T = 1), whereas those in other different industries are included in the control group (T = 0). We also add several control variables in our model following the relevant studies, the descriptions for these variables are located in Appendix 1.
Empirical Analyses
Summary Statistics
Table 1 reports the summary statistics of all variables in our regression model. The average values for FinI1 and FinI2 are 0.2452 and 0.1013, respectively. The standard deviation (SD) values are 0.1404 and 0.3041, indicating substantial differences in the dependent variables among the sampled firms. The mean of T is 0.3410, suggesting that the treated group represents 34.10% of the total sample size. To assess multicollinearity between variables, a VIF test was conducted with results presented in the last column of Table 1, indicating no issues of multicollinearity in our regression.
Summary Statistics.

Baseline Results
Table 2 provides the findings of the regression analysis regarding the impact of green credit guidelines in 2012 on the financialization of firms. Results in column (1) and (2) presents the impact of Green Credit Policy on firms’ financial investment scale, while results in column (3) and (4) presents the relation between green credit policy and firms’ financial investment gain, respectively. According to column (1) and column (2), the coefficients of interaction term T×P are −0.022 and −0.014, and are both significant. Indicating that the promulgate of Green Credit Policy significantly reduce the scale of financial investment in heavily polluting firms compared to the firms in other industries. According to results in column (3) and column (4), the coefficient of interaction term T×P are both −0.061, significant at 1%, which means green credit policy significantly mitigate the financialization from the perspective of financial investment income among heavily polluting firms. Hypothesis 1 is supported by these results.
Green Credit Policy and Firm’s Financialization.

Note. The definitions of variables can be found in Appendix 1. A DID model has been used to explore the relation between green credit policy and firm’s financialization. The numbers in parentheses represent t statistics; *, **, and *** signify confidence levels of 10%, 5%, and 1%, respectively. Firm and Year fixed effects are controlled in all regressions.
Robustness Check
Parallel Trend Test
The DID estimation’s identification assumption necessitates that the treated and control groups display comparable trends in firm financial investments before the introduction of green credit guidelines in 2012, barring other external shocks. If this parallel trend assumption isn’t fulfilled, the DID estimation results are biased. According to relevant literature (Serfling, 2016; Yao et al., 2021), we create six new dummy variables, Post(−3), Post(−2), Post(−1), Post(1), Post(2), and Post(3). The variable Post(−3) represents the green credit policy being in place 3 years prior, that is, it is set to 1 in 2009 and later, and 0 before 2009. The other dummy variables are constructed in same way. We then construct interaction terms PreT3, PreT2, PreT1, PostT3, PostT2, and PostT1 by multiplying these new dummy variables with T. Adding these interaction terms to DID Model in Equation 1 allows us to identify if a parallel trend exists between treated and control groups before 2012 based on the significance of PreT3, PreT2, and PreT1. The findings presented in Table 3 demonstrate that the coefficients of T×P hold significant negative. However, the coefficients of PreT3, PreT2, and PreT1 are insignificant. Additionally, we provide an interpretation of these coefficients in Figure 1. It proves to be a parallel trend in the DID estimations. The impact of the Guidelines was consistently negative in the years following their implementation. Although the policy’s impact weakened briefly in 2013 and 2014, it quickly recovered, confirming the significant inhibitory effect of green credit policies on the financial asset allocation behavior of heavily polluting enterprises.
Robustness Test: Parallel Trend Test.
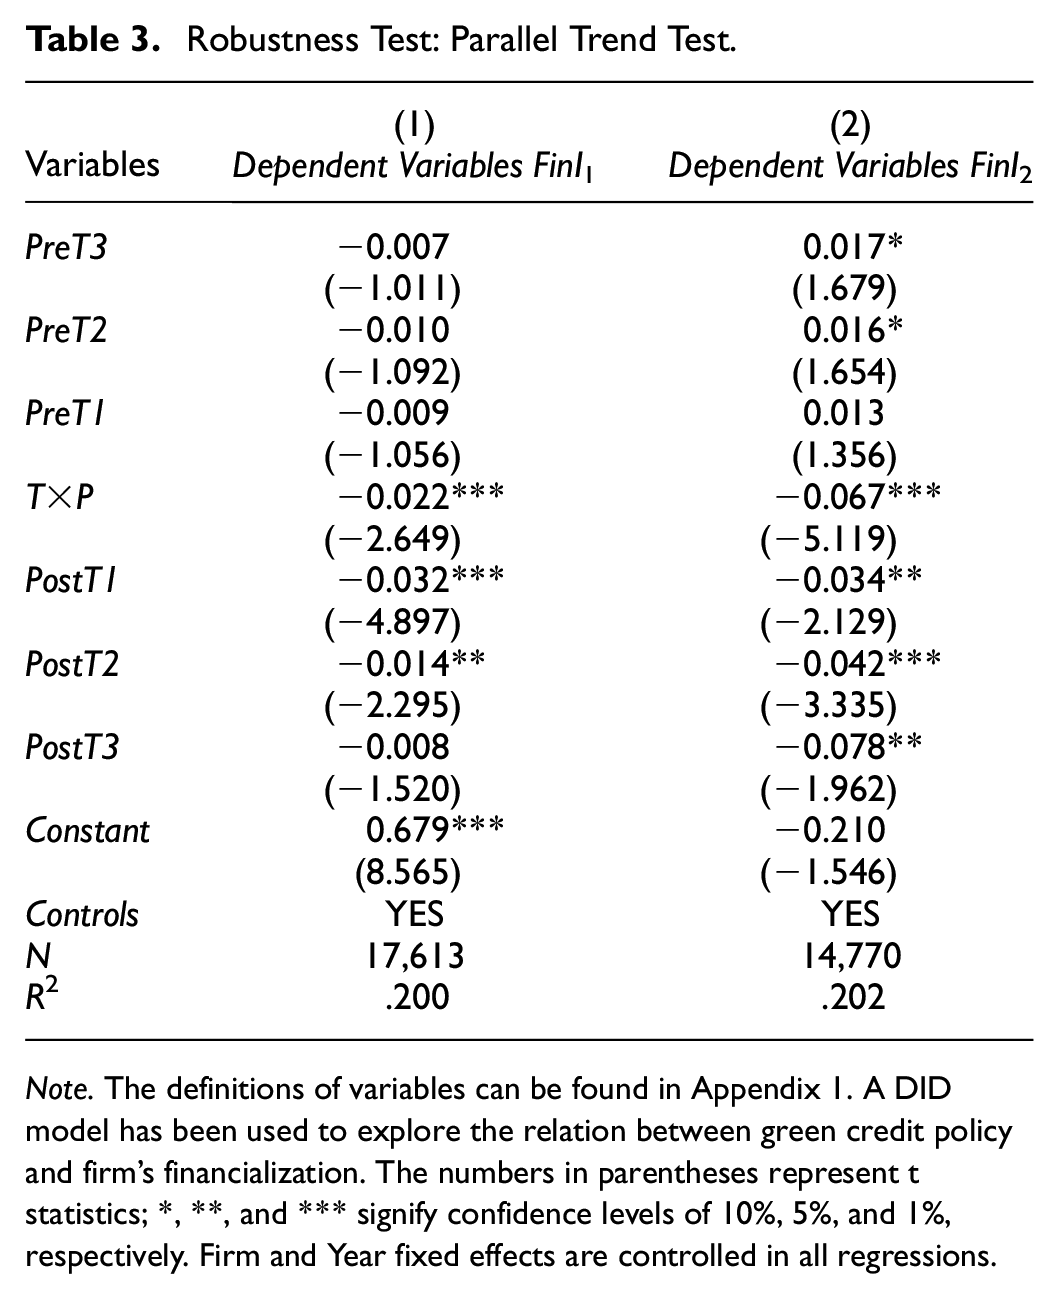
Note. The definitions of variables can be found in Appendix 1. A DID model has been used to explore the relation between green credit policy and firm’s financialization. The numbers in parentheses represent t statistics; *, **, and *** signify confidence levels of 10%, 5%, and 1%, respectively. Firm and Year fixed effects are controlled in all regressions.
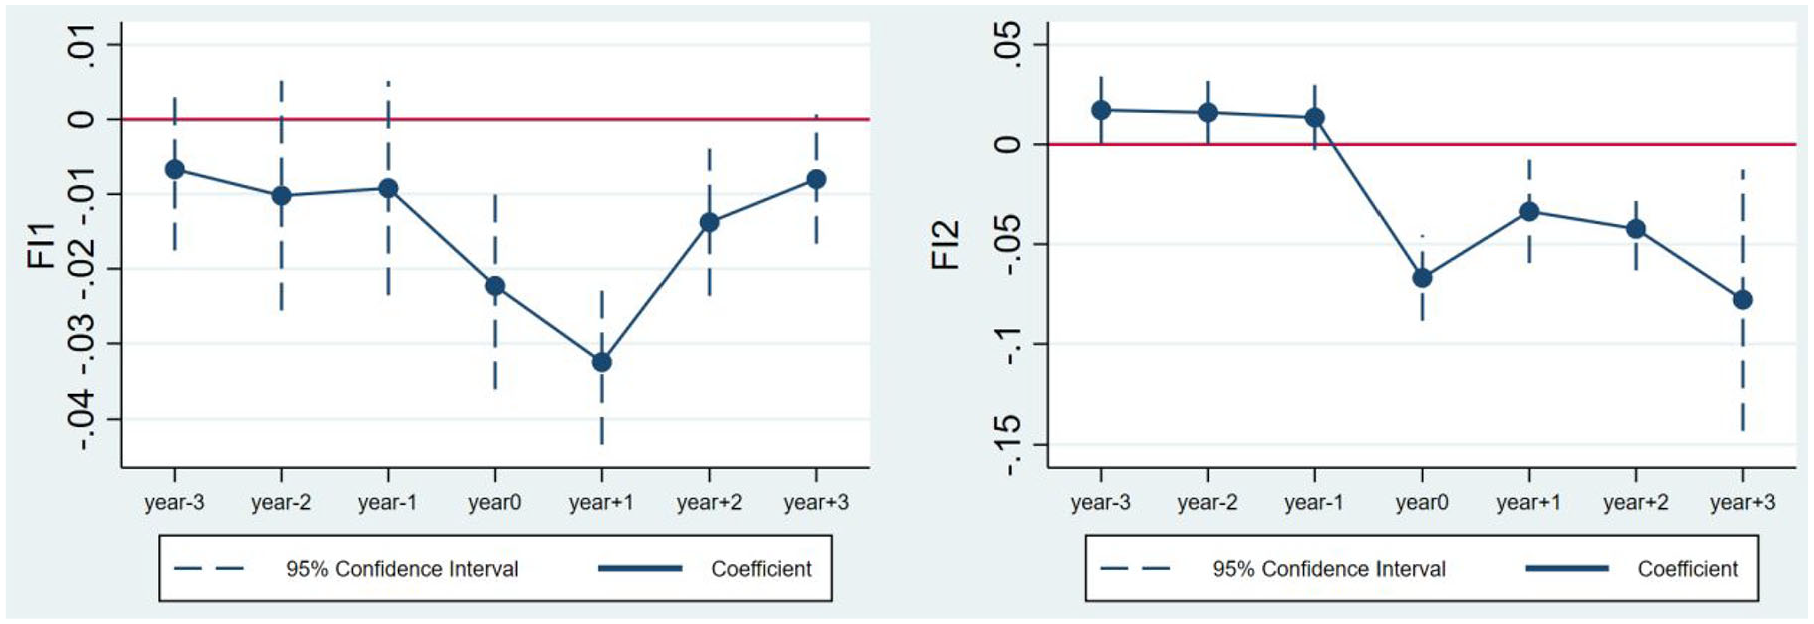
Figures for parallel trend test.
PSM-DID
According to Hu et al. (2021), we adopt PSM-DID (Propensity Score Matching-Difference in Difference) to address sample selection bias. Our PSM-DID model involved two nearest-neighbor matching approaches: a standard one-to-one and a four-to-one nearest-neighbor estimator based on the propensity score (Rosenbaum & Rubin, 1983). The results are shown in Table 4. The results in column (1) and (2) presents the impact of Green Credit Policy on firms’ financial investment scale, while results in column (3) and (4) presents the impact of Green Credit Policy on firms’ financial investment gain, respectively. The results in column (1) and column (2) are based on one-to-one nearest-neighbor, while column (3) and column (4) are based on four-to-one nearest-neighbor. The coefficients of interaction term T×P among column (1) to (4) are significantly negative, which is similar with the results Table 2, indicating that the baseline results are robust.
Robustness Test: PSM-DID.
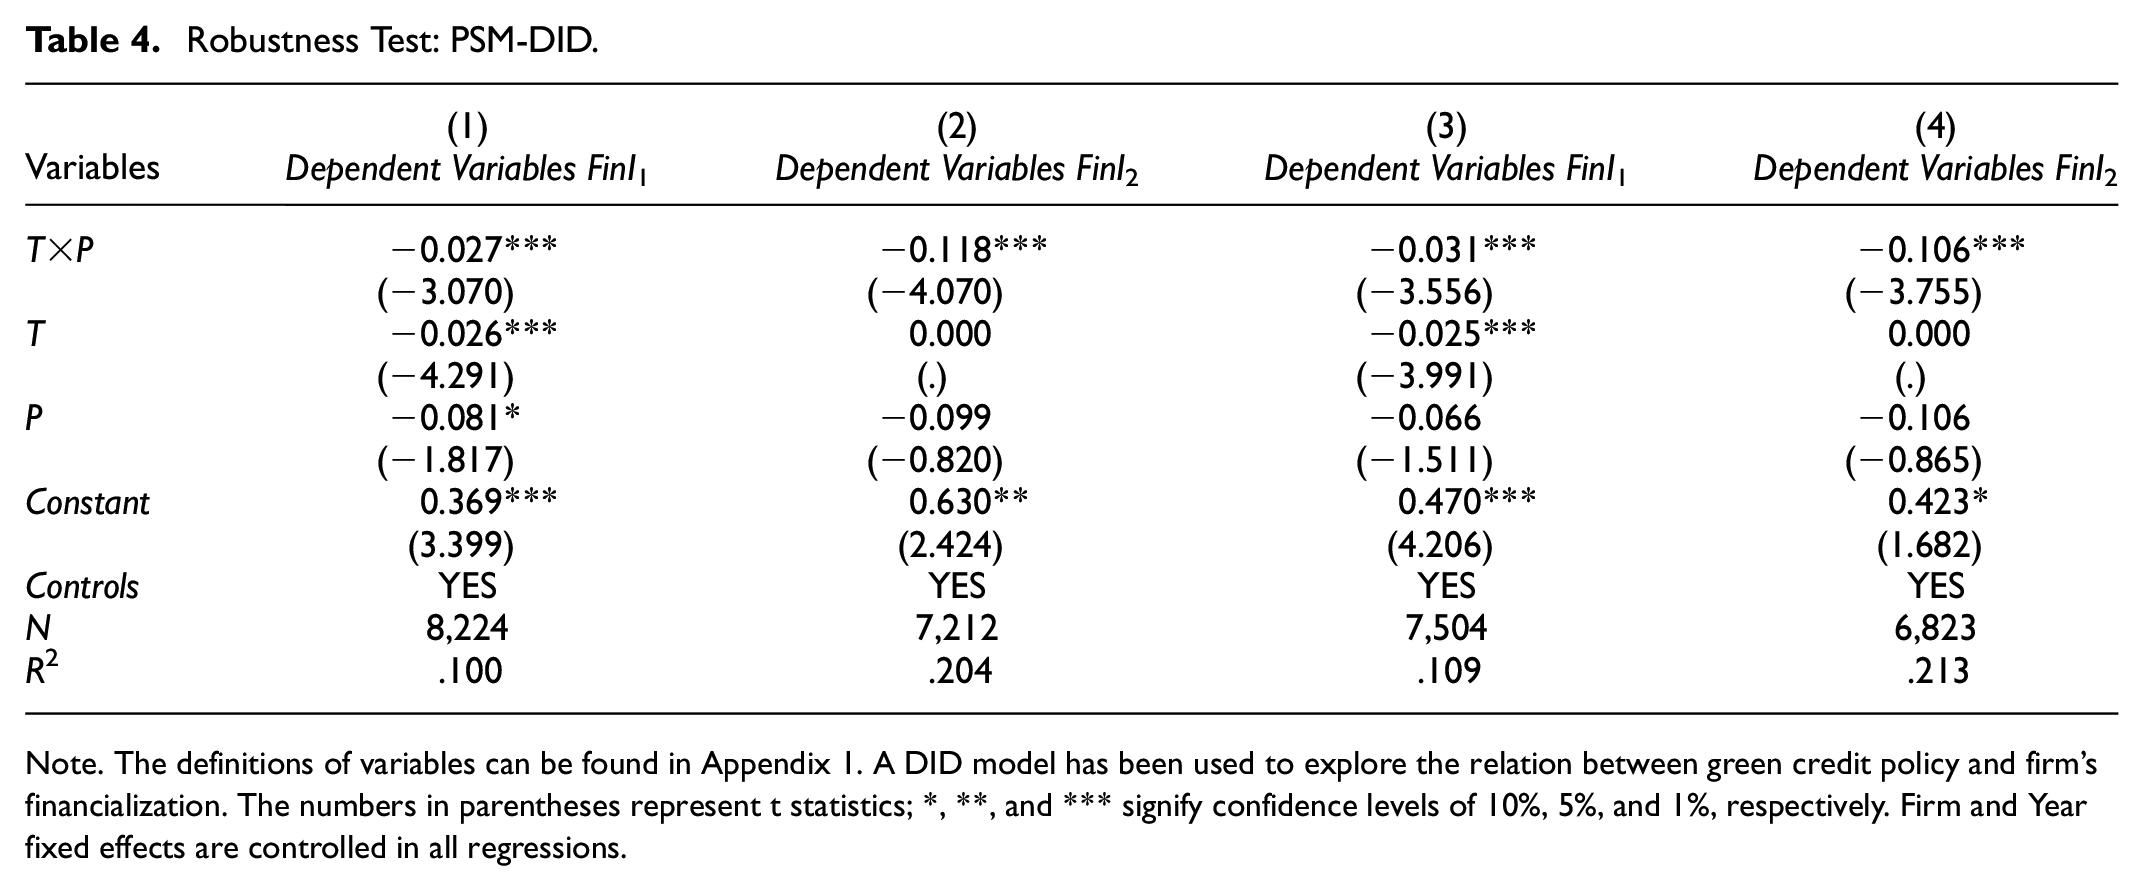
Note. The definitions of variables can be found in Appendix 1. A DID model has been used to explore the relation between green credit policy and firm’s financialization. The numbers in parentheses represent t statistics; *, **, and *** signify confidence levels of 10%, 5%, and 1%, respectively. Firm and Year fixed effects are controlled in all regressions.
Changing the Grouping Variable
As the GCG did not entirely correspond with the CSRC’s Industry Classification (2012) due to certain heavily polluting industries, we followed the approach of Hu et al. (2021) and Yao et al. (2021) to the intensity of pollution emissions for each sector. This recalibration considered four types of pollution emissions: sulfur dioxide, industrial soot (dust), industrial solid waste, and industrial wastewater. Subsequently, we adjusted the treated group and the control group criteria according to the median pollution emission intensity. For detailed information on how we calculated pollution emission intensity, please refer to Hu et al. (2021) and Yao et al. (2021). Table 5 reports the results. Results in column (1) presents the impact of Green Credit Policy on firms’ financial investment scale, while results in column (2) presents the impact of Green Credit Policy on firms’ financial investment gain, respectively. According to the results in column (1) and (2), all of the coefficients of T×P are significantly negative, which remain largely consistent, affirming the robustness of the baseline results.
Robustness Test: Alternative Proxies for Heavily Polluting Industries.

Note. This table reports results after changing the proxy for heavily polluting industries. The definitions of variables can be found in Appendix 1. A DID model has been used to explore the relation between green credit policy and firm’s financialization. The numbers in parentheses represent t statistics; *, **, and *** signify confidence levels of 10%, 5%, and 1%, respectively. Firm and Year fixed effects are controlled in all regressions.
Placebo Test
The decrease in financial investments in heavily polluting firms could potentially be influenced by unobserved omitted variables related to timing. In order to tackle this issue, we carried out a placebo test to determine causality using the methodology outlined by Cheng et al. (2021) and Yao et al. (2021). We adjusted the implementation year of the Green Credit Guide policy earlier by 2 years (to 2010) and then reassessed our regression results. Table 6 presents the results. Results in column (1) presents the linkage between green credit policy and firms’ financial investment scale, while results in column (2) presents the relation between green credit policy and firms’ financial investment gain, respectively. According to the results in Table 6, the coefficients of T×P are both insignificant. This result indicates that our baseline results are not accidental and are not confounded by other time-related unobserved omitted variables. These results validate our previous findings about the impact of the green credit policy on firms’ financial investments.
Robustness Test: Placebo Test.
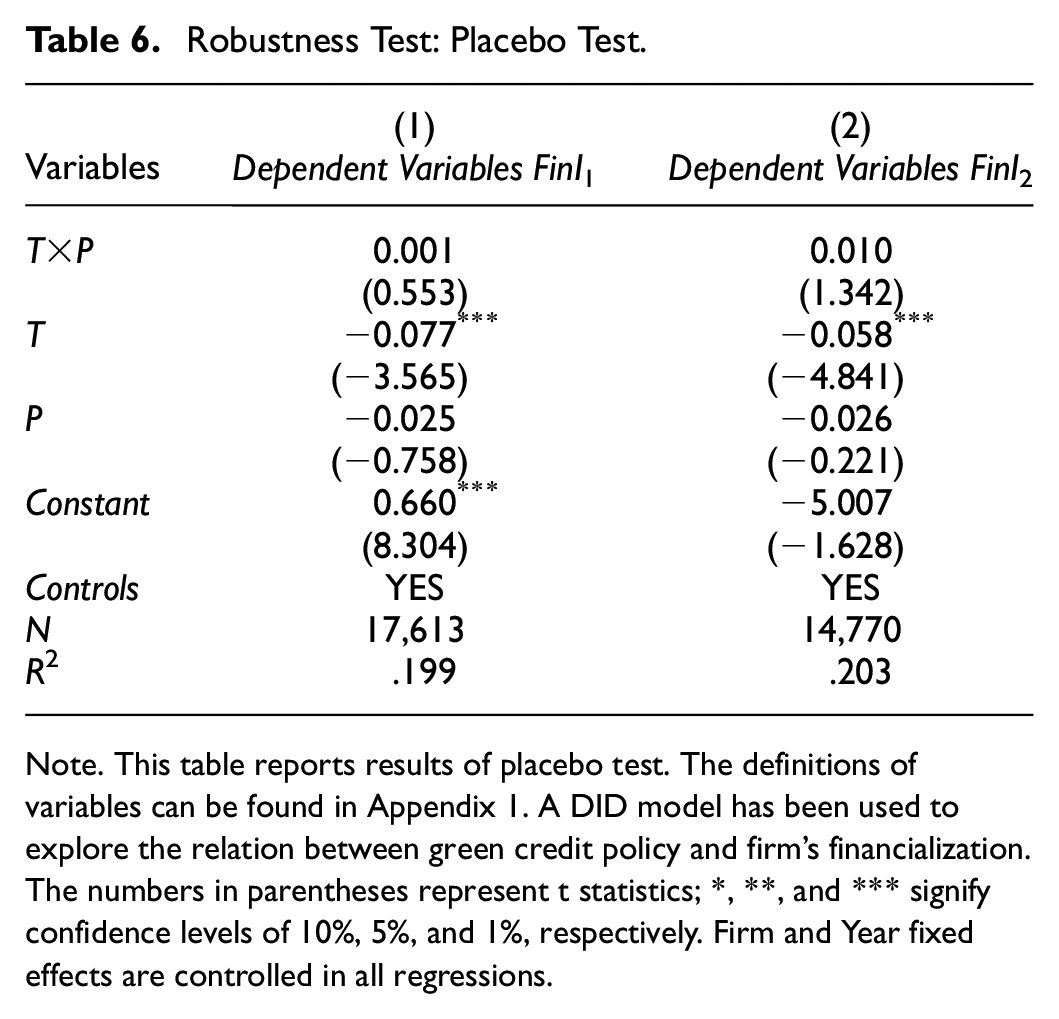
Note. This table reports results of placebo test. The definitions of variables can be found in Appendix 1. A DID model has been used to explore the relation between green credit policy and firm’s financialization. The numbers in parentheses represent t statistics; *, **, and *** signify confidence levels of 10%, 5%, and 1%, respectively. Firm and Year fixed effects are controlled in all regressions.
Controlling for Alternative Explanations
In April 2018, China announced “New Regulations on Asset Management,” which is designed to curtail firms’ financialization activity and reduce systemic risks. This regulation might decrease the firms’ financialization significantly. To rule out this effect, we add interaction term T×Post2018 to the baseline regression model. Post2018 is dummy variable that equals to 1 if the sample time is after 2018 while 0 before 2018. The results are shown in Table 7. Results in column (1) presents the impact of Green Credit Policy on firms’ financial investment scale, while results in column (2) presents the impact of Green Credit Policy on firms’ financial investment gain, respectively. According to the results in Table 7, The coefficients of T×P remain significantly negative both in column (1) and column (2). These results show that our findings are robust after controlling the Alternative Explanations.
Robustness Test: Controlling for Alternative Explanations.
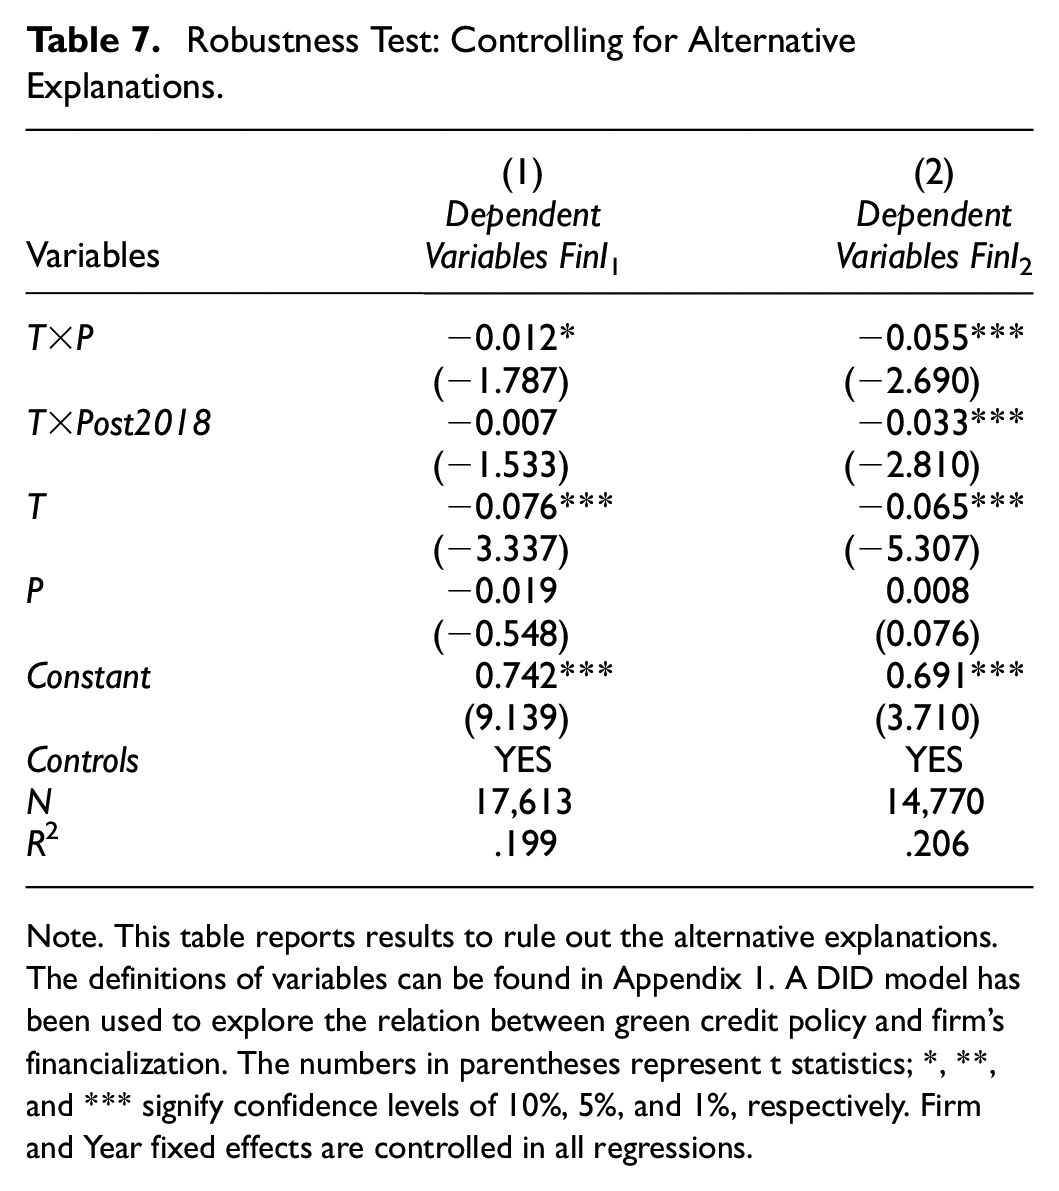
Note. This table reports results to rule out the alternative explanations. The definitions of variables can be found in Appendix 1. A DID model has been used to explore the relation between green credit policy and firm’s financialization. The numbers in parentheses represent t statistics; *, **, and *** signify confidence levels of 10%, 5%, and 1%, respectively. Firm and Year fixed effects are controlled in all regressions.
Mechanism Analyses
What is the possible process through which green credit policy influence the firms’ financialization of? According to the hypothesis development, the green credit policy is expected to impact companies’ financial investments through three main channels: green innovation, corporate governance, and banks’ willingness to provide loans.
Firstly, we aim to explore the channels of green innovation by substituting our response variable (FinI) with the quantity of green inventions (GI) to examine whether the introduction of Green Credit Guidelines will enhance companies’ green innovation. Here, GI is defined as natural log of a firm’s green invention number plus one. The result in Table 8 column (1) shows the coefficient of T×P is significantly positive at 1% level, which means green credit guidelines will improve green innovations of heavily polluting firms, supporting hypothesis 2. This result indicating that, in response to the pressure of green credit policies, heavily polluting firms need to invest significantly in technological innovation to enhance their environmental performance and production efficiency. This shift in strategy may lead to a reallocation of capital between financial investment and R&D (D. Zhang & Kong, 2022), ultimately inhibiting the level of financialization of enterprises.
Mechanism Analysis.

Note. This table reports results of the influence of green credit policy on green innovations, excess cash and banks’ loan willingness. The definitions of variables can be found in Appendix 1. A DID model has been used to explore the relation between green credit policy and firm’s financialization. The numbers in parentheses represent t statistics; *, **, and *** signify confidence levels of 10%, 5%, and 1%, respectively. Firm and Year fixed effects are controlled in all regressions.
Secondly, we examine the corporate governance mechanism by substituting our outcome variables (FinI) with excess cash (EC). Following Opler et al. (1999), EC is calculated as (cash- the optimal estimated cash)/lagged total assets. The detail definition of EC can be found in Chen et al. (2016). The results are shown in Table 8 column (2). According to the results in Table 8 column (2), the coefficient of T×P is significantly negative at 1% level, which means negative relation between green credit policy and excess cash of heavily polluting firms, supporting hypothesis 3. As important creditors, banks play a crucial role in creditor governance. Banks that issue green loans closely monitor the cash holding behavior of enterprises to alleviate excessive cash holdings. These excessive cash holdings often formed by executive managers to avoid R&D risks, which can exacerbate financial speculation by executive managers. The negative relation between green credit policy and excess cash means the banks exert external governance on the heavily polluting firms.
Thirdly, we test the channel of bank credit willingness by substituting our dependent variables (FinI) with loan willingness (LW). According to Cheng (2021), we use the size of corporate credit to reflect banks’ willingness to supply loan. Specifically, loan willingness (LW)is portrayed as the share of short-term borrowing and long-term borrowing to total assets. Results are shown in Table 8 column (3), Results in Table 8 shows that the coefficient of T×P are significantly negative at 5% level, indicating that the introduction of green credit policy significantly reduces the credit availability to heavily polluting firms, supporting hypothesis 4. The green credit policy requires banks to assess and monitor lenders’ environmental performance in the whole process (W. Li et al., 2023). A heavily polluting company’s access to loans are difficult unless they offer solid evidence of green transition. If a firm’s activities do not align with the environmental regulations in their area, the bank providing loans could immediately suspend lending. Before the implementation of the green credit guidelines, bank loans were a significant source of financial investment for polluting companies. After the policy, this source is cut as the results in column (3) in Table 8.
Cross-Sectional Analyses
SOEs Versus Non-SOEs
Credit policies have diverse effects on companies with different attributes (Dong et al., 2021). Financial institutions exhibit clear preferences when evaluating credit. State-owned enterprises (SOEs) benefit from government assurances and are subject to government oversight and policy compliance, failure of which may result in harsh penalties, unlike non-SOEs. As a result, state-owned enterprises that heavily pollute are subject to stricter penalties following the introduction of the GCG in 2012. Based on the findings presented in Table 9 and Figure 2, the coefficient for T×P in column (1) demonstrates a significant negative effect at the 5% significance level. However, in column (2), the coefficient for T×P is not statistically significant. We can see similar results in column (3) and (4), indicating that the 2012 GCG primarily impact the allocation of financial assets and investment income for state-owned enterprises. Furthermore, we can draw the conclusion that heavily polluting SOEs cannot obtain credit line as easily as before. The insignificant coefficients of T×P also implicate that heavily polluting non-SOEs are difficult to access to bank loan even before the Green Credit Guidelines issued in 2012. A possible explanation for the more prominent effect in SOEs is the party committees in SOEs are more able to grasp the policy direction.
Cross-Sectional Analyses: SOEs Versus Non-SOEs.

Note. This table reports the results of influence of green credit guidelines on firm financial investments: SOEs versus non-SOEs. The definitions of variables can be found in Appendix 1. A DID model has been used to explore the relation between green credit policy and firm’s financialization. The numbers in parentheses represent t statistics; *, **, and *** signify confidence levels of 10%, 5%, and 1%, respectively. Firm and Year fixed effects are controlled in all regressions. The final row shows the p-values from the chi-square test, indicating differences in the T×P coefficients between the two subgroups.

Comparison plots to the heterogeneity analysis.
Strong or Weak Enforcement
The effect of green credit policy on polluting firms depends on both the behavioral response of firms and the implementation enforcement of the policy (Zhang et al., 2011). The stronger the regional environmental regulation enforcement, the better the policy implementation effect. Stronger implementation enforcement will make polluting firms more active in green innovation rather than financialization. Thus, we suggest that the impact of green credit policies on restraining the financialization of polluting firms is more significant in regions where implementation enforcement is strong compared to areas with weak enforcement. We divide our sample into strong environmental enforcement province and weak environmental enforcement province based on the median sewage charges of each province. The larger the sewage fee, the higher strength of province environmental enforcement. Results are shown in Table 10. We also draw the comparison plots of coefficient in Figure 2. According to the findings presented in Table 10, the T×P coefficient is significantly negative at the 1% level in column (1), whereas it is not statistically significant in column (2). Similar results can be found in column (3) and (4). The coefficient comparison plot in Figure 2 also supports this result. All these taken together, we can conclude that the effect of the GCG is more significant in the stronger environmental implementation enforcement areas. What is more, the absolute values of interaction term T×P in Table 10 column (1) and (3) are larger than that in baseline results, indicating that the stronger enforcement will enhance green credit policy’s impact on firm’s financialization.
Cross-Sectional Analyses: Strong or Weak Enforcement.

Note. This table reports the results of influence of green credit guidelines on firms’ financialization between Strong or Weak enforcement areas. The definitions of variables can be found in Appendix 1. A DID model has been used to explore the relation between green credit policy and firm’s financialization. The numbers in parentheses represent t statistics; *, **, and *** signify confidence levels of 10%, 5%, and 1%, respectively. Firm and Year fixed effects are controlled in all regressions. The final row shows the p-values from the chi-square test, indicating differences in the T×P coefficients between the two subgroups.
Market Competition
The market competition status will influence the policy effectiveness of Green Credit Guidelines on polluting firms. For instance, after the promulgate of the green credit policy, companies in competitive industries may prioritize promoting firms’ green transformation as they facing intensified financing constraints (Yao et al., 2021). This could compel companies to boost their R&D investment to stay competitive rather than engaged in financial investment. However, monopolistic industries are often faced with soft financing constraint (D. Zhang et al., 2019), making the effect of green credit policy relatively weaken. This part we use the Herfindahl index of the firm’s industry as a proxy variable for industry competition; the smaller the index, the more competitive the industry. The sample is divided into a high competition group and a low competition group based on the median of Herfindahl Index. The results are reported in Table 11. We also draw the comparison plots of coefficient in Figure 2. According to the results in Table 11, the coefficients of T×P in the subsamples with high competition are all significantly negative, while the T×P coefficients for the subsamples with low competition are not statistically significant. The coefficient comparison plot in Figure 2 also supports this result. This result imply that the negative impact of green credit policy on firms’ financialization is more pronounced for firms in highly competitive industries. From the perspective of resource allocation, firms need to allocate all resources rationally in order to survive and develop. The promulgate of GCG making heavily polluting firms can only obtain financial support through green transformation. In this context, enterprises in highly competitive industries are more sensitive to policy responses, making it an inevitable choice to reduce the holding of financial assets.
Cross-Sectional Analyses: High or Low Competition.
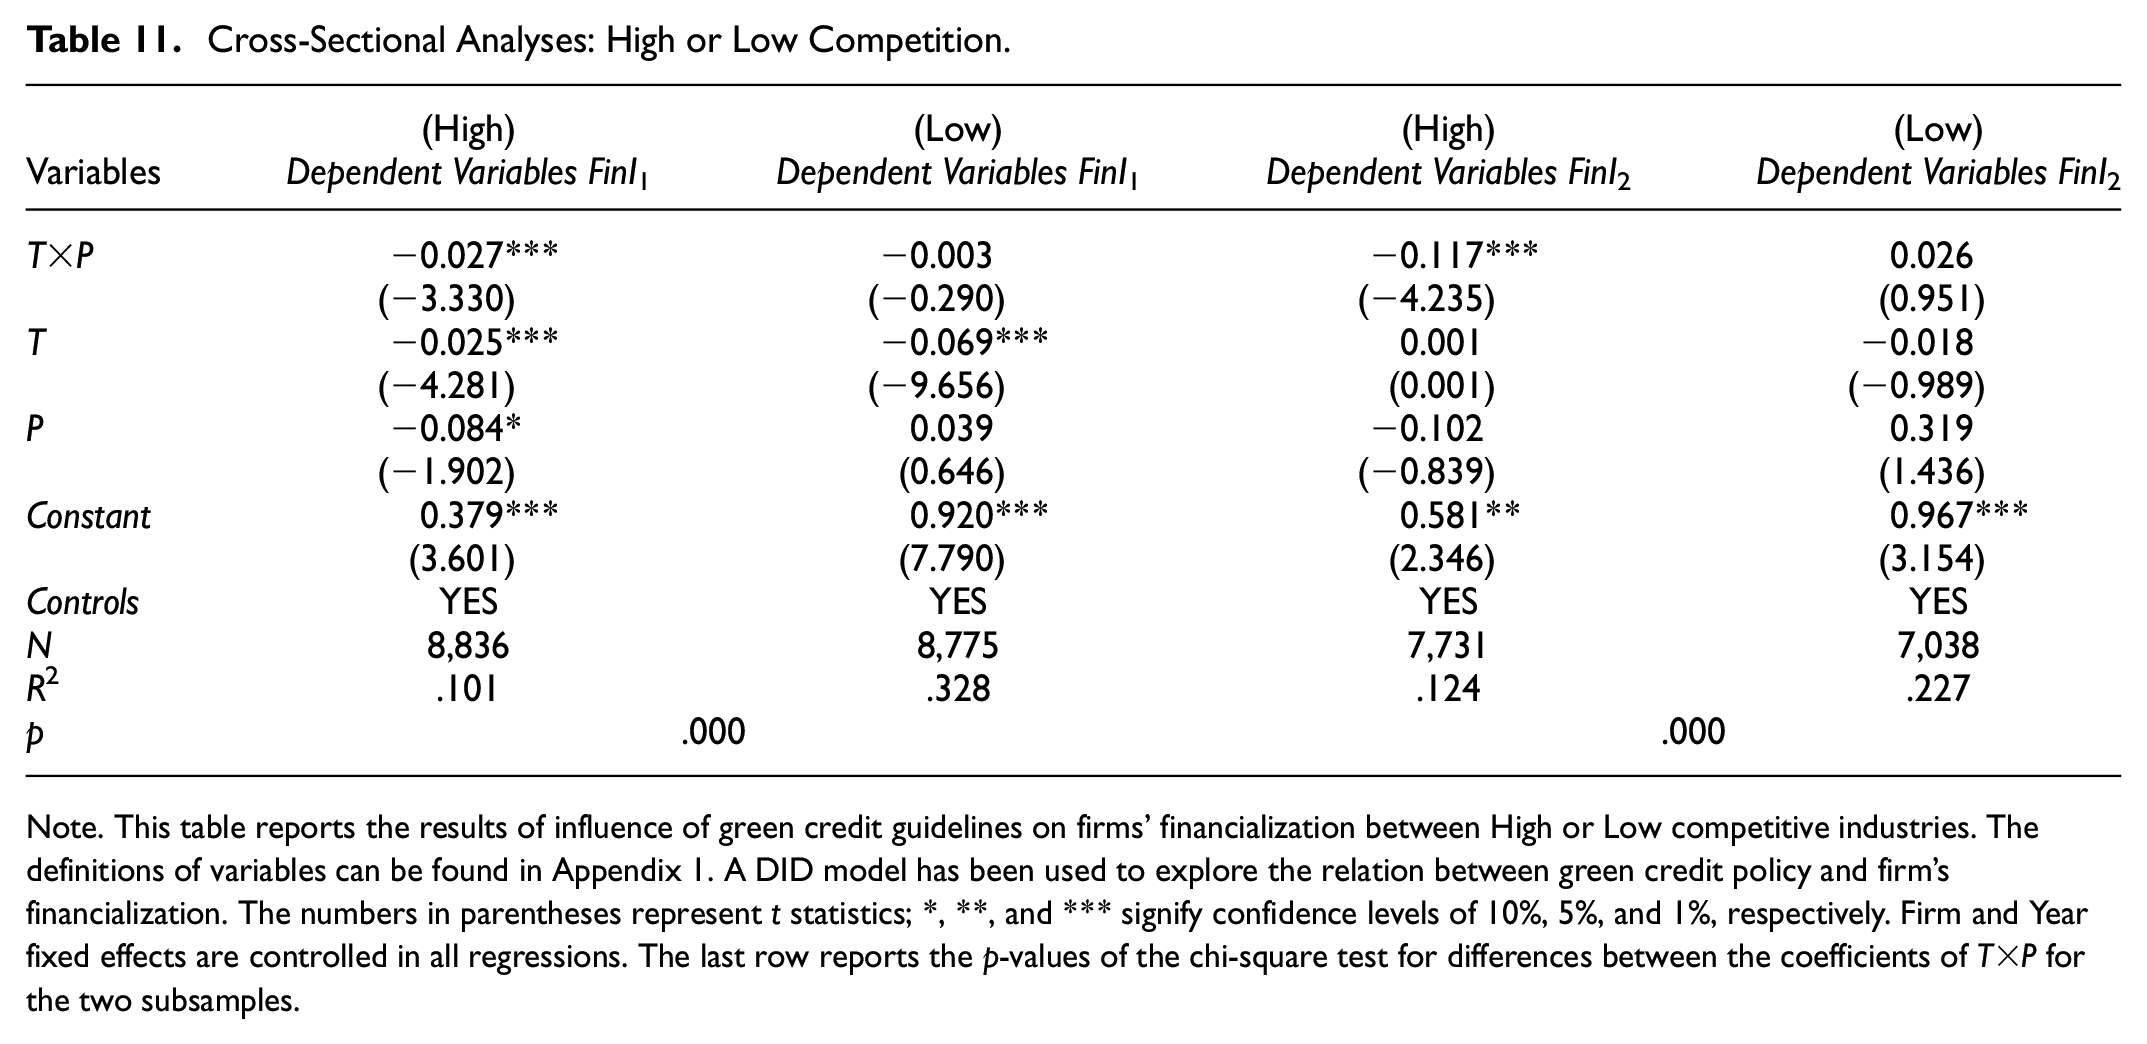
Note. This table reports the results of influence of green credit guidelines on firms’ financialization between High or Low competitive industries. The definitions of variables can be found in Appendix 1. A DID model has been used to explore the relation between green credit policy and firm’s financialization. The numbers in parentheses represent t statistics; *, **, and *** signify confidence levels of 10%, 5%, and 1%, respectively. Firm and Year fixed effects are controlled in all regressions. The last row reports the p-values of the chi-square test for differences between the coefficients of T×P for the two subsamples.
Conclusions, Policy Implications and Directions of Future Research
Discussion and Conclusions
In recent years, China has been making significant strides toward reducing its carbon footprint and promoting sustainable development. One of the important policy measures introduced to support the goal is the green credit policy (Cui et al., 2022). This policy incentivizes banks to lend to environmentally friendly firms and penalizes those in polluting industries (Yao et al., 2021; D. Zhang et al., 2019). This study offers empirical evidence on the economic consequences of green credit policy from the view of the financialization of firms. Using the financial data of Chinese listed firms from 2008 to 2019, we employed a DID model to examine the effect of green credit policy on the financialization of firms, this paper come to the following conclusions:
(1) The promulgate of green credit policy not only decreases the financial assets holding percentage, but also limits the investment gain from financial assets investment in heavy polluted enterprises. The result can be trusted following a thorough examination of its robustness, which included conducting parallel trend tests, PSM-DID tests, placebo tests, and considering alternative explanations.
(2) The empirical studies confirmed that the promulgate of green credit policy decrease the financial investments of firms through three channels. First, green credit policies can curb the financialization of heavy polluting enterprises by promoting their technological innovation. Second, the promulgate of GCG improves the corporate governance to retain managers’ profit seeking incentive, therefore reducing financialization through decreasing excess cash. Last but not least, green credit policies can help to diminish the financial focus of highly polluting firms by reducing banks’ willingness to supply credit to them.
(3) The empirical results also find that the effect of green finance policy on firms’ financialization is more significant in state-owned enterprises, in stronger environmental enforcement areas and in more highly competitive industries.
Policy Implications
The findings of this work also significantly contribute to industrial implications and social practice and provides new ideas for the growth of emerging market firms’ finance decision. The implications for policy can be summarized as follows:
Firstly, this paper suggests that the government needs to develop a comprehensive framework aimed at promoting particular environmentally friendly practices within corporations, with a specific focus on green credit policies. Our research suggests that the introduction of GCG has a beneficial effect on heavily polluting enterprises. Consequently, it is advisable to establish more targeted green finance measures to facilitate the transition toward environmental sustainability for these heavily polluting enterprises.
Secondly, the policy of implementation supervision and inspection should be increased to create a good enforcement environment. The inhibiting effect of green credit policy on the level of financialization of heavily polluting firms will vary depending on differences in ownership and the intensity of regional environmental enforcement. Therefore, the government should increase its supervision against the occurrence of bad bank-enterprise relations, soft budget constraints and other deviations in the effects of green credit. At the same time, we should focus on strengthening regional environmental enforcement to create a better enforcement environment for the implementation of environmental policies.
Last but not least, it is found that the level of financialization of enterprises out of industries with higher competition levels is more significantly affected by green credit policies. Therefore, it is necessary to diminish the industry entry barriers, reduce industry concentration, improve the external governance environment of enterprises, thus create a better business environment.
Limitations and Directions for Future Research
Our work has several limitations, with endogeneity being the primary concern. To address this, we employed the PSM-DID method to safeguard our results against this limitation. Additionally, it’s important to note that the green policy is a macro variable at the industry level, while firms’ financialization represents a micro variable. Therefore, the risk of reverse causality is minimal. Although we have followed the current research to add as much control variables as possible, some unobserved missing variables may persist. How to overcome the endogenous problems caused by the omitted variables in the relation between green credit policy and firms’ financialization needs further attention in the future. Another limitation is the availability of data. Currently, companies and banks do not provide detailed information disclosure for green loans, which prevents us from understanding the decision-making mechanism of banks in granting green loans. More detailed information disclosure in the future would provide more direct empirical evidence to this study.
How green credit policy can guide the transformation of heavily polluting firms is a major practical issue. As a structural financial policy, green credit policy will have a significant differential impact on the risk-taking level of different types of enterprises. Therefore, the transformation risk in the green transformation process of heavily polluting firms should be investigated in future research.
Footnotes
Appendix 1
Variable Definitions.

| Variables | Definitions |
|---|---|
| FinI 1 | FinI1=(held-to-maturity investments+financial assets available for trading +investment real estate+financial assets available for sale+dividend receivable + interest available)/total assets. |
| FinI 2 | FinI2=(Financial Investment income, gain or loss on fair value changes and other comprehensive income)/ Earnings before interest and taxes |
| T | T is dummy variable, equal to 1 if the firm is in treated group (heavily polluting firms), otherwise 0. |
| P | P is time dummy variable, equals to 1 in 2012 and after, 0 before 2012. |
| fc | Firm financial constraint, which is calculated following the approach in Hadlock and Pierce (2010). |
| AsSize | Natural log of a firm’s total assets. |
| Leverage | The book value of total debt divided by the book value of total assets. |
| Roa | The ratio of net income to total assets. |
| Fage | Fage is the number of years since the firm’s start-up. |
| Cashholdings | The ratio of cash over total assets. |
| Growth | The growth rate of total revenue. |
| Dual | Coded as one if the CEO occupied the chair position of the board and as zero otherwise. |
| Boardsize | Number of directors on the board. |
| Bigfour | Big 4 auditor dummy variable that equals one if the auditor is a Big 4 firm, and zero otherwise. |
| AA | The number of analysts providing earnings forecasts. |
| Indep | Indep is the ratio calculated as the fraction of independent directors. |
| Enre | Enre is a dummy variable that equals one if the firm is monitored by regulatory strictly, zero otherwise. |
Declaration of Conflicting Interests
The author(s) declared no potential conflicts of interest with respect to the research, authorship, and/or publication of this article.
Funding
The author(s) disclosed receipt of the following financial support for the research, authorship, and/or publication of this article: This research was funded by Social Science Fund of Shanghai of China [grant number 2022BJB003] and Social Science Fund of Shanghai of China [grant number 2022ZJB001].
Data Availability Statement
The data are available from the corresponding author on reasonable request.