
Abstract
This study proposes a novel analytical framework that integrates the digital economy, industrial agglomeration, and carbon emissions. It then applies this framework to examine the heterogeneous impacts of secondary and tertiary sector agglomeration on carbon emissions and the moderating role of the digital economy across different city types within the Yangtze River Delta (YRD). The results suggest that secondary sector agglomeration generally increases carbon emissions, while tertiary sector agglomeration reduces them, with variations across city types. In developing cities, secondary sector agglomeration raised carbon emissions between 2010 and 2017, tertiary sector agglomeration reduced carbon emissions until 2019. Super-hub cities exhibited an opposite trend during the 2012 to 2017 period. The digital economy and each of its dimensions positively affect carbon emissions from secondary sector agglomeration but negatively impact carbon emissions from tertiary sector agglomeration to varying degrees. The study thus proposes tailored policy recommendations to promote the synergy of digitalization and green development, as well as the advancement of low-carbon industries.
Plain Language Summary
This study explores how industrial agglomeration and the rise of the digital economy affect carbon emissions in the Yangtze River Delta (YRD), a major economic region in China. We developed a new way to analyze these factors together. We found that secondary sector agglomeration generally increases carbon emissions, while tertiary sector agglomeration reduces them. These impacts vary depending on the type of city.In developing cities, secondary sector agglomeration increased emissions between 2010 and 2017, while tertiary sector agglomeration helped reduce emissions up until 2019. In super-hub cities, the trends were reversed during the 2012-2017 period. The digital economy plays an important role. It and each of its dimensions positively affect carbon emissions from secondary sector agglomeration but negatively impact carbon emissions from tertiary sector agglomeration, with varying degrees across different types of cities. These findings suggest that policies to reduce carbon emissions should differ by city and industry type. The study proposes that different cities may need tailored policies to reduce carbon emissions and foster the development of the digital economy. It recommends finding ways to combine the digital economy with low-carbon goals, promoting sustainable industries across the YRD and similar regions.
Introduction
As climate change intensifies, reducing greenhouse gas emissions, especially CO2, has become a global consensus. According to data from the Net Zero Tracker, more than 100 countries have pledged to reach carbon neutrality by a target year under frameworks like the Paris Agreement (Z. Zhang & Jin, 2024). At the 75th United Nations General Assembly, China also committed to peak carbon emissions before 2030 and achieve carbon neutrality by 2060. The International Energy Agency (IEA) reports that the construction and industrial sectors together have consistently accounted for more than 50% of global carbon dioxide emissions in recent years. By contrast, the service sector primarily depends on electricity and office energy consumption, and its direct carbon emissions are not usually treated as a distinct category. Nevertheless, the indirect emissions arising from energy use throughout service sector supply chains remain significant and should not be overlooked (Roberts et al., 2021; W. Zhang et al., 2015). The Global Energy Review 2025 further emphasizes that differences in economic development, energy structures, and policy frameworks lead to regional disparities in emission patterns, with emerging markets and developing economies becoming key contributors to the growth of global carbon emissions.
Meanwhile, industrial agglomeration has emerged as a prominent feature of regional economic development (Krugman, 1991; Porter, 1998). However, the impact of industrial agglomeration on carbon emissions has only gained substantial attention and in-depth exploration in recent decades, with scholars holding divergent views. Without distinguishing between industry types, Tang et al.(2022) suggests that industrial agglomeration in Chinese provinces may reduce emissions short-term but increase regional carbon emissions over time. Research on the Yangtze River Economic Belt (X. Zhang, Pan, et al., 2023) indicates that, within the secondary sector, manufacturing agglomeration significantly promotes carbon emissions. Similarly, a study at the city level in the Yellow River Basin (D. Wang, Liu, & Cheng, 2023) corroborates this finding. This study further reveals that, carbon emissions in the Yellow River Basin exhibit clear path-dependency characteristics, with the positive externalities of agglomeration being relatively limited. The emission-promoting effect of manufacturing agglomeration is especially pronounced in upstream regions. These regional disparities suggest that the impact of industrial agglomeration on carbon emissions differs by stage and region. Consequently, recent studies have increasingly shifted from linear to nonlinear analytical perspectives. H. Li and Liu (2022) and Hou et al.(2023) demonstrate that both overall industrial agglomeration and high energy-consuming industrial agglomeration follow an inverted U-shaped relationship with carbon emission intensity. These findings collectively suggest that once industrial agglomeration surpasses a certain threshold, technological progress, innovation diffusion, and optimized resource allocation gradually take effect, leading to a transition toward emission reduction.
In contrast to manufacturing agglomeration, which generally contributes to increased carbon emissions, existing research widely acknowledges that service sector agglomeration exhibits a significant emission reduction effect. A study based on Chinese provincial panel data (Wu et al., 2024) finds that producer service sector agglomeration significantly reduces the carbon emission intensity of the sector, whereas non-producer service sector shows no significant impact. This effect is predominantly observed in East China. Further research (Luo et al., 2024) indicates that diversified agglomeration of producer service sector substantially lowers carbon emission intensity through knowledge sharing and innovation synergies, with this effect being particularly pronounced in non-eastern cities after 2010.
On the other hand, since Tapscott (1996) first introduced the concept of the digital economy, theoretical and empirical research on its impact on carbon emissions has continued to deepen. According to the United Nations Digital Economy Report (2024), digital technologies have the potential to improve energy efficiency, optimize resource use, and offer innovative solutions for both climate change mitigation and adaptation. However, these benefits may be partially offset by rebound effects. Countries at different stages of development experience these impacts unevenly across the digital lifecycle. Some cities have accelerated their transition toward green and low-carbon development by leveraging the Internet of Things (IoT) and digital infrastructure. These include cities with established industrial bases, such as Stockholm and Copenhagen, and traditionally manufacturing-oriented regions like Pittsburgh, Bilbao, and Essen. In contrast, other cities with historically heavy industrial structures, such as Detroit and Houston in the USA, Upper Silesia in Poland, Gujarat industrial districts in India, and Tangshan in China, remain locked into high-carbon pathways. Meanwhile, service-oriented megacities such as Tokyo, Los Angeles, Seoul, and Shanghai continue maintain high levels of carbon emissions.
Several studies at the global level (Zuo et al., 2024), the Chinese provincial level (Song et al., 2024; Y. Zhang, Liu, & Yang, 2024), the city level (H. Zhang, Qi, et al., 2024), and the county level (H. Wang, Yang, & Yue, 2023) have confirmed the positive role of the digital economy in reducing carbon emissions. These studies also highlight regional disparities, noting that the emission reduction effect of the digital economy is more pronounced in developed countries, in eastern and western provinces of China, in central cities and large and medium-sized cities, and in regions with high concentrations of new energy industries. Other studies have found that, against the backdrop of rapidly growing energy consumption from digital infrastructure, cloud computing, and data centers, the digital economy may paradoxically contribute to an increase in carbon emissions. Arshad et al.(2020) indicated that the development of information and communication technology (ICT) increases carbon dioxide emissions in developing regions such as South Asia and Southeast Asia. Further evidence from 76 Emerging Markets and Developing Economies confirms a significant positive correlation between the penetration of digital finance and carbon emissions (Khan et al., 2023). Che et al.(2024) note that digital infrastructure development may increase carbon emissions globally, particularly in Europe and the Asia-Pacific region, with this effect closely tied to population density. In an empirical study in Australia, the use of digital technologies was found to promote energy consumption, thereby leading to higher carbon emissions (Salahuddin & Alam, 2015). Similarly, a study based on panel data from 301 Chinese cities between 2002 and 2017 (Y. Wang et al., 2025) reveals that both digital industrialization and industry digitalization have, to some extent, exacerbated carbon emissions.
Multiple studies indicate that the relationship between the digital economy and carbon emissions exhibits an inverted U-shaped pattern, characterized by an initial increase followed by a subsequent reduction. This finding has been supported by empirical evidence from across 190 countries (X. Li et al., 2021), as well as from provincial-level studies in China the Chinese provincial level (C. Wang, Zhang, et al., 2023). Additionally, Z. Ma et al.(2025) found that between 2011 and 2019, the development of the digital economy in China’s prefecture-level cities exhibited an inverted U-shaped pattern, with this effect being particularly pronounced in the more economically developed eastern regions. Concurrently, other studies have explored the role of threshold variables such as natural resource rents (Q. Wang et al., 2024), urbanization and financial development (B. Liu & Fang, 2025) in shaping the inverted U-shaped relationship between the digital economy and carbon emissions.
Only a limited number of studies have explicitly investigated the interrelationship among the digital economy, industrial agglomeration, and carbon emissions. Using panel data from 278 Chinese cities (2011–2020), Mao et al. (2025) find that the digital economy indirectly hinders carbon emission intensity reduction through industrial agglomeration, with significant regional and city-scale variations. In contrast, Y. Wang, Liu, et al.(2023) focuses on the moderating role of different types of industrial agglomeration in the impact of the digital economy on carbon emissions. This study, based on data from 30 Chinese provinces (2011–2020), finds that manufacturing agglomeration dampens, while producer service and manufacturing-service agglomeration amplify the carbon emission reduction effect of digital trade.
Evidently, research on the relationship between industrial agglomeration and carbon emissions, as well as between the digital economy and carbon emissions, has yielded substantial findings. However, most studies on industrial agglomeration and carbon emissions treat agglomeration as a homogeneous phenomenon, failing to adequately distinguish the differential impact mechanisms of secondary and tertiary sector agglomeration on carbon emissions. This can lead to oversimplified or biased conclusions, making it challenging to accurately capture the heterogeneous effects of different types of industrial agglomeration on carbon emissions. Similarly, studies on the digital economy and carbon emissions exhibit significant variability due to diverse measurement dimensions and theoretical focuses. Undoubtedly, there remains a lack of systematic research that integrates the digital economy, industrial agglomeration, and carbon emissions into a unified analytical framework.
This study’s contribution lies in treating industrial agglomeration as a spatial economic structure directly impacting carbon emissions, with the digital economy as a moderating factor shaping its mechanisms. It further distinguishes the pathways of secondary and tertiary sector agglomerations. This approach extends the theoretical framework for understanding the effects of industrial agglomeration and the digital economy on carbon emissions. The empirical analysis focuses on the YRD in China, a region characterized by advanced digital economy development and diverse, high levels of industrial agglomeration. By differentiating between “super-hub cities” and “developing cities”, this study systematically examines the direct effects of secondary and tertiary industrial agglomeration on carbon emissions and the moderating role of the digital economy across different development stages and city types. These findings enhance the precision and policy relevance of the conclusions, providing valuable insights for formulating tailored carbon emission reduction and industrial development strategies in the Yangtze River Delta and other comparable regions.
The remainder of this paper is organized as follows: Section “ Theoretical Analysis and Research Hypotheses” presents theoretical analysis develops the research hypotheses; Section “Materials and Methodology” provides an overview of the study area, defines the key variables, presents the model framework, and details the data sources; Section “Empirical Results” presents the empirical results; Section “ Discussion of Results” discusses these results; Section “ Conclusions and Policy Recommendations” summarizes the conclusions and policy recommendations; Section “Limitations and Future Research Directions” outlines this study's limitations and suggests directions for future research.
Theoretical Analysis and Research Hypotheses
General Effects of Industrial Agglomeration on Carbon Emissions
Classical economist Marshall (1919) argued that industrial agglomeration enhances regional competitiveness and fosters economic growth through mechanisms such as knowledge spillovers, labor market integration, and shared infrastructure. However, different types of industrial agglomeration may generate distinct externalities, including environmental impacts (Henderson, 1974; Krugman, 1991). Agglomeration in the secondary sector, primarily comprising manufacturing and heavy industry, tends to increase carbon emissions. In contrast, tertiary sector agglomeration, which relies predominantly on human capital and information flows rather than material and energy consumption (Duranton & Puga, 2004), is characterized by low energy consumption and low emissions. However, this pattern varies across different city types, particularly influenced by industrial structural endowments, stages of economic development, and the stringency of environmental regulations. Therefore, this study proposes the following hypotheses:
Heterogeneous Effects of Industrial Agglomeration on Carbon Emissions
In developing cities, secondary sector agglomeration often manifests as the spatial concentration of traditional high-energy-consuming industries such as heavy chemicals, steel, and construction materials. Even when some enterprises adopt energy-saving technologies, the cost reductions and market expansion driven by agglomeration often stimulate further output growth (Glaeser et al., 1992) and carbon emission (Stern, 2004). This phenomenon is often referred to as the scale rebound effect (Sorrell et al., 2009). Furthermore, once such high-carbon industrial models take hold, sunk costs and institutional inertia create self-reinforcing mechanisms, resulting in path dependence (Arthur, 1989) and a carbon lock-in effect (Unruh, 2000). Additionally, influenced by economic development cycles and stages, most developing cities are positioned on the ascending phase of the Environmental Kuznets Curve (EKC). To prioritize economic growth and employment, these cities often adopt relatively less stringent environmental policies, attracting traditional manufacturing enterprises and fostering agglomeration. This gives rise to a “race to the bottom” effect, further exacerbating carbon emissions (Copeland & Taylor, 2003; Wilson, 1996). In contrast, tertiary sector agglomeration in developing cities primarily consists of producer services, such as consulting, financial services, and logistics, alongside traditional consumer services, including retail, catering, and residential services. This type of agglomeration effectively reallocates labor, optimizes industrial structures, enhances production efficiency, and reduces reliance on high-carbon industries, thereby lowering carbon emissions (Desmet & Rossi-Hansberg, 2013). Moreover, the tertiary sector can promote the adoption of clean production technologies through industrial chain integration and value chain upgrading, generating a “structural emission reduction” effect (Copeland & Taylor, 2004). Therefore, this study proposes Hypothesis 2a.
According to Vernon’s product life cycle theory (Vernon, 1966), super-hub cities undergo industrial upgrading, transitioning to technology-intensive industries and high-end services, and may be surpassing the turning point of the Environmental Kuznets Curve. Secondary sector agglomeration in these cities primarily involves strategic emerging industries such as electronics, biomedicine, and high-end equipment manufacturing, which exhibit significantly lower energy intensity than traditional secondary industries. Moreover, super-hub cities have abundant R&D resources, high-quality talent, and strong innovation networks. These advantages foster knowledge sharing and accelerate the development and application of green technologies (Jaffe et al., 1993). Consequently, secondary sector agglomeration in these cities is more likely to generate “green technology spillover” effects, supplanting traditional scale effects. Compared to developing cities, super-hub cities impose stricter carbon emission and environmental standards, encouraging enterprises to pursue green innovation (Brunnermeier & Cohen, 2003; Porter & van der Linde, 1995) and enabling its faster, broader dissemination. In contrast, the agglomeration of high-end service industries in super-hub cities, such as finance, corporate headquarters, and cross-border logistics exhibits relatively low direct carbon emissions but generates substantial indirect emissions (Glaeser & Kahn, 2010; Heinonen & Junnila, 2011). The agglomeration of the service sector not only increases residents’ disposable income but also attracts high-income populations, thereby stimulating consumption rebound and high-carbon transportation (Lenzen et al., 2004; Hertwich, 2005). Furthermore, the prosperity of the service sector drives regional economic expansion, increasing demand for energy and construction, which leads to a macro-level rebound effect (Sorrell et al., 2009). This increase in carbon emissions is often difficult to offset through technological advancements on the production side. Therefore, this study proposes Hypothesis 2b.
The Moderating Role of Digital Economy
The digital economy, as an emerging production factor, reshapes the operational logic of traditional industrial agglomeration through its data-driven, intelligent, and networked characteristics (Brynjolfsson & McAfee, 2014). The digital economy enhances resource allocation efficiency while also generating new energy demands, thereby moderating the impact of industrial agglomeration on carbon emissions. These effects vary depending on the stage of urban development.
In developing cities, the application of digital technologies provides new pathways for the green transformation of traditional manufacturing and heavy chemical industries, helping enterprises overcome carbon lock-in effects and enhance energy efficiency. Digital technology service platforms facilitate the development of cost-effective green technology solutions (Armbrust et al., 2010), promoting the transfer of green technologies to small and medium-sized enterprises (Chesbrough, 2003). Nevertheless, due to limitations in industrial foundations and insufficient digital infrastructure, as well as inadequate policy coordination between digitalization and green development, developing cities struggle to achieve the same emission-reduction effects from secondary sector agglomeration as super-hub cities. By contrast, secondary sector agglomeration in super-hub cities has, to a significant extent, transitioned toward high-end and intelligent manufacturing. According to the theory of complementary technological innovation (Milgrom & Roberts, 1990), the synergistic application of digital and green technologies can generate amplified emission reduction effects. In super-hub cities, enterprises with high levels of digitalization are more capable of absorbing and applying advanced green production technologies. Digital platforms also reduce transaction costs for technology transfer, facilitating the dissemination and commercialization of green patents (Goldfarb & Tucker, 2019). Furthermore, digitalized environmental monitoring and management systems enhance the effectiveness of environmental regulations.
In developing cities, the integration of the digital economy with the tertiary sector enhances convenience and consumption demand but may also increase indirect energy use and lead to consumption rebound effects, similar to those in super-hub cities (Greening et al., 2000). Due to constraints in technological sophistication and management capabilities, the energy efficiency of data centers in these cities may be lower, further offsetting emission reduction benefits. In super-hub cities with advanced digital infrastructure, the deep integration of digital technologies with the service sector has further spurred the emergence of new service models, resulting in a surge in energy demand and associated carbon emissions (Belkhir & Elmeligi, 2018). Extensive investments in data centers and cloud computing facilities have resulted in substantial electricity consumption in super-hub cities (Masanet et al., 2020).
More notably, the digital economy, as a composite factor, can be decomposed into four dimensions: digital infrastructure level, digital industrialization, industrial digitalization, and digital innovation capability (L. Ma et al., 2023; H. Zhang, Qi, et al., 2024). Although these dimensions interact and co-evolve rather than operate independently, they exhibit distinct moderating effects on carbon emissions from secondary and tertiary sector agglomeration. Digital infrastructure, as the physical foundation for digital technology applications, provides a clear “hardware support” effect (Roller & Waverman, 2001). Its effect on tertiary sector agglomeration is dual, simultaneously reducing emissions while triggering rebound effects. Digital industrialization reflects the development level of the digital industry itself. For secondary sector agglomeration, its role lies in providing technical services and solutions to empower production processes (Jorgenson et al., 2008). Its effect on tertiary sector agglomeration is more complex due to substitutive and complementary relationships between industries. Industrial digitalization, representing the depth of digital technology application in traditional industries, exerts its influence through technology penetration effects (Verhoef et al., 2021). Its impact on secondary sector agglomeration becomes more pronounced once a threshold is reached, whereas its effect on tertiary sector agglomeration exhibits a “double-edged sword” characteristic. Digital innovation capability reflects the ability to harness digital technologies for innovation, generating a multiplier effect on carbon emission reductions in secondary sector agglomeration (Nambisan et al., 2017). In tertiary sector agglomeration, however, rebound effects may lead to an “innovation paradox,” potentially stimulating higher carbon emissions.
Based on this analysis, this study proposes the following hypothesis 3a and 3b:
The theoretical analysis framework is presented in Figure 1.

Theoretical framework.
Materials and Methodology
Study Area
The Yangtze River Delta (YRD), located on China’s eastern coast, is one of the country’s most economically developed and dynamic regions. According to the Yangtze River Delta Regional Integration Development Plan issued by the State Council in 2016, the core of the YRD urban agglomeration comprises 26 major cities distributed across Shanghai, Jiangsu, Zhejiang, and Anhui provinces (Figure 2). Over decades of development, the YRD has transformed from an industrial base dominated by labor-intensive and energy-intensive into a globally competitive, world-class urban agglomeration. The region currently features a well-developed and diversified industrial ecosystem that integrates finance, advanced manufacturing, strategic emerging industries, port logistics, and future-oriented industries. It places a particular emphasis on innovation-driven growth and the pursuit of green, low-carbon development. In 2019, the proportions of the secondary and tertiary sectors in the YRD were 1.6% and 1.5% higher, respectively, than the national average. The YRD also possesses advanced digital infrastructure, positioning it at the forefront of China’s digital economy. Although per capita emissions rose moderately between 2015 and 2019, carbon emission intensity declined markedly during the same period. Regional variations in carbon policy, technological innovation, and energy consumption have driven diverse effects of industrial agglomeration on carbon emissions in YRD cities. These effects vary across different stages of urban and economic development. The rise of the digital economy introduces a new dimension to this process, making the YRD an representative empirical context for examining the mechanisms through which industrial agglomeration affects carbon emissions and the moderating role of the digital economy.

Geographical location of the research area.
This study selects the period from 2010 to 2019 as the research timeframe, consistent with the aforementioned context, based on the following specific considerations. First, this period begins with the approval of the Regional Plan for the YRD in 2010, a critical policy milestone. From this point onward, the YRD initiated industrial relocation and upgrading while actively fostering high-tech industries. Second, starting in 2010, low-carbon development became a central theme in China’s socioeconomic development, with carbon emission intensity incorporated as a binding indicator in economic planning. This period marks a crucial stage for the Yangtze River Delta’s digital economy. Third, the timeframe fully covers China’s 12th (2011–2015) and 13th (2016–2020) Five-Year Plans. It also represents a critical phase for the region’s efforts to decouple carbon emissions from economic growth, providing an ideal window to study the dynamic relationships among the three factors we focus on. Fourth, the data for this period maintain consistent statistical standards and high availability, while avoiding the extreme external shocks of the 2008 to 2009 global financial crisis and the 2020 COVID-19 pandemic. This ensures that the research findings reflect the intrinsic relationships among the three key variables related to our research topic under normal socioeconomic conditions, rather than temporary responses to extreme external disruptions.
Variable Selection
Dependent Variable and Explanatory Variables
The dependent variable of the paper is carbon emissions (CE) of 26 cities in the YRD urban agglomeration from 2010 to 2019. The calculation of carbon emissions (CE) is based on the method proposed by Shan et al.(2017), which includes the carbon emissions of 17 fossil fuels in 47 socio-economic industries and the carbon emissions of industrial processes.
The core explanatory variables in this study are the agglomeration of secondary and tertiary sectors (
Dependent variable and key explanatory variables are shown in Table 1.
Dependent Variable and Explanatory Variables.

Control Variables
Drawing on relevant studies on the influencing factors of carbon emissions (Chu & Majumdar, 2012; Destek & Manga, 2021; P. Liu et al., 2022; N. Shen et al., 2019; Y. N. Wang et al., 2022; N. Zhang & Zhuang, 2023; Zhao et al., 2023), our study controls the following variables (Table 2).
Population density (PD): Reflects the intensity of social interactions and the concentration of urban activities, measured as the permanent resident population per square kilometer.
Level of economic development (PGDP): Captures the city’s economic prosperity, measured by per-capita GDP.
Degree of opening (DO): Represented by the proportion of foreign direct investment in GDP.
Energy consumption level (ECL): Calculated as the total standard coal equivalent for each city, derived by converting supplied manufactured gas, natural gas, liquefied petroleum gas, and electricity consumption using their respective standard coal coefficients.
Technological innovation (TI): Represented by the annual count of granted patents.
Environmental Governance Strength (EGS): This variable captures the stringency of regional environmental policies and regulatory enforcement, measured as the reduction in industrial SO2 emissions.
Control Variables Selection.

Moderating Variable
This study constructs a comprehensive indicator system of the digital economy (Table 3) from four aspects: digital infrastructure level, digital industrialization, industrial digitalization, and digital innovation capability (L. Ma et al., 2023; H. Zhang, Qi, et al., 2024). The level of digital economy development (DEI) in each city is calculated using principal component analysis (M. J. Wang, Zhang, et al., 2023). Each principal component objectively extracts the weights of individual indicators from the eigenvectors of the covariance matrix derived using standardized data, thereby minimizing potential subjective bias. In this study, the first two principal components, which together explain approximately 80% of the total variance, are retained to construct the comprehensive index, ensuring both representativeness and efficiency in dimensionality reduction.
Digital Economy Development Indicator System.

Model Specification
To examine the impact of industrial agglomeration on carbon emissions, this study employs a two-way fixed effects model, as presented in Equation 1. The selection of this model is based on the following considerations. Cities in the YRD exhibit notable differences in geographic location, resource endowments, and consumption patterns. These time-invariant city-specific factors may be correlated with industrial agglomeration, carbon emissions, and the moderating effect of the digital economy, potentially leading to omitted variable bias (Wooldridge, 2010). The individual fixed effects effectively control for these unobservable city-specific characteristics, ensuring that model estimates are not confounded by such time-invariant factors. Additionally, during the study period, China implemented a series of national industrial, environmental, and digital economy policies, alongside experiencing macroeconomic fluctuations and technological advancements. These time-specific factors may uniformly affect the carbon emission levels of the studied cities. The incorporation of time fixed effects captures these cross-city consistent temporal trends and macroeconomic shocks, preventing the misattribution of these common factors to the effects of industrial agglomeration and isolating the net moderating effect of the digital economy. Compared to ordinary least squares (OLS) models, the two-way fixed effects model leverages the time-series dimension of panel data through within-group transformation, enhancing estimation efficiency while controlling for unobservable heterogeneity (Hsiao, 2022). Furthermore, to address potential within-city correlation and heteroskedasticity, we employ clustered robust standard errors at the city level in the two-way fixed effects model (Cameron & Miller, 2015; Petersen, 2009). In heterogeneity analyses across different city types, the two-way fixed effects model provides a consistent estimation framework for subsample analyses, ensuring the validity and reliability of cross-group comparisons (Cameron & Trivedi, 2005).

Where i represents a city; t represents a year; C stands for carbon emissions; X is the core explanatory variable, which can be either

Furthermore, as shown in Equation (2), the moderating variable (
Data Sources
The carbon emissions data for prefecture-level cities in the YRD from 2010 to 2019 are sourced the China Emission Accounts and Datasets (CEADs). The digital financial inclusion index is from Peking University. Other data come from the CSMR (https://data.csmar.com) and CBDPS (https://r.qiyandata.com) databases, the China Statistical Yearbook, and statistical yearbooks of each city. USD-denominated variables were converted to RMB using annual average exchange rates, and missing data were interpolated.
Empirical results
Descriptive Statistics
Table 4 presents the descriptive statistics of the variables. To enhance interpretability, certain variables that were log-transformed are also reported in their original form. CE ranges from 6.923 to 236.487, indicating substantial variation across cities.
Descriptive Statistics of Variables.

Analysis on the Impact of Industrial Agglomeration on Carbon Emissions
Baseline Regression Analysis
Prior to the formal regression analysis, a multicollinearity test was conducted. All variables exhibited variance inflation factors (VIF) below 5. This suggests that there is no evidence of multicollinearity among the variables. Columns (1) and (2) of Table 5 report the regression results of the impact of secondary and tertiary sector agglomeration on carbon emissions without control variables. Columns (3) and (4) include control variables. Column (5) presents the regression results incorporating both secondary and tertiary sector agglomeration and control variables.
Benchmark Regression Results.
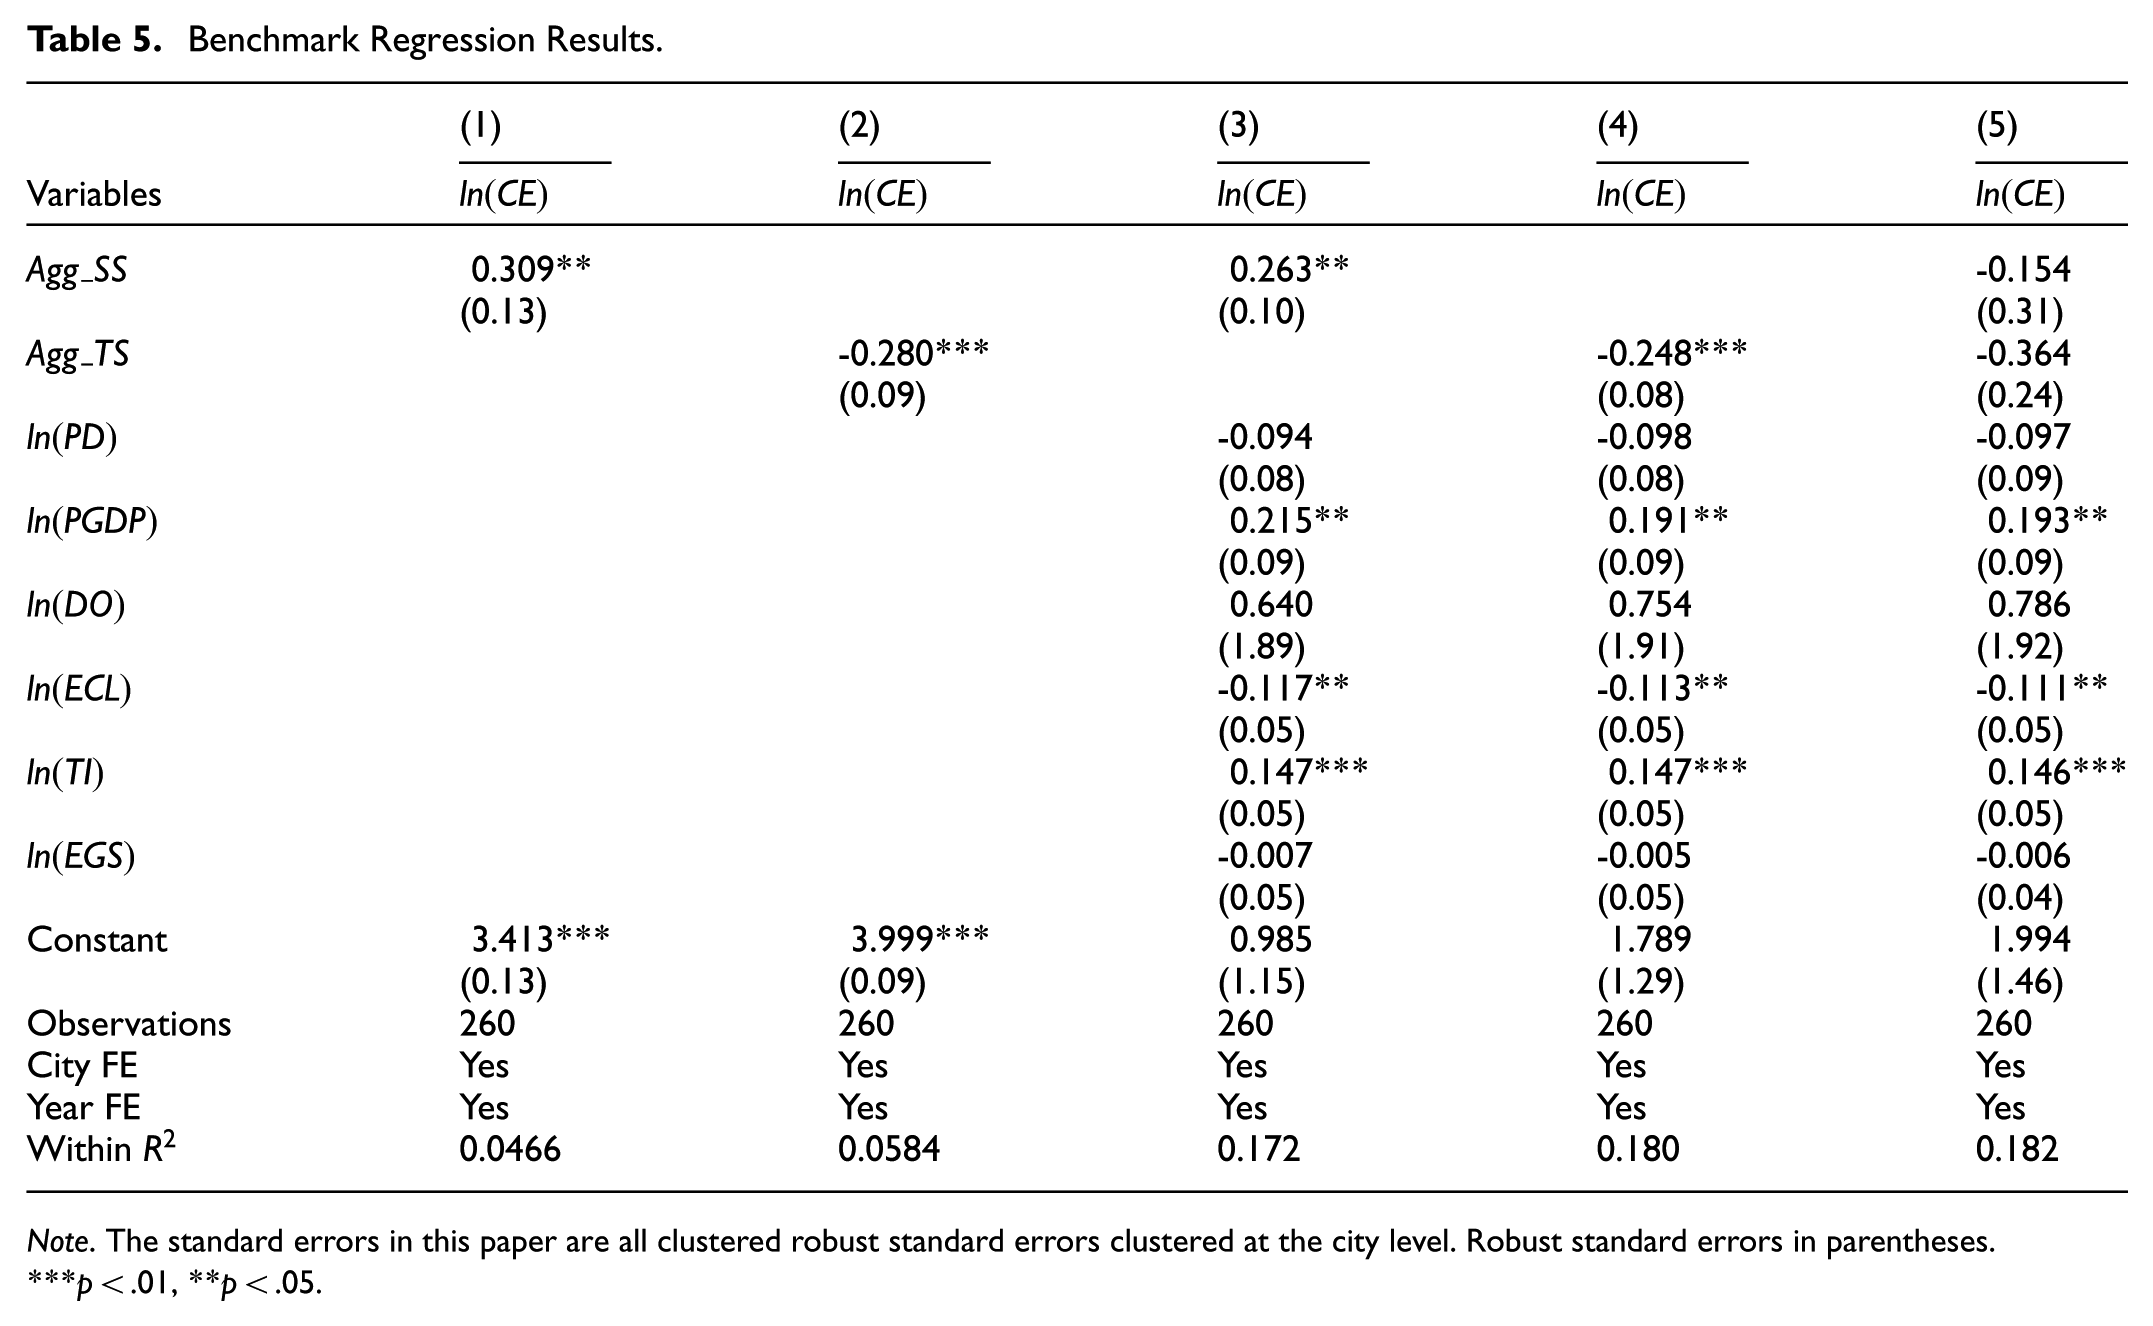
Note. The standard errors in this paper are all clustered robust standard errors clustered at the city level. Robust standard errors in parentheses.
p < .01, **p < .05.
Columns (1) to (4) show that the coefficients for secondary and tertiary sector agglomeration are statistically significant and share the same direction. However, the results in Column (5) indicate that when both secondary and tertiary sector agglomeration are included in the model, their coefficients lose statistical significance. This finding indicates that secondary and tertiary sector agglomerations may potentially interact, thereby influencing their combined impact on carbon emissions. Subsequent analysis will focus on the results from columns (3) and (4) to examine the impact of secondary and tertiary sector agglomeration on carbon emissions.
In Column (3), the coefficient of
Among the control variables,
Robustness Tests
To ensure the robustness of the findings, this study conducted several robustness checks (Table 6). (1) Lagged core explanatory variables: Used one-period lags of secondary and tertiary sector agglomeration (
Results of Robustness Tests.
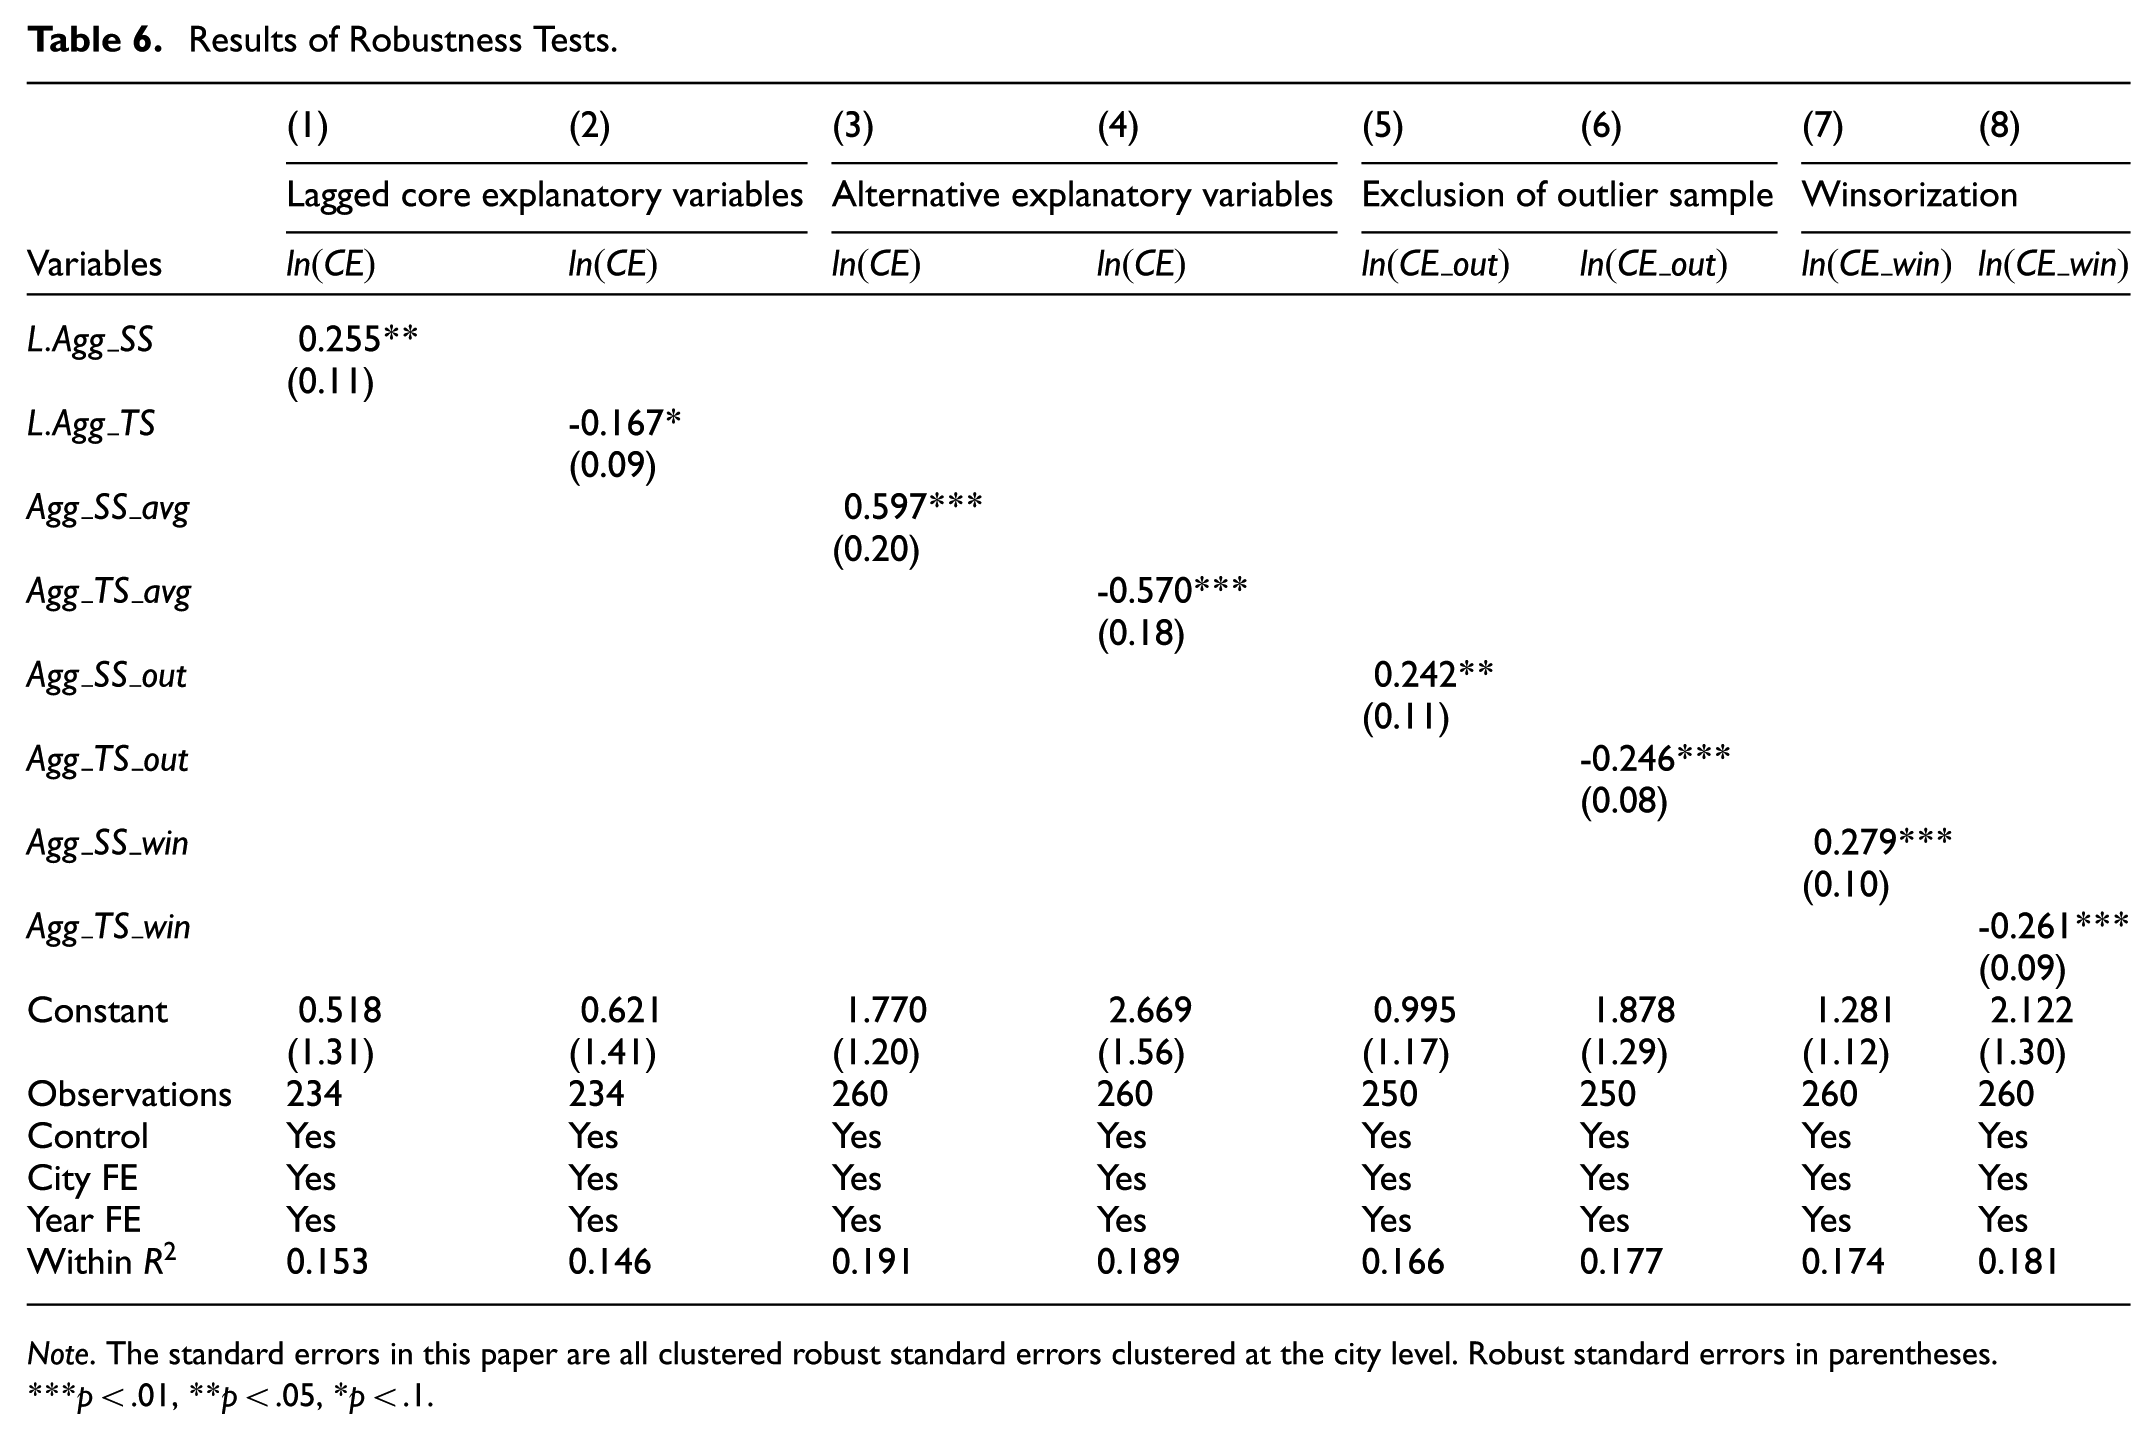
Note. The standard errors in this paper are all clustered robust standard errors clustered at the city level. Robust standard errors in parentheses.
p < .01, **p < .05, *p < .1.
Heterogeneity Analysis
This study adopts the classification standards from the 2014 State Council’s Notice on Adjusting the Criteria for City Size Classification and incorporates data from the Seventh National Population Census. Cities with a permanent population exceeding 5 million are designated as “super-hub cities”, while those with 5 million or fewer are “developing cities” (Table 7).
The Classification of Cities.

The detailed results of the heterogeneity analysis are presented in Table 8. The results in Columns 1 and 2 indicate that the impact of secondary sector agglomeration on carbon emissions in developing cities of the YRD is not statistically significant over the entire study period. However, when analyzing the period from 2010 to 2017, the effect of secondary sector agglomeration on carbon emissions in these developing cities is significantly positive. The results in Column 3 confirm that, during the study period, tertiary sector agglomeration in developing cities has a significantly negative impact on carbon emissions. Columns 4 to 7 indicate that, throughout the study period, secondary and tertiary sector agglomeration have no statistically significant effect on carbon emissions in super-hub cities. However, for super-hub cities from 2012 to 2017, secondary sector agglomeration has a statistically significant negative effect on carbon emissions. In contrast, tertiary sector agglomeration has a statistically significant positive effect. During this period, a one-unit increase in secondary and tertiary sector agglomeration in super-hub cities leads to an approximate 89.2% reduction (
Results of Heterogeneity Analysis.
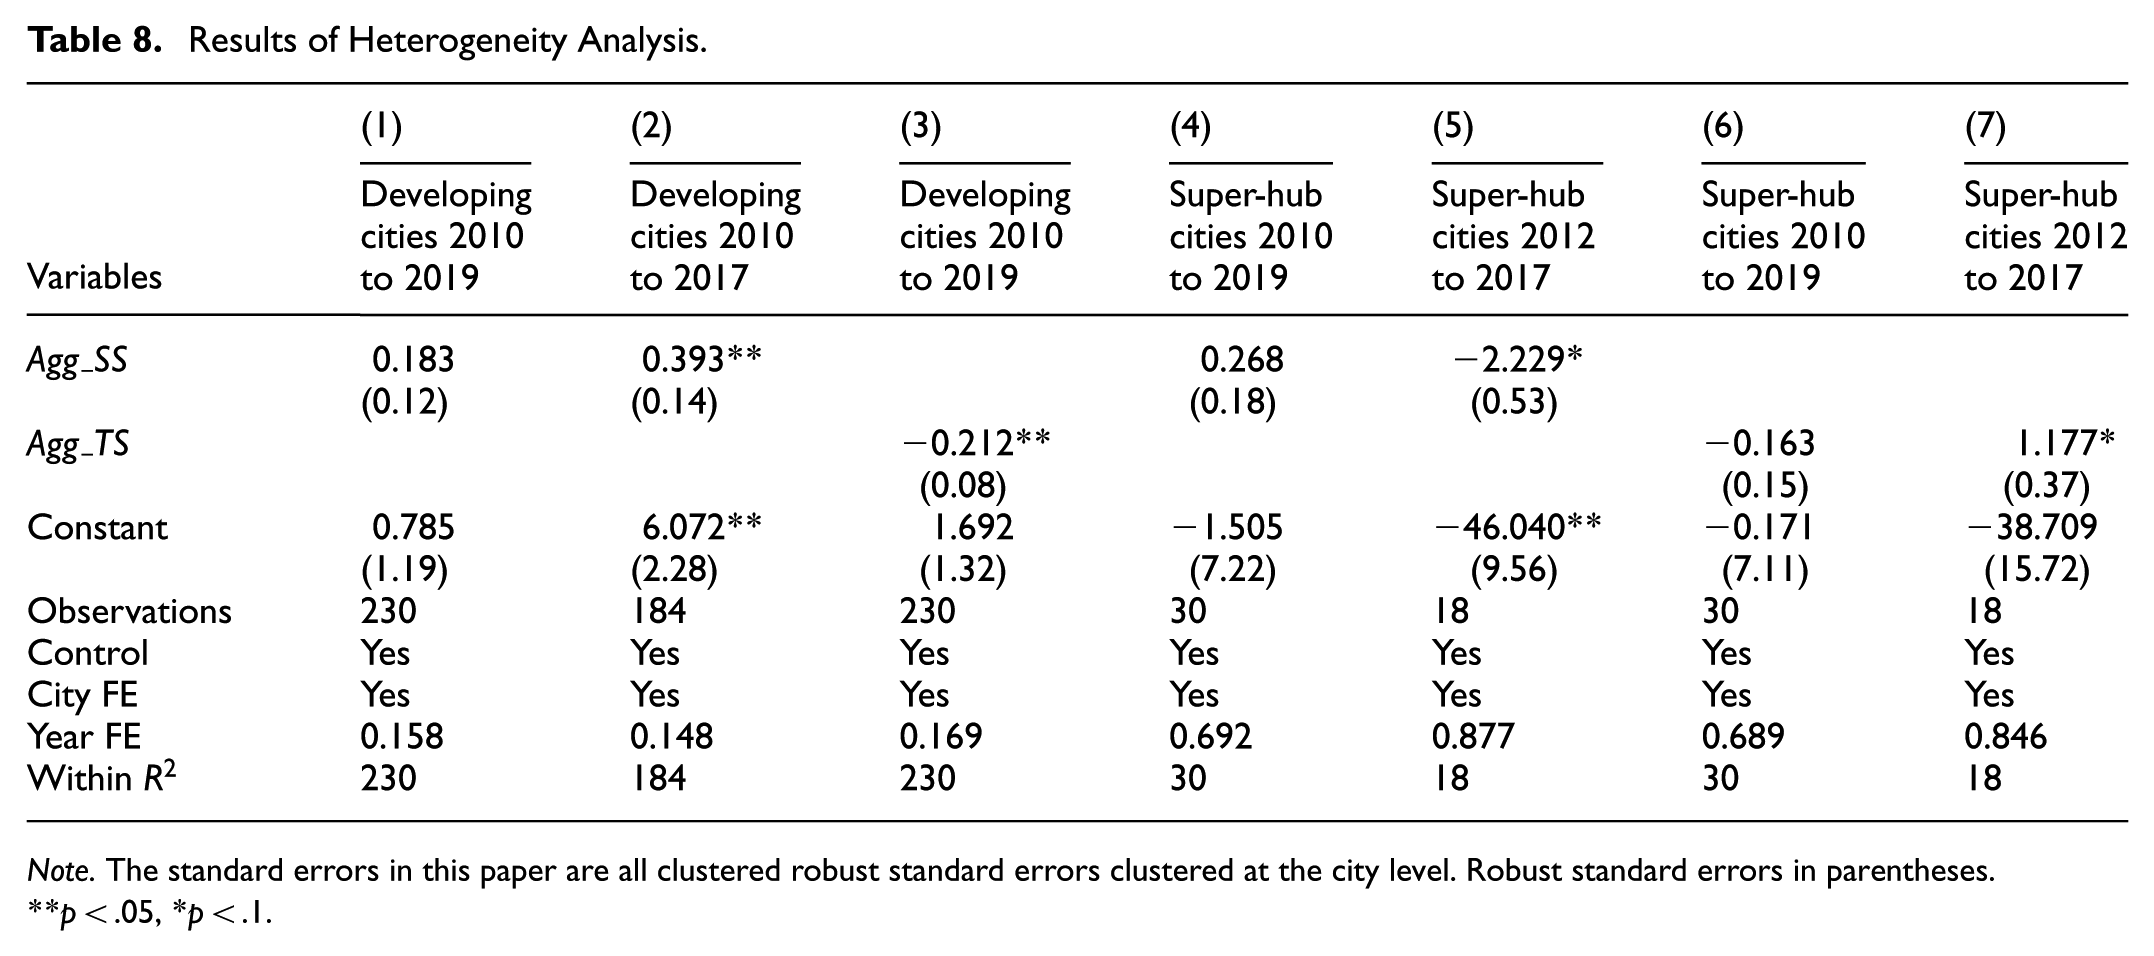
Note. The standard errors in this paper are all clustered robust standard errors clustered at the city level. Robust standard errors in parentheses.
p < .05, *p < .1.
The Moderating Role of the Digital Economy on the Carbon Emission Effects of Industrial Agglomeration
Table 9 presents the regression results of the moderation effect model. To address multicollinearity, both the digital economy and industrial agglomeration variables were mean-centered, and interaction terms were constructed as the product of these centered variables. Columns (1) and (2) incorporate the interaction term between the digital economy and secondary sector agglomeration. Columns (3) and (4) include the interaction term between the digital economy and tertiary sector agglomeration. Figure 3. illustrates the marginal effects of industrial agglomeration on carbon emissions under the influence of the digital economy during the corresponding periods. Figure 3a and bcorrespond to Columns (1) and (2) of Table 9, while (c) and (d) correspond to Columns (3) and (4).
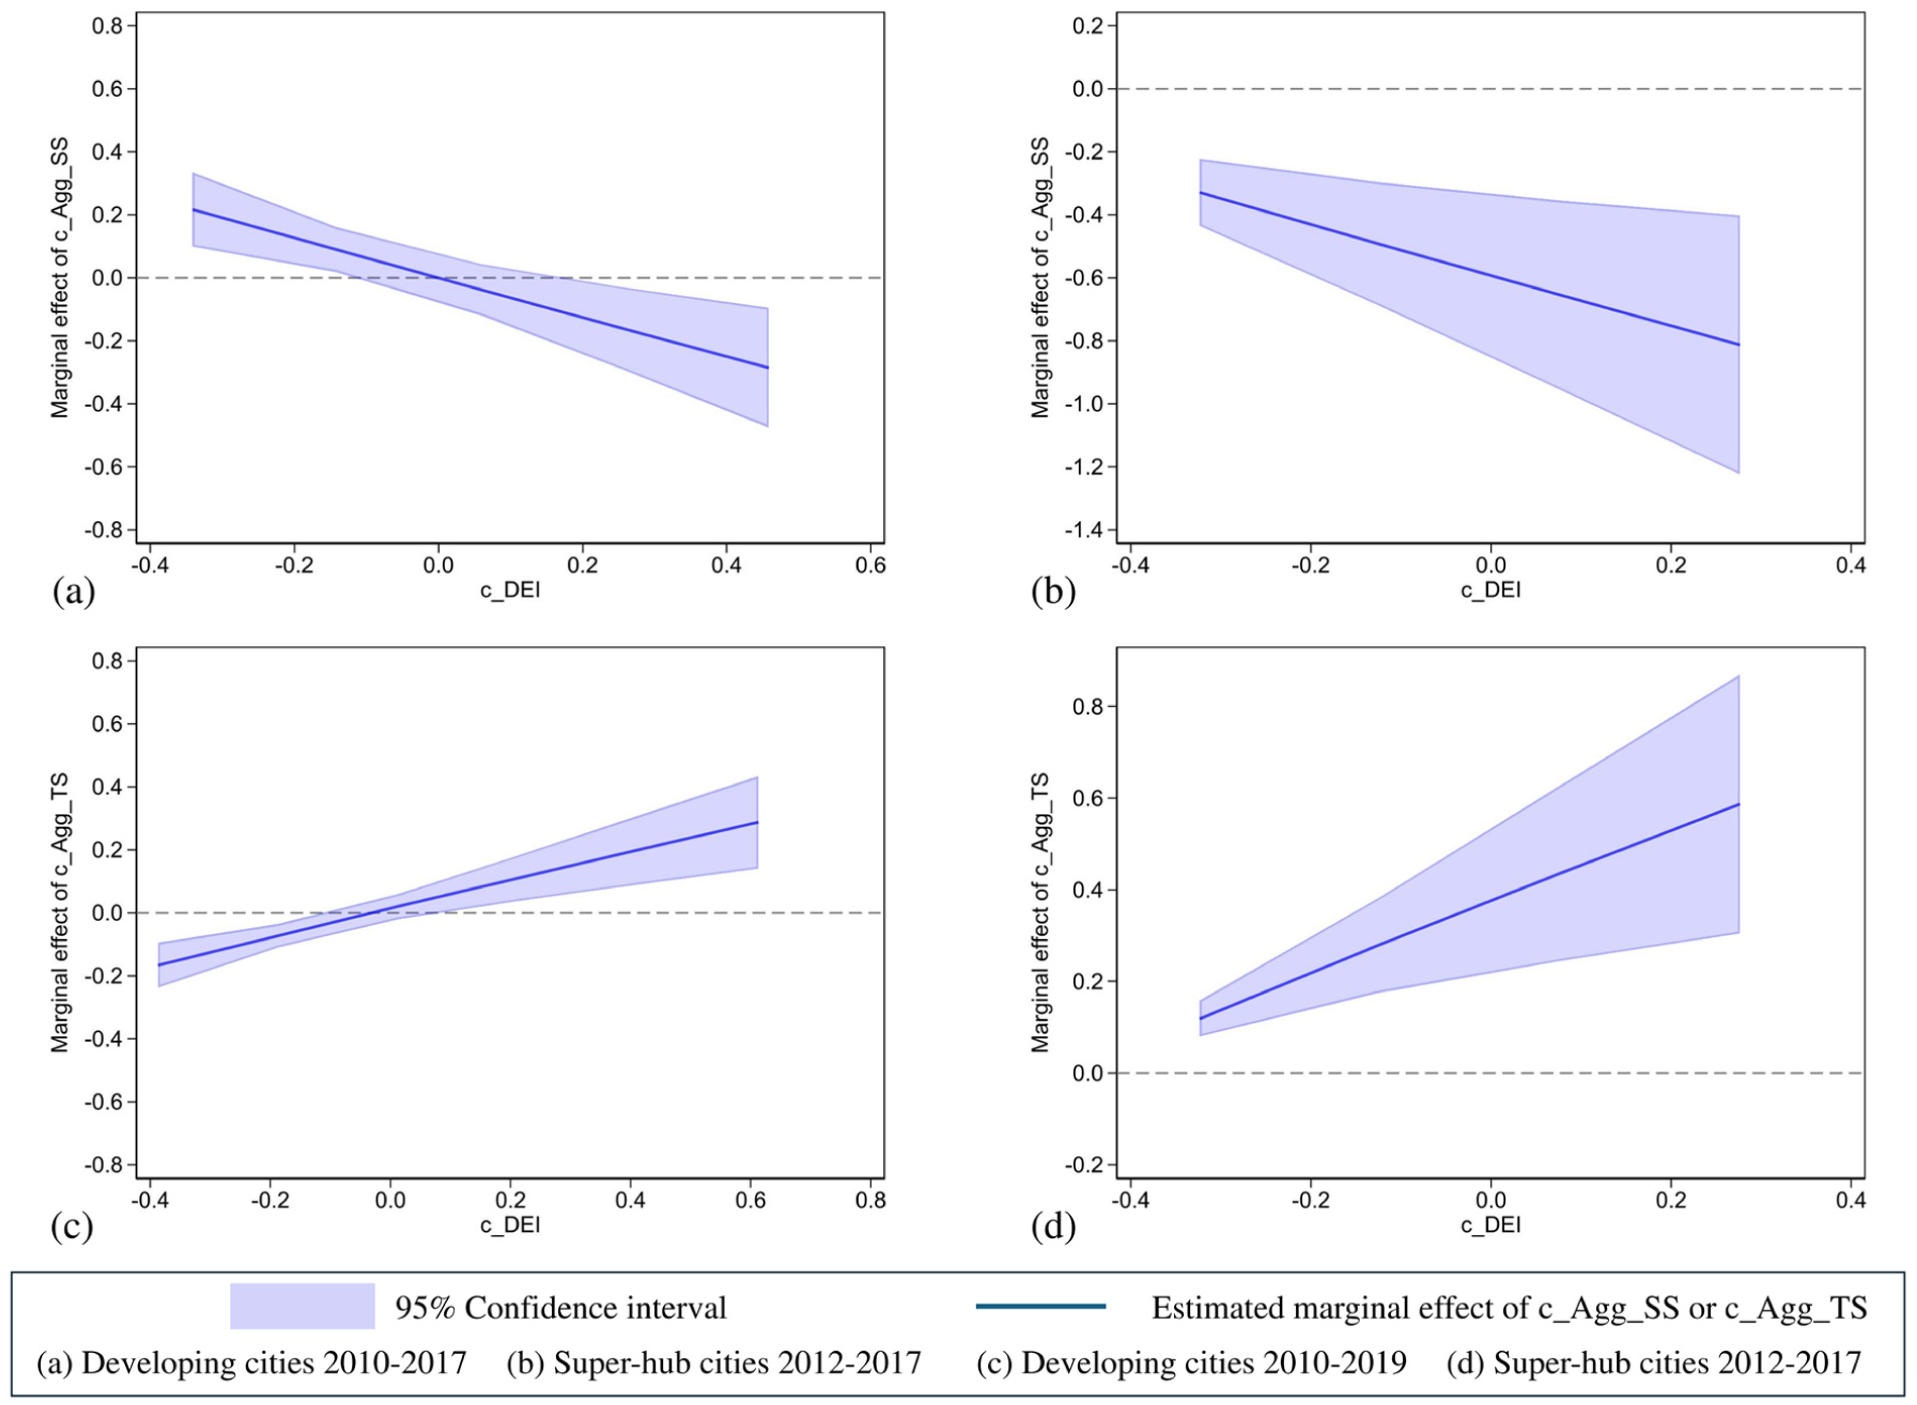
Marginal effects of industrial agglomeration on carbon emissions under digital economy moderation.
Regression Results of the Moderating Effect Model.

Note. The standard errors in this paper are all clustered robust standard errors clustered at the city level. Robust standard errors in parentheses.
p < .01, **p < .05, *p < .1. Variables prefixed with “c_” in the table indicate that the variable has been centered.
The column (1) shows that the coefficient of the interaction term between
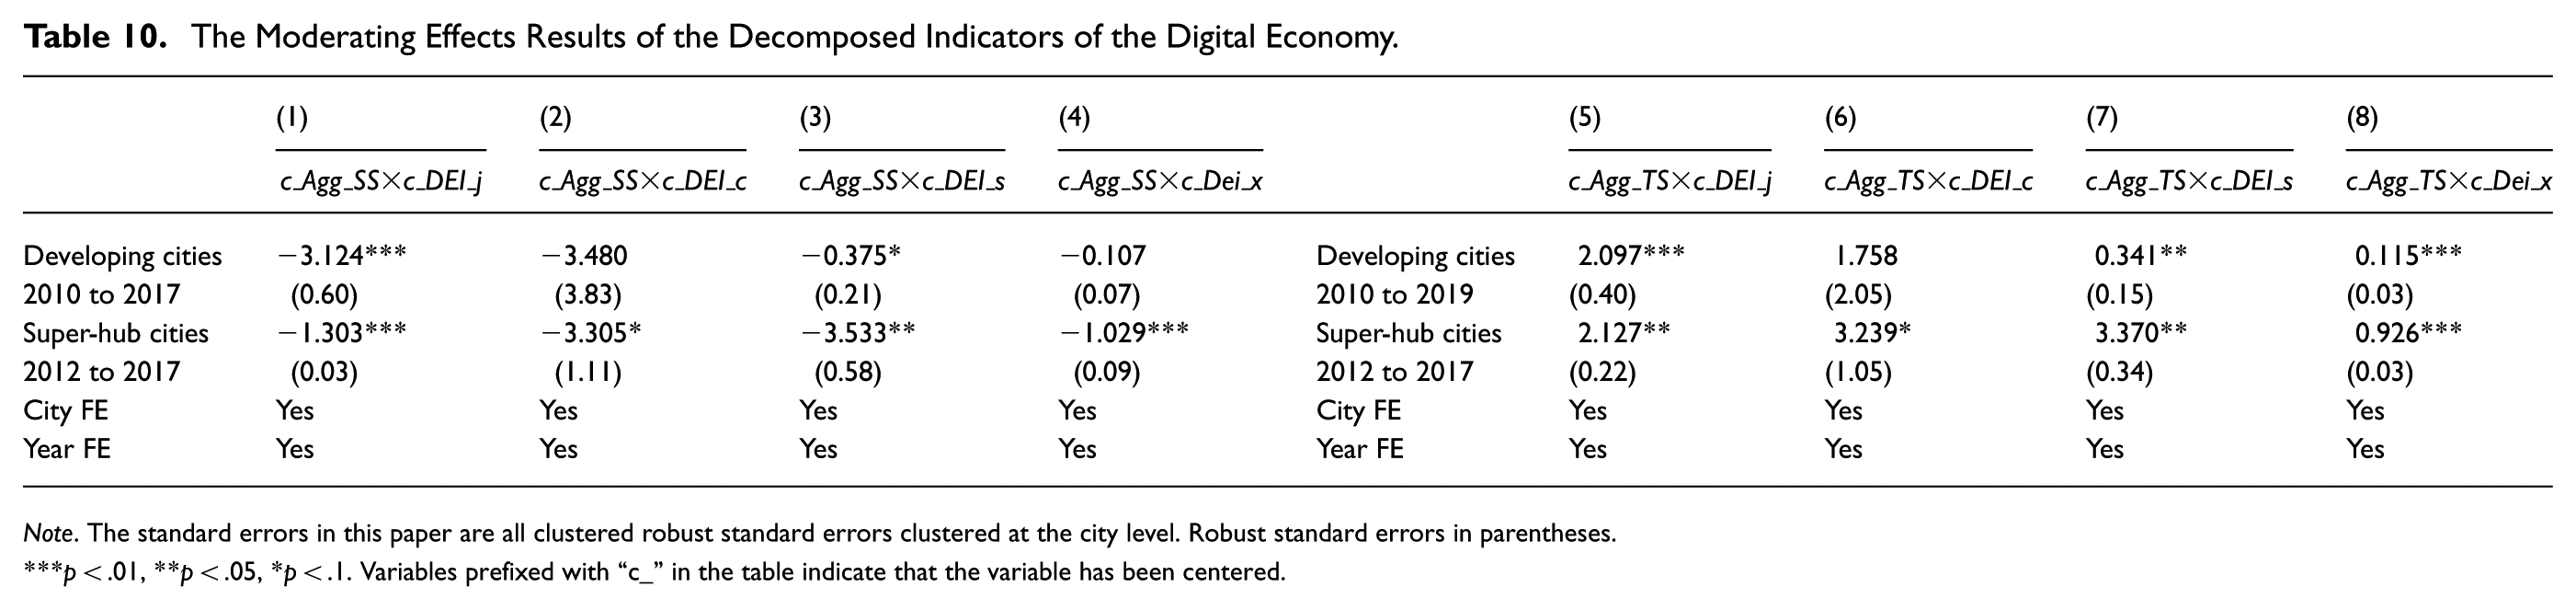
This study further disaggregates DEI into four secondary indices (Table 10): digital infrastructure level (
The Moderating Effects Results of the Decomposed Indicators of the Digital Economy.
Note. The standard errors in this paper are all clustered robust standard errors clustered at the city level. Robust standard errors in parentheses.
p < .01, **p < .05, *p < .1. Variables prefixed with “c_” in the table indicate that the variable has been centered.
From 2010 to 2017, the impact of
Discussion of Results
Discussion of Industrial Agglomeration’s General Effects on Carbon Emissions
The empirical results indicate that, when analyzing the entire sample of cities in the YRD over the study period, the agglomeration of the secondary sector increases carbon emissions. In contrast, the agglomeration of the tertiary sector reduces carbon emissions. These findings align with theoretical hypotheses H1a and H1b, and are respectively supported by relevant studies(D. Wang, Liu, & Cheng, 2023; Wu et al., 2024; X. Zhang, Pan, et al., 2023). Further heterogeneity analysis reveals distinct patterns in how industrial agglomeration impacts carbon emissions between super-hub cities and developing cities in the YRD. These findings suggest that the carbon emission effects of industrial agglomeration are influenced by uncontrolled factors in this study, such as variations in urban development strategies, policy implementation intensity, and macroeconomic and social conditions at different stages.
Discussion of Industrial Agglomeration’s Effects on Carbon Emissions in Developing Cities
In developing cities, the intensified impact of secondary sector agglomeration on carbon emissions from 2010 to 2017 aligns with the theoretical mechanism H2a, consistent with findings from Chen et al. (2022). Starting in 2010, the secondary sector in developing cities of the YRD remained predominantly focused on traditional manufacturing and heavy industry, which are characterized by high energy consumption. Furthermore, as noted in the literature (Yuan, Yang, et al., 2023), developing cities absorbed the transfer of some high-carbon industries from super-hub cities. Although national policies began emphasizing ecological civilization during this period, developing cities faced sharper trade-offs between environmental protection and growth, often favoring traditional economic priorities (Yuan, Li, et al., 2023). Consequently, the agglomeration of secondary sector in these cities led to increased carbon emissions through the combined effects of scale rebound, carbon lock-in, and a race-to-the-bottom dynamic.
However, in June 2018, China successively issued the Opinions of the Central Committee of the Communist Party of China and the State Council on Comprehensively Strengthening Ecological and Environmental Protection and Resolutely Fighting the Battle Against Pollution and the Three-Year Action Plan for Winning the Blue Sky Defense War. These policies designated the Yangtze River Delta (YRD) as a key region for promoting comprehensive pollution control and industrial upgrading in critical sectors. In 2019, the National Development and Reform Commission intensified the national level “dual control” assessment of total energy consumption and intensity. Many high-emission enterprises in developing cities of the YRD faced production suspensions or restrictions, alongside costly technological upgrades. Since 2018, cities such as Nantong, Yancheng, Zhenjiang, Taizhou in Jiangsu Province, along with Hefei and Wuhu in Anhui Province, experienced a decline in the number of industrial enterprises above a designated scale. Although less innovative in low-carbon technologies than super-hubs, these cities temporarily offset secondary agglomeration's carbon rise through strict governance like mandatory cleaner production technologies. This phenomenon weakened the 2010 to 2017 link between secondary agglomeration and rising carbon emissions, rendering it statistically insignificant in 2018 to 2019.
It is important to note that these environmental protection measures primarily targeted carbon emissions from the secondary sector, with relatively limited focus on the tertiary sector. As noted in the literature (Wu et al., 2024), the agglomeration of productive service industries has a significant carbon emission reduction effect. In developing cities, tertiary sector agglomeration driven by local consumption and low-emission basic services retains its carbon-reducing effect. Moreover, during this period, the population continued to concentrate in super-hub cities. Compared to the resource sharing, industrial optimization, and efficiency gains from tertiary sector agglomeration, the induced implicit consumption in developing cities stayed within a manageable range. Consequently, the carbon emission reduction effect of tertiary sector agglomeration in developing cities proved more resilient than the carbon emission increase associated with secondary sector agglomeration. This reduction effect persisted consistently from 2010 to 2019, aligning with theoretical hypothesis H2a.
Discussion of Industrial Agglomeration’s Effects on Carbon Emissions in Super-hub Cities
From 2012 to 2017, the carbon emission reduction effect of secondary sector agglomeration and the carbon emission increase effect of tertiary sector agglomeration in super-hub cities aligned with the expectations of theoretical hypothesis H2b. However, this pattern was absent in 2010 to 2011. During this period, secondary agglomeration in Shanghai and Nanjing increased from 0.74 and 0.87 to 0.83 and 0.89, while tertiary agglomeration fell from 1.32 and 1.16 to 1.23 and 1.15. This contrasts with the post-2012 trend of declining secondary and rising tertiary sector agglomeration. The reason may be that super-hub cities were still recovering from the 2008 financial crisis, with policies prioritizing traditional growth through infrastructure development.
From 2012 to 2017, secondary sector agglomeration in these cities exhibited a stable declining trend, closely linked to the policy window of China’s national ecological protection strategy. Numerous studies, including X. Zhang, Pan, et al. (2023) and X. Liu, Zuo, et al. (2024), have substantiated the emission reduction effects of environmental regulations on industrial agglomeration. In 2012, the 18th National Congress of the Chinese Communist Party established the strategy of ecological civilization construction, followed by the introduction of the Action Plan for Air Pollution Prevention and Control in 2013, which set the strictest environmental governance standards at the time. While these measures were not stringently enforced in developing cities, super-hub cities such as municipalities and provincial capitals were required to take the lead in implementation. Consequently, cities like Shanghai, Hangzhou, and Nanjing introduced a series of industrial structure adjustment plans. The secondary sector in these cities experienced rapid transformation and upgrading. Shanghai’s secondary sector agglomeration decreased from 0.866 to 0.582, Nanjing’s from 0.849 to 0.786, and Hangzhou’s from 0.968 to 0.857. The retained manufacturing industries in these cities predominantly consisted of high-value-added, low-energy-consumption advanced manufacturing. By 2017, high-tech industries account for 45.89% of industrial output in Nanjing and 50% in Hangzhou. At the same time, these cities continued to invest in technological innovation, phased out outdated production capacity in heavy and chemical industries, and reduced total coal consumption. As highlighted in the literature (Luo et al., 2024), the robust technical resources and innovation networks enabled super-hub cities to achieve carbon emission reductions through secondary sector agglomeration.
The early completion and stabilization of secondary sector transformation not only insulated hub cities from the impacts of stricter national environmental policies in 2018 but also led to a diminishing marginal effect of carbon emission reductions from secondary sector agglomeration after 2018. This trend may be linked to the observation in the literature (Dong et al., 2020) that, as industrial gradient transfers were largely completed, overall disparities in secondary sector within this region narrowed. Consequently, the carbon emission reduction benefits of secondary sector agglomeration became less pronounced after 2018, highlighting the need for further efforts to deepen low-carbon emission reductions in super-hub cities. It is noteworthy that the decline in secondary sector agglomeration in super-hub cities is partly attributed to the study’s reliance on employment metrics to measure agglomeration. This approach may overlook the effects of capital agglomeration or the broader, high-quality development of secondary sector agglomeration, including factors such as technological sophistication, environmental protect performance, and the shift toward high-value-added industries.
In 2012, the tertiary sector accounted for 60.45% of the economy in Shanghai, 50.94% in Hangzhou, and 53.4% in Nanjing, indicating a relatively mature stage of development. The consistently high population density in these super-hub cities provided a vast market and labor force for tertiary sector growth. The continuous rise in urban hierarchy, along with the rapid expansion of super-tall buildings and civilian construction areas, contributed to an overall upward trend in carbon emissions. The agglomeration of service industries, such as tourism, catering, and entertainment, resulted in a surge in energy consumption, contributing to increased implicit carbon demand. Consistent with the literature, the negative externalities of industrial agglomeration dominate in regions with high-quality economic development, with energy consumption effects and population congestion effects being the primary drivers of intensified carbon emissions (Q. Shen et al., 2023).
However, after 2018, infrastructure in these cities approached saturation, and the focus shifted to promoting job-housing balance and polycentric distributed urban layouts. The adoption of green building standards, which emphasize higher energy efficiency, helped partially mitigated the increase in carbon emissions. Moreover, heightened awareness of low-carbon consumption in super-hub cities led to a plateauing or even peaking trend in carbon emissions. These factors likely contributed to the statistically insignificant net impact of tertiary sector agglomeration on carbon emissions in 2018 to 2019. This also signifies that these cities have successfully transitioned beyond the initial stage of achieving emission reductions through industrial structure adjustments, entering an advanced stage where economic development is decoupled from carbon emissions through comprehensive green technological innovation and deeper integration.
Discussion of the Digital Economy’s Moderating Effect on Carbon Emissions from Industrial Agglomeration
The study indicates that the digital economy has mitigated the carbon emission pressure resulting from secondary sector agglomeration, while exacerbating the negative carbon impact of tertiary sector agglomeration in both developing and super-hub cities. Additionally, unlike existing literature that combines the digital economy into a single composite indicator (Hao et al., 2022; L. Ma et al., 2023; C. Wang, Zhang, et al., 2023; W. Zhang, Sun, et al., 2022), this study provides a more nuanced analysis by examining the moderating effects of various dimensions of the digital economy. These findings align with theoretical hypothesis 3a and 3b, offering detailed insights into the moderating role of the digital economy.
The growth of the digital economy, in both developing and super-hub cities, enhances energy efficiency in traditional manufacturing, optimizes production processes, and reduces unnecessary resource consumption. Furthermore, it facilitates efficient coordination across various stages of the industrial chain, significantly alleviating the carbon emission associated with secondary sector agglomeration. These findings are consistent with the results of Zeng and Yang (2023) and Lin (2024). More notably, this study reveals that cities with a higher level of digital economy development exhibit a stronger marginal effect on mitigating carbon emissions from secondary sector agglomeration. In some cases, this effect reaches a threshold where the carbon emission increase in developing cities is reversed into a carbon reduction. These findings are corroborated by studies on the inverted U-shaped relationship between industrial agglomeration and carbon emissions, such as Hou et al.(2023), Fu and Wang (2024), Q. Wang et al. (2024), and Z. Ma et al.(2025). In contrast, the deep integration of the digital economy with tertiary sector agglomeration exacerbates the negative carbon emission impacts. This conclusion aligns with the findings of Zhu and Lan (2023).
The conclusions of moderating effect also apply to the various dimensions of the digital economy. The study not only focuses on how digital infrastructure enhances the efficiency of carbon emission reduction (Hao et al., 2022; Y. Liu, Zhang, & Shen, 2024), but also finds that, digital infrastructure in developing cities exerts a stronger moderating effect on carbon emissions from secondary sector agglomeration. This is likely due to the relatively weaker digital infrastructure in developing cities, whereas super-hub cities with more advanced digital infrastructure experience diminishing marginal returns in their moderating effects. The limited moderating effect of digital industrialization on carbon emissions from both secondary and tertiary sector agglomeration in developing cities may be attributed to path dependence in production and consumption patterns. Insufficient integration of the digital economy with physical industries, including manufacturing and producer services, leads to slow progress in digital transformation for carbon reduction. Similarly, the lack of significant impact of digital innovation on carbon emissions from secondary sector agglomeration in developing cities may stem from inadequate innovation foundations, making it difficult to translate into notable carbon reduction outcomes in the short term. This is corroborated by analysis of B. Liu and Fang (2025), which confirms that neglecting research and innovation in digital technology for green development can lead to increased carbon emissions. The significant moderating effect of industrial digitization aligns with the perspective of W. Zhang, Sun, et al.(2023), who argue that the digital and intelligent integration of production and consumption improves economic efficiency and resource use, reducing carbon emissions and environmental pollution.
The significant moderating effects of each digital economy dimension on carbon emissions from both secondary and tertiary sector agglomeration in super-hub cities may be likely result from technical spillovers driven by the high-density aggregation of talent and enterprises (R. Li et al., 2025). Additionally, the deep integration of digital infrastructure with industries creates synergistic effects. The stronger moderating effects of digital industrialization and industrial digitization are attributed to their well-developed digital industrial chains, which enable rapid digital penetration. Consequently, the digital transformation and application in high-end services and advanced manufacturing are more profound. This is consistent with findings from H. Zhang, Qi, et al.(2024), which highlights the diverse impacts of the digital economy, with more pronounced effects in central cities. Similarly, J. Wang et al. (2022) suggests that ICT industrial agglomeration can positively influence carbon emissions by expanding economic scale, even in cities with high carbon emissions. H. Wang, Yang, and Yue (2023) indicated that the large-scale deployment of digital infrastructure can lead to increased energy demand, ultimately resulting in higher carbon emissions. These studies partially support our conclusion that the digital economy amplifies the negative carbon emission effects of tertiary sector agglomeration.
Conclusions and Policy Recommendations
Conclusions
This study focuses on the Yangtze River Delta region, comprehensively examining the impact of secondary and tertiary sector agglomeration on carbon emissions across different city types from 2010 to 2019, as well as the moderating role of the digital economy. The findings indicate that secondary sector agglomeration generally increases carbon emissions, while tertiary sector agglomeration reduces them, with notable urban heterogeneity and temporal dynamics. In developing cities, the carbon emission intensification effect of secondary sector agglomeration was pronounced from 2010 to 2017. Meanwhile, the carbon reduction effect of tertiary sector agglomeration persisted from 2010 to 2019, but it was weaker than the emission increase from secondary sector agglomeration. In contrast, super-hub cities exhibited a reverse trend from 2012 to 2017, with secondary sector agglomeration reducing carbon emissions and tertiary sector agglomeration increasing them. Due to the influence of uncontrolled factors such as urban development strategies and policy implementation intensity, the statistical effects were insignificant in certain years. The digital economy mitigated carbon emission pressures from secondary sector agglomeration but exacerbated the negative carbon impact of tertiary sector agglomeration in both city types. In developing cities, only digital infrastructure and industrial digitization showed significant moderating effects on carbon emissions from secondary sector agglomeration. Moreover, digital infrastructure had a stronger effect than in hub cities. Digital industrialization had no notable moderating effect on carbon emissions from tertiary sector agglomeration. In super-hub cities, all four dimensions of the digital economy exhibited significant moderating effects, with digital industrialization and industrial digitization being particularly prominent.
The above findings suggest that the development of the digital economy does not universally exert a positive effect on the carbon emissions of industrial agglomeration. Nor does it necessarily surpass the inflection point of the U-shaped Environmental Kuznets Curve. Instead, it is the result of the synergistic evolution within a complex system comprising urban industrial characteristics, developmental stages, and institutional environments. This study challenges the notion of “technological determinism” to some extent, emphasizing the question: “Under what socioeconomic conditions, through what mechanisms, and in relation to which types of industrial agglomeration does the digital economy impact carbon emissions?” The proposed framework, which integrates the moderating mechanisms of the digital economy, industrial agglomeration, and carbon emissions, along with urban hierarchy and context-specific interaction patterns, can serve as a reference for analyzing carbon emission effects in other rapidly digitizing regions. For cities embedding carbon constraint mechanisms and digital carbon footprint monitoring systems at the early stages of industrial agglomeration, it is possible to avoid the path dependence observed in the surge of carbon emissions from secondary sector agglomeration in YRD developing cities between 2010 and 2017. Additionally, it can help prevent the carbon emission rebound trap experienced in super-hub cities from 2017 to 2021.
Policy Recommendations
To fully leverage the digital economy's positive impact on carbon emission reduction through secondary and tertiary sector agglomeration, develop a dedicated plan for the synergistic advancement of digitalization and green transformation. This plan should clearly differentiate emission-reduction responsibilities across cities and departments, thereby elevating the overall level of green, low-carbon development in the YRD. Promote orderly cross-regional industry relocation and bidirectional flows of production factors to foster rational division of labor and coordinated regional development. Capitalize on the strengths of the Shanghai Data Exchange, the Yangtze River Delta Data Element Circulation Service Platform, and the data center clusters in the Integrated Development Demonstration Zone and Wuhu to accelerate data element market interconnectivity. Establish cross-departmental mechanisms for collaborative carbon emission regulation and refine a digital carbon management and emission-reduction standards system. Disseminate best practices, facilitate mutual learning, and promote technology transfer and knowledge spillovers.
To curb rising carbon emissions from secondary industry agglomeration in developmental cities while sustaining emission-reduction advantage in super-hub cities, this study proposes the following recommendations. All cities should tailor incentives for projects such as smart manufacturing, digital transformation, and clean energy adoption according to their fiscal capacity, including subsidies, tax incentives, green financing, and performance-based rewards. Developing cities should prioritize investment in digital upgrades of critical infrastructure, such as energy, transportation, water conservancy, logistics, and environmental protection. Efforts should focus on nurturing digital innovation entities, boost research and development, and attracting innovative talent to enable coordinated digital-green transformation of traditional industries. Enhance industrial chain collaboration to stimulate the vitality of leading enterprises and small-to-medium enterprises. Optimizing production processes with technologies such as digital twins, artificial intelligence, big data analytics, and sensors. Super-hub cities must tighten controls on major pollutant emissions and enforce “dual control” of energy consumption and intensity, while advancing industrial digitalization toward deep intelligentization. Accelerate industrial internet integration with smart monitoring to digitize the full lifecycle in research and development, manufacturing, operations management, and market services. Prioritize breakthrough carbon-reduction technologies and promote high-tech and strategic emerging industries to form world-class green industrial clusters.
To counter the digital economy's adverse effects on tertiary sector emissions in developing cities and curb rising emissions in super-hub cities, the following measures are proposed. Offer differentiated electricity pricing incentives and prioritized computing resource allocation to low-PUE (Power Usage Effectiveness) data centers. Provide financial rewards to data centers undertaking green retrofit projects, including energy-saving, liquid cooling, water-saving, and renewable energy use. Target 80% green electricity in new centers, establish “green computing” certification, and gradually increase renewable energy share to cut power use and indirect emissions. Promote intelligent transportation systems, green building standards, and smart municipal utilities. Provide subsidies, such as digital service vouchers, and loan incentives for projects in smart commercial districts, green hotels, smart property management, digital cultural tourism and intelligent green warehousing. Deepen digital-green integration in finance, logistics, culture, sports, and other sectors for refined management. Launch carbon-neutral pilot zones, zero-carbon parks, and low-carbon communities to innovate urban governance. Refine the “digital carbon inclusivity” mechanism in social services by leveraging big data, blockchain, AI, and IoT to create accounts for individuals, communities, small and micro enterprises, and various organizations, incentivize low-carbon behaviors, and foster a smart, shared, sustainable consumption lifestyle.
Limitations and Future Research Directions
This study comprehensively examines the heterogeneous moderating mechanisms of the digital economy on the carbon emission effects from secondary and tertiary sector agglomeration in the YRD. Nevertheless, there are still a few limitations that should be acknowledged. First, the characteristics of the data sample, drawn from the YRD during a specific period, may limit the external validity and cross-regional applicability of the findings. This study primarily relies on city-level macro-statistical data, lacking micro-level enterprise digitalization data. This restricts the in-depth analysis of heterogeneous carbon emission behaviors across industries and enterprises. Second, to simplify the analytical framework, the study adopts broad classifications of secondary and tertiary sectors, without delving into their internal structural differences, such as those between high-energy-consuming manufacturing and advanced manufacturing, or between producer services and consumer services. This may obscure more nuanced mechanisms. Although this study detects phased anomalies and offers preliminary explanations for the complex reasons behind such temporal heterogeneity, the short observation period limits thorough and precise analysis of long-term evolution trends.
To overcome these limitations, future research should expand the sample to include more urban agglomerations for cross-regional and cross-developmental-stage comparative studies, or even conduct cross-national analyses. It should also extend the observation period and integrate multi-source data. Apply targeted spatial and network analysis to offer more valuable insights from macro, micro-enterprise, and spatial perspectives. Adopt a more detailed industry classification system to better characterize the carbon emission profiles of different industries. Investigate their differential responses to the digital economy and elucidate the potential nonlinear relationships and mediating mechanisms among these factors. To address the temporal heterogeneity induced by specific shocks, future studies could identify more precise proxy variables and employ regression discontinuity designs or multiple difference-in-differences methods to strengthen causal identification.
Footnotes
Ethical Considerations
Informed consent was not required for this study The research utilized publicly available and aggregated data (e.g., carbon emissions, industrial agglomeration, and digital economy indicators) from the Yangtze River Delta urban agglomeration, with no direct interaction with human participants or collection of identifiable private information.
Funding
The authors disclosed receipt of the following financial support for the research, authorship, and/or publication of this article: This research was funded by Humanities and Social Science Fund of Ministry of Education of China [award number: 22YJA630096,20YJC630108].
Declaration of Conflicting Interests
The authors declared no potential conflicts of interest with respect to the research, authorship, and/or publication of this article.
Data Availability Statement
All data are collected from publicly available sources. The data that support the findings of this study are available from the corresponding author, upon reasonable request.