
Abstract
This study investigates the impact of Smart Environmental Monitoring Platforms (SEMPs) on corporate pollution emissions in China. We use the staggered provincial rollouts of SEMPs from 2017 to 2024 as a quasi-natural experiment and apply a difference-in-differences approach to identify causal effects. The findings indicate that SEMPs reduce corporate pollution emissions by curbing environmental greenwashing and stimulating green innovation. This effect is more pronounced for non-state-owned enterprises, small and medium-sized firms, financially constrained firms, and firms characterized by dispersed ownership, low managerial ownership, and low audit quality. Moreover, stronger regulatory intensity and more developed green finance further amplify this effect.
Plain Language Summary
Exploiting the staggered provincial rollouts of SEMPs between 2017 and 2024 as a quasi-natural experiment, we employ a difference-in-differences approach to estimate causal effects. The results show that SEMPs significantly reduce corporate pollution emissions. Mechanism tests reveal two channels: constraining environmental greenwashing and enhancing firms’ green innovation. Amplification analyses indicate that these effects are stronger in regions with higher regulatory intensity and deeper green finance development. Heterogeneity results further demonstrate that non-state-owned enterprises, small and medium-sized firms, financially constrained firms, and firms characterized as dispersed ownership, low managerial ownership, and low audit quality experience more pronounced reductions.
Introduction
Despite continuous efforts to control air pollution, China still faces several shortcomings, including limited real-time monitoring capacity, fragmented data systems, and insufficient enforcement transparency. To address these shortcomings, China has rapidly developed and implemented Smart Environmental Monitoring Platforms (SEMPs). These systems integrate continuous emission monitoring (CEMS), satellite remote sensing, air-quality networks, and big data analytics into a real-time and tamper-proof database. By linking monitoring, early warning, and enforcement, SEMPs mark a transition from firm self-reporting to automated third-party data collection and from ex post investigation to real-time enforcement (Shimshack & Ward, 2008). Building on this institutional transformation, the Ministry of Ecology and Environment (MEE) has embedded SEMPs into China’s national environmental policy framework. Since 2017, the MEE has required the direct transmission of monitoring data from key polluters and has established national platforms for pollution permits and environmental big data. By 2023, more than 80,000 online monitoring devices and 20,000 air-quality stations were in operation nationwide, making SEMPs a cornerstone in China’s modernization of environmental governance.
Despite their rapid expansion, evidence on how SEMPs affect corporate pollution emissions remains limited. Existing research has focused on three related areas. First, studies on environmental information disclosure suggest that transparency can lower emissions by strengthening reputational and market pressures (D. M. Christensen, Serafeim, & Sikochi, 2022; H. B. Christensen, Floyd, et al., 2022; M. Khanna, Quimio, & Bojilova, 1998; T. Khanna, Gulati, & Nohria, 1998). Yet unverifiable or self-reported disclosure often facilitates symbolic compliance and greenwashing, thereby weakening the credibility of disclosure-based regulation (Battisti et al., 2025; Delmas & Burbano, 2011). Second, studies on digital monitoring technologies report that continuous emission monitoring systems (CEMS), satellite sensing, and IoT applications enhance the accuracy and timeliness of pollution control (P. Kumar, Morawska, et al., 2015; S. Kumar, Ahlawat, et al., 2015; Kaginalkar et al., 2022). However, most studies examine these tools in isolation rather than as components of integrated institutional platforms that connect monitoring data with enforcement and governance processes. Third, institutional and market perspectives highlight the roles of regulatory pressure and financial incentives in shaping firms’ environmental behavior (Becker, 1968; DiMaggio & Powell, 1983; Ji & Feng, 2025; Ma et al., 2025). Nevertheless, few studies have explored how these factors operate as complementary amplifiers of digital environmental governance, jointly enhancing the effectiveness of monitoring-based regulation.
Against this backdrop, this study addresses three core questions. First, do SEMPs effectively reduce corporate pollution emissions? Second, through which mechanisms do SEMPs influence firms’ environmental behavior? Third, under what institutional and market conditions are these effects amplified?
To address these questions, we exploit the staggered provincial rollout of Smart Environmental Monitoring Platforms (SEMPs) between 2017 and 2024 as a quasi-natural experiment. Using a difference-in-differences (DID) model, we find that SEMPs significantly reduce firms’ pollution emissions by curbing environmental greenwashing and promoting green innovation. This effect is more pronounced for non-state-owned enterprises, small and medium-sized firms, financially constrained firms, and firms characterized by dispersed ownership, low managerial ownership, and low audit quality. Moreover, stronger regulatory intensity and more developed green finance further amplify this effect.
This study offers three main contributions. First, it conceptualizes SEMPs as a RegTech-based institutional innovation, extending institutional theory to digital environmental governance and revealing how algorithmic supervision institutionalizes regulatory compliance. Second, it develops and empirically validates a framework that links SEMPs to curbing greenwashing, enhancing corporate green innovation, and amplifying regulatory effects through institutional and market environments, providing firm-level evidence of how digital regulation reshapes environmental behavior. Third, it presents quasi-experimental evidence from China, offering insights for other emerging economies seeking to design real-time, data-driven environmental governance systems and demonstrating the global relevance of digital regulatory innovations.
The remainder of the paper is organized as follows. Section “Theoretical Analysis and Research Hypotheses” develops the theoretical framework and research hypotheses. Section “Research Design” describes the empirical design. Section “Empirical Tests Results” reports the main results; Section “Mechanism Tests and Heterogeneity Checks” explores mechanisms and heterogeneity; and Section “Conclusions and Implications” concludes with policy implications.
Theoretical Analysis and Research Hypotheses
Pollution Emission Reduction Effect
SEMPs integrate data from CEMS, satellite sensing, and energy systems to create a real-time feedback loop between firms and regulators. This digital linkage transforms environmental supervision from periodic checks into continuous monitoring. It embeds oversight into daily production rather than relying on post-event correction. As a result, compliance becomes part of operational design rather than an external requirement.
From an institutional perspective, constant data visibility creates sustained coercive pressure. Firms are under continuous observation, and compliance expectations become part of daily management. Over time, regulation shifts from external enforcement to internalized governance (Gray & Silbey, 2014). This institutional shift reshapes the information architecture of regulation. Traditionally, firms could delay or distort reports because enforcement relied on ex post verification. SEMPs close this gap by transmitting and cross-checking data in real time, transferring informational power from firms to regulators. Greater transparency alters firms’ strategic choices. When concealment becomes riskier, cleaner technologies turn into rational investments. Consistent with the Porter Hypothesis, credible and continuous regulation converts compliance into innovation (Testa et al., 2011), enabling firms to enhance efficiency and achieve sustained emission reductions. Accordingly, we propose:
Greenwashing Reduction Mechanism
SEMPs replace self-reported disclosures with continuous, multi-source monitoring integrated into enforcement systems. This transformation increases the probability of detection and the speed of sanction, raising the cost of information manipulation and leaving little space for “talk-more-do-less” behavior. Evidence from Chinese pilot programs supports this mechanism, showing that SEMPs curb greenwashing by converting narrative disclosures into verifiable data (D. M. Christensen, Serafeim, & Sikochi, 2022; H. B. Christensen, Floyd, et al., 2022; Han et al., 2025).
From an institutional perspective, persistent data visibility imposes coercive and normative pressures that align firms’ environmental communication with actual performance, thereby internalizing credibility as a condition of legitimacy (DiMaggio & Powell, 1983; Kostova et al., 2008). At the information level, SEMPs reduce asymmetry between regulators and firms by replacing unverifiable reports with machine-recorded evidence, thereby enhancing transparency and accountability while discouraging symbolic behavior (Delmas & Burbano, 2011; Lyon & Maxwell, 2011). As truthfulness becomes observable and falsification increasingly costly, reputational signaling loses its value. Firms redirect resources from impression management to substantive environmental improvement, turning disclosure credibility into a sustained source of competitive legitimacy.
Green Investment Promotion Mechanism
The operation of SEMPs transforms environmental regulation from a reactive monitoring regime into a self-reinforcing system of institutional learning. Under continuous data tracking and enforcement certainty, firms experience not only immediate compliance pressure but also a gradual process of institutional adaptation, which reshapes their investment logic. From an institutional perspective, SEMPs digitize the coercive, normative, and cognitive pillars of governance (DiMaggio & Powell, 1983). By embedding regulatory visibility, peer comparison, and data-based legitimacy into managerial routines, they convert compliance into an endogenous expectation of responsible conduct. Thus, SEMPs function as a digital institutional field that continually updates behavioral norms and incentive boundaries. From an information-economics standpoint, continuous verification reduces information rents from opportunism and transforms hidden environmental risks into observable credit signals (Healy & Palepu, 2001). Over time, transparency creates market-discipline externalities, enabling investors and supply-chain partners to price environmental credibility into contracts. This restructured institutional and informational environment activates the innovation-compensation mechanism predicted by the Porter Hypothesis (Porter & van der Linde, 1995). When enforcement is credible and information reliable, firms can anticipate policy trajectories and shift resources from short-term abatement to long-term capability building. Through this process, they develop dynamic capabilities that sustain green investment and innovation over time (Ambec et al., 2013). Therefore, the third hypothesis is as follows.
Amplification Mechanisms of Institutional and Market Environments
The governance effect of SEMPs depends not only on their technical design but also on the institutional and market contexts in which they operate. On the institutional side, the strength of deterrence determines whether digital monitoring translates into sustained behavioral change. Enforcement reach refers to the timeliness and coverage of data transmission to regulators, while penalty certainty captures the likelihood and severity of sanctions. Together, they define coercive pressure. According to deterrence theory, higher detection probability and sanction certainty enhance regulatory credibility (Becker, 1968; Shimshack & Ward, 2008). When SEMPs are embedded in regions with effective enforcement systems, digital signals are backed by credible threats, transforming short-term compliance into long-term capability building (Potoski & Prakash, 2005).
On the market side, green finance acts as a complementary amplifier. Instruments such as green credit, bonds, and insurance link verified environmental performance to financing costs (Flammer, 2021; Tang & Zhang, 2020). By improving the authenticity and verifiability of environmental data (D. M. Christensen, Serafeim, & Sikochi, 2022; H. B. Christensen, Floyd, et al., 2022), SEMPs allow capital markets and supply chains to reward genuine green performance and penalize symbolic behavior. In this way, market valuation mechanisms internalize environmental credibility, thereby raising the economic return to green investment (Krueger et al., 2020). Hence, we obtain:
Research Design
Data
In September 2016, the State Council initiated reforms to centralize environmental monitoring authority, which was followed by the 2017 revision of the disclosure guidelines issued by the China Securities Regulatory Commission, standardizing environmental information reporting for listed firms. To avoid potential confounding effects from these institutional reforms, this study focuses on Chinese A-share listed industrial firms during 2017 to 2024. Given that provincial pilot programs of smart environmental monitoring constitute the core tier of China’s digital monitoring reform, we exclude firms located in municipal pilot regions and those designated as “ST” due to financial distress.
The main data sources include the China Stock Market and Accounting Research (CSMAR) database, the China Research Data Service (CNRDS), and the China Environmental Statistics Yearbook. Firm-level environmental disclosure texts were combined with financial and emissions data to construct the variables of interest. A winsorization procedure was applied to continuous variables at the 1% upper and lower limits to mitigate the influence of outliers. The final sample comprises 18,788 firm–year observations spanning 2017 to 2024.
Variables
Firm Pollution Emission
To comprehensively measure firm-level pollution emissions, this study constructs a composite pollution emission index following prior research. The original emission data cover seven types of pollutants: for water pollution, chemical oxygen demand (COD), ammonia nitrogen, total nitrogen, and total phosphorus; for air pollution, sulfur dioxide (SO2), nitrogen oxides (NOx), and smoke dust. The construction proceeds as follows. First, the emission volume of each pollutant is winsorized and standardized to obtain the normalized emission of pollutant k for firm i in year t, denoted as

where
Smart Environmental Monitoring Platform
The national Scheme designated 13 provinces and 16 municipalities as pilot regions for smart environmental monitoring, with differentiated objectives across administrative levels. Provincial pilots are designed to serve as the core tier, strengthening top-level design, enabling cross-level data integration, and supporting macro- and meso-level environmental governance. By contrast, municipal pilots focus primarily on operational monitoring and enforcement at smaller scales, providing complementary functions in regulatory supervision and emergency response. Since the end of 2020, municipal monitoring authority has been transferred to provincial governments, further consolidating the central role of provincial pilots in data integration and digital environmental management (Yang et al., 2024).
Accordingly, this study defines the 13 provincial pilots as the treatment group, while other provinces constitute the control group. To avoid identification bias, firms located in the 16 municipal pilot regions are excluded from the sample. The policy variable SEMP is captured by the interaction term treat × post, where treat equals one if a firm is located in a provincial pilot region and zero otherwise. Recent methodological work recognizes that in many DID applications, treatment exposure may not be binary but vary in intensity or timing (Callaway et al., 2024; d’Haultfoeuille et al., 2022). In line with this, and considering that the SEM policy in this study came into effect mid-year (July 2022), we assign post = 0.5 for 2022 to reflect partial exposure. We also conduct robustness checks using a binary post (0/1) specification. ecting mid-year implementation), one for 2023 to 2024, and zero otherwise.
Mechanism Variables
(1) Firm Greenwashing
Following Hu et al. (2023), this study measures firms’ greenwashing behavior by jointly capturing their symbolic environmental disclosure and actual environmental performance. Specifically, we construct two indicators: Oral (verbal publicity) and Actual (environmental outcome).
To quantify Oral, we first build a lexicon of environment-related expressions, including terms such as “green,”“environmental protection,”“low-carbon,” and “ecology.” For each firm-year observation, we calculate the frequency of these keywords appearing in the Management Discussion and Analysis (MD&A) section of annual reports. The dummy variable Oral equals one if the frequency exceeds the industry–year median, and zero otherwise.
The indicator Actual reflects whether the firm has been subject to administrative penalties for environmental violations. According to the public enforcement records disclosed by the Ministry of Ecology and Environment and its local branches, a value of one is assigned if a firm receives environmental punishment in a given year, and zero otherwise. Based on the combination of these two dimensions, corporate greenwashing (Greenwashing) is defined as follows:

(2) Corporate Green Innovation
Following Li et al. (2025), we measure corporate green innovation by taking the natural logarithm of one plus the number of green patent applications filed by each firm in a given year. Specifically, we manually collect data on patent applications, authorizations, and International Patent Classification (IPC) codes of listed firms from the official database of the State Intellectual Property Office of China (SIPO). These firm-level patent records are then matched with the IPC codes defined in the World Intellectual Property Organization (WIPO)’s Green Inventory of International Patent Classifications released in 2010. This matching process enables us to identify and count the number of green patents obtained by each firm annually, which serves as the basis for constructing the green innovation indicator.
Amplifier Variables
(1) Regulation Intensity
Following Chen et al. (2018), the government environmental governance index is constructed through the following steps. First, we manually collect the government work reports of 31 provinces in China for the period 2017 to 2024. Second, the textual content of each report is segmented into individual words using text-mining techniques. Finally, we calculate the frequency of environment-related terms and compute their proportion relative to the total word count of the report. The environment-related vocabulary includes terms such as environmental protection, pollution, energy consumption, emission reduction, waste discharge, ecology, green, low carbon, air, chemical oxygen demand, sulfur dioxide, carbon dioxide, PM10, and PM2.5.
(2) Regional Green Finance
China’s green finance system encompasses multiple components, including credit, investment, securities, insurance, and carbon finance. To capture its multidimensional nature, we construct a provincial-level green finance index using the entropy weighting method across five sub-indicators: (i) green credit proxied by the ratio of interest expenses of energy-intensive enterprises, inversely reflecting credit availability; (ii) green investment measured by the share of local government environmental expenditure in total fiscal expenditure; (iii) green securities represented by the market capitalization share of energy-saving and environmental protection firms; (iv) green insurance approximated by the ratio of agricultural insurance premium income to property insurance premium income; and (v) carbon finance captured by CO2 emissions per unit of GDP, inversely reflecting regional financial development. Data for these indicators are obtained from the China Statistical Yearbook, China Industrial Statistical Yearbook, the RESSET Financial Database, and the CEADs Carbon Emission Accounts and Datasets.
Following the entropy method, the construction proceeds in four steps.
First, to eliminate dimensional inconsistencies among indicators, all variables are normalized using the min–max standardization. For positive indicators:

and for negative indicators:

Second, the proportion of province i under indicator j is calculated as

and the information entropy of indicator j is obtained by

where k = 1/ln(n) and n denotes the number of provinces.
Third, the entropy redundancy

Finally, the composite green finance index for province i is computed as

A higher
Control Variables
Control variables include firm-level characteristics and institutional factors. Firm-level controls include age, size, leverage, profitability, firm value, ownership concentration, managerial ownership, ownership balance, board size, CEO duality, and ownership type. To account for other major environmental monitoring factors during the sample period, we also include the automatic pollution source monitoring and the vertical reform of environmental protection agencies. Following Ma et al. (2025), the vertical reform variable is constructed by manually collecting the timing when municipal environmental monitoring agencies were reorganized into provincial field offices and coding a corresponding city-level dummy variable. Table 1 provides detailed definitions of all variables.
Variable Definition.
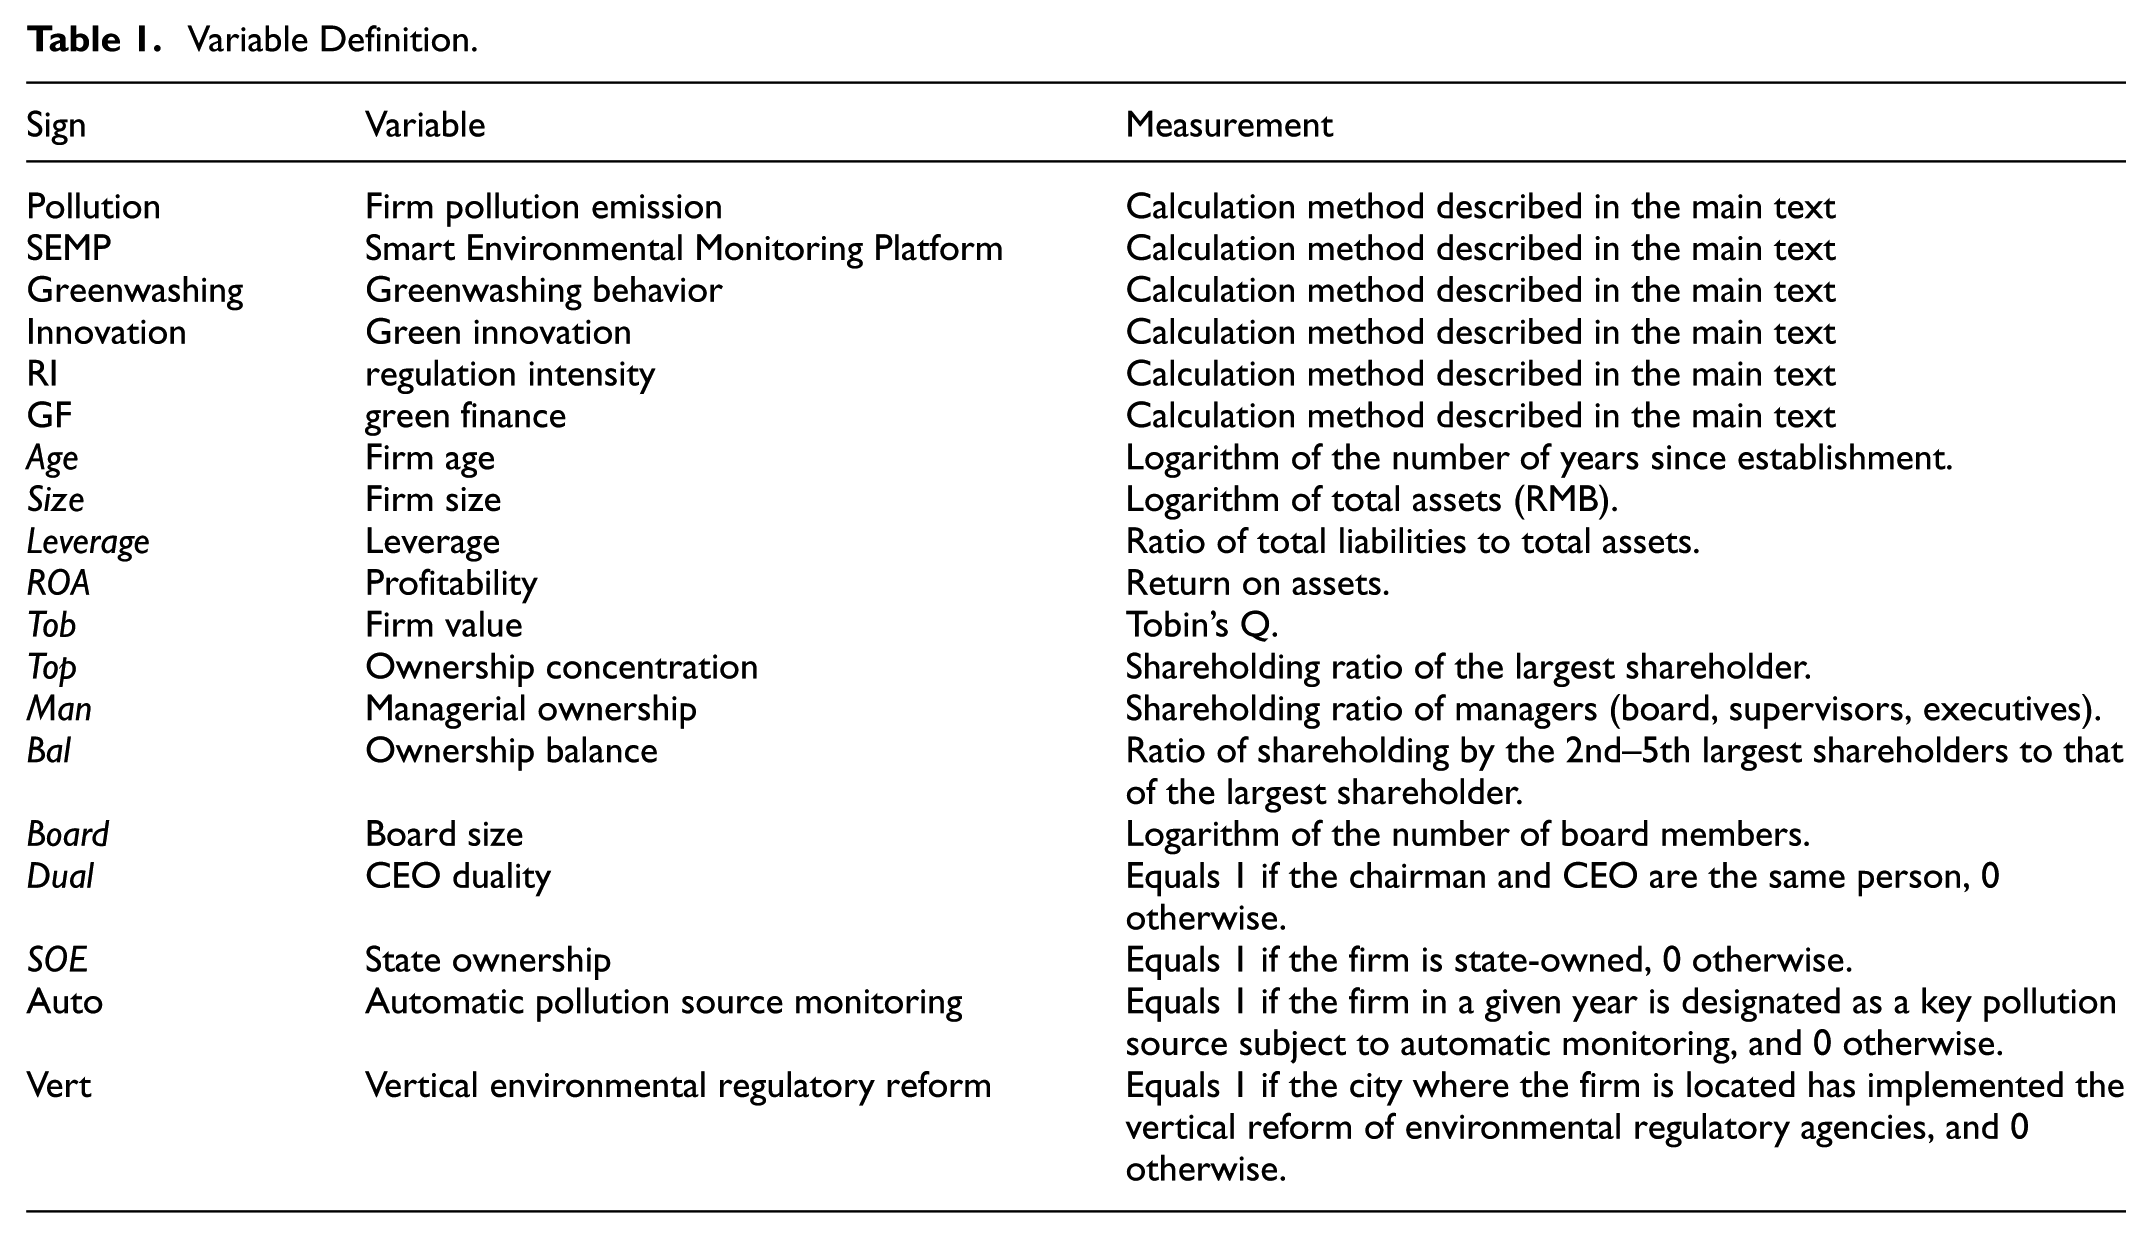
Table 2 reports the results of descriptive statistics. The average pollution intensity is 0.144 with a relatively small standard deviation (0.0067), indicating limited within-sample variation in firms’ annual emission levels. The mean of SEMP equals 0.129, suggesting that roughly 13% of firm-year observations are located in pilot provinces where the smart environmental monitoring platform has been implemented. The average greenwashing index is –0.015 with a wide standard deviation (1.081), implying considerable heterogeneity in firms’ symbolic disclosure behavior. The mean of green innovation is 0.029, showing that green-related patenting and innovation activities remain relatively limited among listed industrial firms. Regarding the external environment, the average regulation intensity is 0.408, and green finance development records a mean of 0.716, suggesting that most provinces have achieved moderate levels of environmental supervision and green-financial infrastructure. The distributions of all control variables fall within reasonable ranges, confirming the representativeness and reliability of the sample for subsequent empirical analysis.
Descriptive Statistics.
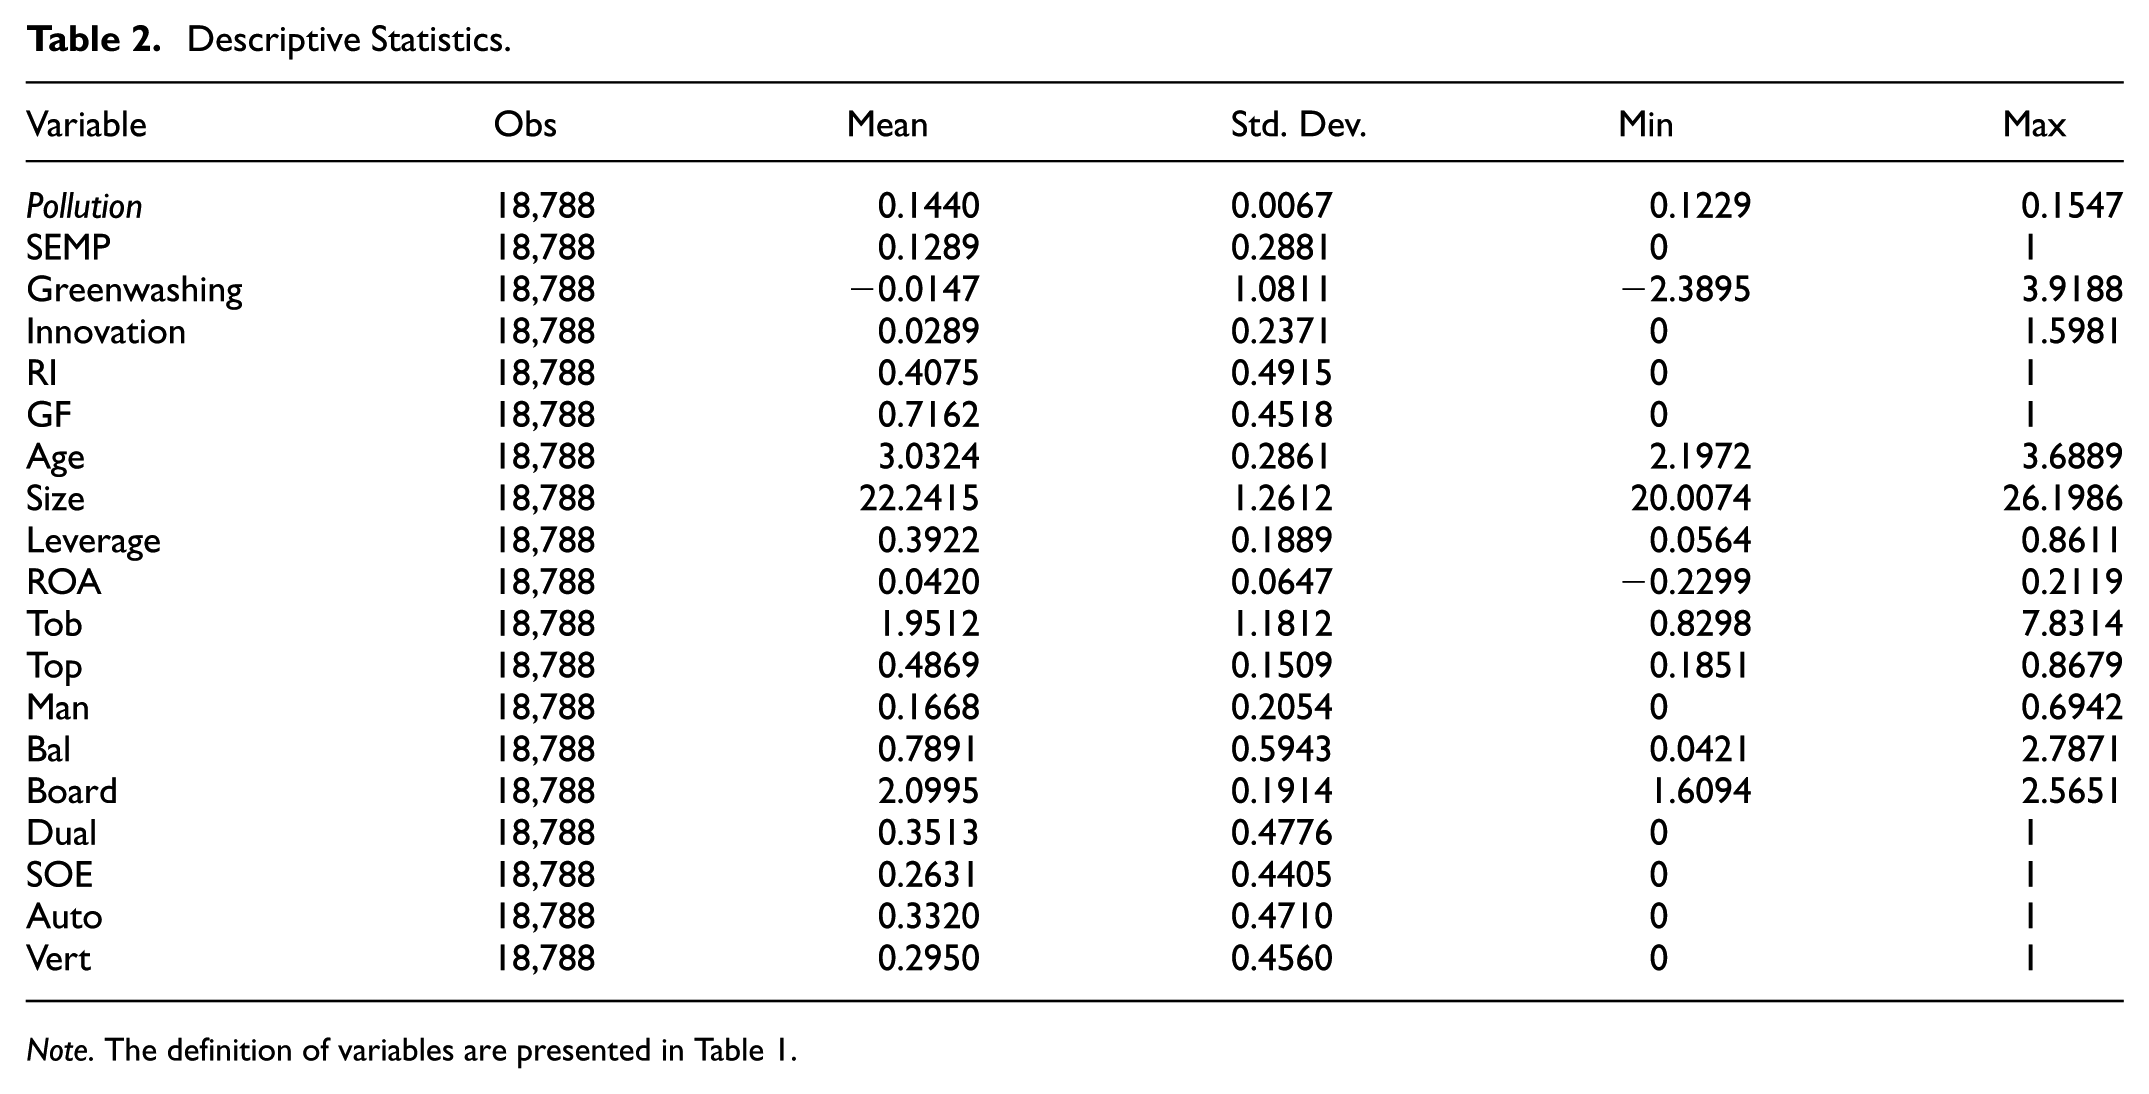
Note. The definition of variables are presented in Table 1.
Models
Baseline Model
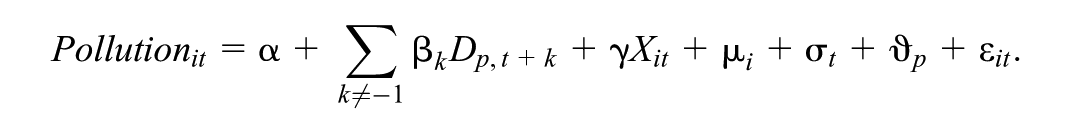
To estimate the impact of SEMPs on corporate pollution emissions, we employ a difference-in-differencess (DID) model of the following specification:

Where
Mechanism Test Model
To examine the mediating effects of greenwashing reduction and green innovation promotion, we establish the following empirical framework:


where Greenwashing denotes firms’ symbolic disclosure behavior, and Innovation captures firm-level green innovation activities. Other variables are consistent with those used in the baseline model.
Amplification Effect Model
To further examine the amplification mechanisms, we extend the baseline DID framework by incorporating interaction terms as follows:

where
Empirical Tests Results
Baseline Results
Table 3 reports the baseline results. In Column (1), excluding fixed effects and control variables, the coefficient of SEMP is significantly negative, indicating that SEMPs are associated with lower pollution emissions. Column (2) introduces firm fixed effects and firm-level control variables; the coefficient of SEMP becomes larger in magnitude, suggesting that the effect is not driven by unobserved time-invariant heterogeneity. Column (3) incorporates year fixed effects to control for macroeconomic shocks and nationwide policy changes, and the estimated effect remains robust. Column (4) further introduces regional fixed effects to capture spatial heterogeneity across provinces, and the coefficient of SEMP remains significantly negative.
Baseline Results.

Note. The definition of variables is presented in Table 1. Firm FE, Year FE, and Province FE denote fixed effects of firm, year, and region, respectively. Robust standard errors clustered at the firm level are reported in parentheses.
, *, * indicate significance at the 1%, 5%, and 10% levels, respectively.
Parallel Trend Test
To validate the identifying assumption of the DID strategy, we adopt the event-study approach proposed by Sun and Abraham (2021) to estimate the dynamic effects of SEMPs:
Where
Figure 1 plots the event-time coefficients. Prior to the platform’s implementation, all coefficients of

Parallel trend test results.
Robustness Tests
Placebo Tests
We conduct two placebo tests to further access the robustness. First, we shift the actual implementation year of SEMPs 1 or 2 years earlier or later.As shown in Figure 2, the estimated coefficients of SEMP remain statistically insignificant in all cases, suggesting that no spurious emission-reducing effect arises in the absence of the actual policy shock.

Time-placebo tests.
Second, we conduct a randomization test by drawing pseudo-treatment groups of the same size as the actual treatment group from regions that never adopted or were the last to adopt the platform, and repeat the estimation 1,000 times. Figure 3 shows that the distribution of placebo estimates is centered around zero within a narrow range, while the true estimated effect lies well outside the 95% confidence interval. This further confirms that the observed emission-reducing effect of SEMPs is not driven by sample selection or random noise but reflects a robust causal effect.

Placebo test: distribution of estimated effects.
Other Robustness Tests
First, drawing on existing literature, we assess robustness by reconstructing firm-level pollution emissions using four alternative measures: (i) the ratio of air pollution emissions to operating income; (ii) the ratio of nitrogen oxide emissions to operating income; (iii) the ratio of comprehensive water pollution to operating income; and (iv) the ratio of ammonia nitrogen emissions to operating income. As reported in Columns (1) to (4) of Table 4, the effects remain significantly negative and consistent with the baseline results.
Robustness Tests: Alternative Pollution Emissions Indicators.

Note. The definition of variables is presented in Table 1. Firm FE, Year FE, and Province FE denote fixed effects of firm, year, and region, respectively. Robust standard errors clustered at the firm level are reported in parentheses.
indicates significance at the 1% level.
Second, several sample-level adjustments were made to assess the robustness of the results. First, we excluded firms in highly polluting industries to avoid sectoral bias. Second, we removed firms located in municipalities directly under the central government and autonomous regions to minimize potential regional bias. Third, we applied propensity score matching (PSM) to construct a matched sample of firms in pilot and non-pilot provinces with similar observable characteristics, and then re-estimated the DID model. Fourth, to control for potential confounding from contemporaneous initiatives, we excluded provinces and cities participating in the National Big Data Comprehensive Pilot, Emissions Trading Scheme (ETS) pilots, and low-carbon city pilots. The results in Table 5 show that the estimated effects remain consistent with the baseline results across all adjustments, further confirming the robustness of our findings.
To further assess the robustness of our findings and to clarify the identification strategy under staggered policy implementation, we conduct a series of model substitution and estimator validation tests. First, we employ the two-way fixed effects (TWFE) estimator with the correction proposed by de Chaisemartin and d’Haultfoeuille (2020, 2024) to mitigate potential estimation bias arising from heterogeneous treatment timing. The corrected average treatment effects on the treated (ATT) are estimated using the did_multiplegt package in Stata 17, and the results remain consistent with the baseline estimates. Second, we incorporate firm-specific linear trends and adjust the clustering of standard errors at both the industry–year and firm levels, with results remaining unchanged. Third, we employ the Poisson pseudo-maximum likelihood (PPML) estimator to account for the skewness of pollution data, obtaining results highly consistent with the benchmark regressions. Fourth, we apply a machine-learning–based random forest algorithm to identify policy effects in a non-parametric setting, which similarly confirms the baseline findings. Finally, we redefine the post variable as a binary indicator (0/1) to ensure that the results are not sensitive to the fractional exposure specification in 2022. The results in Table 6 support our baseline results.
Robustness Tests: Alternative Sample.

Note. The definition of variables is presented in Table 1. Firm FE, Year FE, and Province FE denote fixed effects of firm, year, and region, respectively. Robust standard errors clustered at the firm level are reported in parentheses.
indicates significance at the 1% level.
Robustness Tests: Alternative Models.

Note. The definition of variables is presented in Table 1. Firm FE, Year FE, and Province FE denote fixed effects of firm, year, and region, respectively. Robust standard errors clustered at the firm level are reported in parentheses.
indicates significance at the 1% level.
Mechanism Tests and Heterogeneity Checks
Mechanism Tests
Mechanism Test of SEMPs’ Emission-Reduction Effect
(1) Greenwashing Reduction Effect
As shown in columns (1) and (2) of Table 7, SEMPs are negatively associated with firms’ greenwashing behavior, and greenwashing is positively related to pollution emissions, suggesting that reduced symbolic disclosure contributes to emission mitigation. The mediation analysis in Table 8 further reveals that the indirect effect through the greenwashing channel is statistically significant, accounting for approximately 16% of the total emission-reduction effect. These findings suggest that by enhancing data credibility and increasing the probability of violation detection, SEMPs effectively deter firms from “talking more but doing less.”
Mechanism Tests.

Note. The definition of variables is presented in Table 1. Firm FE, Year FE, and Province FE denote fixed effects of firm, year, and region, respectively. Robust standard errors clustered at the firm level are reported in parentheses.
indicates significance at the 1% level.
Mediation Effect Decomposition.

p < .01, **p < .05.
(2) Green Innovation Improvement Effect
As shown in columns (3) and (4) of Table 7, SEMPs are positively associated with firms’ green innovation behavior, and green innovation is negatively related to pollution emissions, suggesting that enhanced green innovation contributes to emission mitigation. The mediation analysis in Table 8 further reveals that the indirect effect through the green innovation channel is statistically significant, accounting for approximately 20% of the total emission-reduction effect. This evidence indicates that stricter and more credible environmental regulation stimulates innovation compensation by encouraging firms to reallocate resources toward cleaner technologies and long-term environmental strategies.
Amplification Effect
(1) Institutional Amplification
Columns (1) and (2) of Table 9 report the institutional amplification effects. The interaction terms between SEMP and regulatory enforcement are both significantly negative at the 5% level. This implies that the emission-reducing effect of SEMPs is stronger in provinces with more extensive regulatory penetration and more predictable punishment regimes.
Amplification Effect.

Note. The definition of variables is presented in Table 1. Firm FE, Year FE, and Province FE denote fixed effects of firm, year, and region, respectively. Robust standard errors clustered at the firm level are reported in parentheses.
and ** indicate significance at the 1% and 5% levels, respectively.
These findings are consistent with deterrence theory (Becker, 1968; Shimshack & Ward, 2008), which posits that compliance depends on both the probability of detection and the credibility of sanctions. In regions where environmental authorities have wider enforcement coverage and stronger punishment credibility, SEMPs further increase the perceived likelihood of detection and the expected cost of non-compliance. Consequently, firms are discouraged from engaging in symbolic environmental disclosure and are incentivized to undertake substantive emission abatement.
(2) Market Amplification
Columns (3) and (4) of Table 9 display the results for the market amplification mechanism. The interaction terms between SEMPs and green credit development as well as green bond penetration are also significantly negative, with coefficients between –0.0498 and –0.0516. This indicates that a well-functioning green financial system substantially magnifies the regulatory effect of SEMPs.
This result aligns with the emerging environmental finance literature (Flammer, 2021; Tang & Zhang, 2020), which emphasizes that capital markets can act as a disciplining mechanism once reliable environmental metrics are available. By improving data transparency and credibility, SEMPs strengthen the feedback loop between environmental governance and financial resource allocation, thereby embedding sustainability considerations into market-based decision-making.
Heterogeneity Checks
Firm-level Organizational Heterogeneity
(1) Ownership Structure Heterogeneity
State-owned enterprises (SOEs) are often subject to political objectives and soft budget constraints, whereas non-SOEs operate under stronger market discipline and face tighter financing constraints. Therefore, their behavioral responses to digital environmental regulation may vary. Specifically, non-SOEs may react more strongly to SEMPs because they rely more on external governance signals to compensate for weaker political connections.
Firms are categorized into SOEs and non-SOEs according to the proportion of state ownership in registered capital. A firm is defined as an SOE if state capital accounts for more than 50% of total paid-in capital; otherwise, it is classified as a non-SOE. The results in Figure 4 show that the emission-reducing effect of SEMPs is significantly stronger for non-SOEs.

Heterogeneous effects of SEMPs by firm characteristics.
(2) Firm Size Heterogeneity
Firm size shapes firms’ resource endowment, compliance capacity, and technological adaptability. Large firms usually possess mature internal control systems and digital management capacities, while small and medium-sized enterprises (SMEs) often face information asymmetry and resource scarcity. Consequently, SEMPs may generate stronger effects on SMEs by reducing monitoring costs and improving external accountability. Firm size is measured by the logarithm of total assets. Firms above the sample median are classified as large, and those below as SMEs. Results in Figure 4 support that SEMPs significantly reduce emissions for SMEs but exert a weaker effect on large firms.
(3) Profitability Heterogeneity
Profitability determines firms’ financial slack and ability to bear compliance costs. Firms with lower profitability often face higher marginal costs of pollution control and limited capacity for proactive environmental investment. SEMPs may therefore have stronger regulatory and incentive effects on low-profit firms by forcing behavioral adjustments and resource reallocation. Profitability is proxied by the return on assets (ROA). Firms in the bottom quartile of ROA distribution are classified as low-profit firms, while those in the top quartile are high-profit firms. The results in Figure 4 confirm that SEMPs have a greater emission-reduction effect among low-profit firms.
(4) Financial Constraint Heterogeneity
Financial constraints are proxied by the leverage ratio (total liabilities divided by total assets). Firms with leverage above the sample median are identified as highly constrained, and those below are classified as financially unconstrained. Results in Figure 4 validate that the emission-reducing effect of SEMPs is more pronounced in firms with higher leverage.
Governance Structure Heterogeneity
(1) Ownership Concentration Heterogeneity
Ownership concentration reflects the internal monitoring capacity and the alignment of shareholder interests. When ownership is highly concentrated, dominant shareholders can directly oversee management and enforce compliance, reducing the need for external regulation. Conversely, when ownership is dispersed, internal oversight becomes weaker, and firms may rely more on external digital monitoring to constrain opportunistic behavior. Therefore, it is expected that SEMPs exert stronger disciplinary effects in firms with more dispersed ownership structures. Ownership concentration is measured by the shareholding ratio of the largest shareholder. Firms whose largest shareholder holds a ratio above the sample median are classified as high-concentration firms, while those below the median are low-concentration firms. Results in Figure 5 reinforce that SEMPs exert a significantly stronger emission-reducing effect among firms with dispersed ownership.
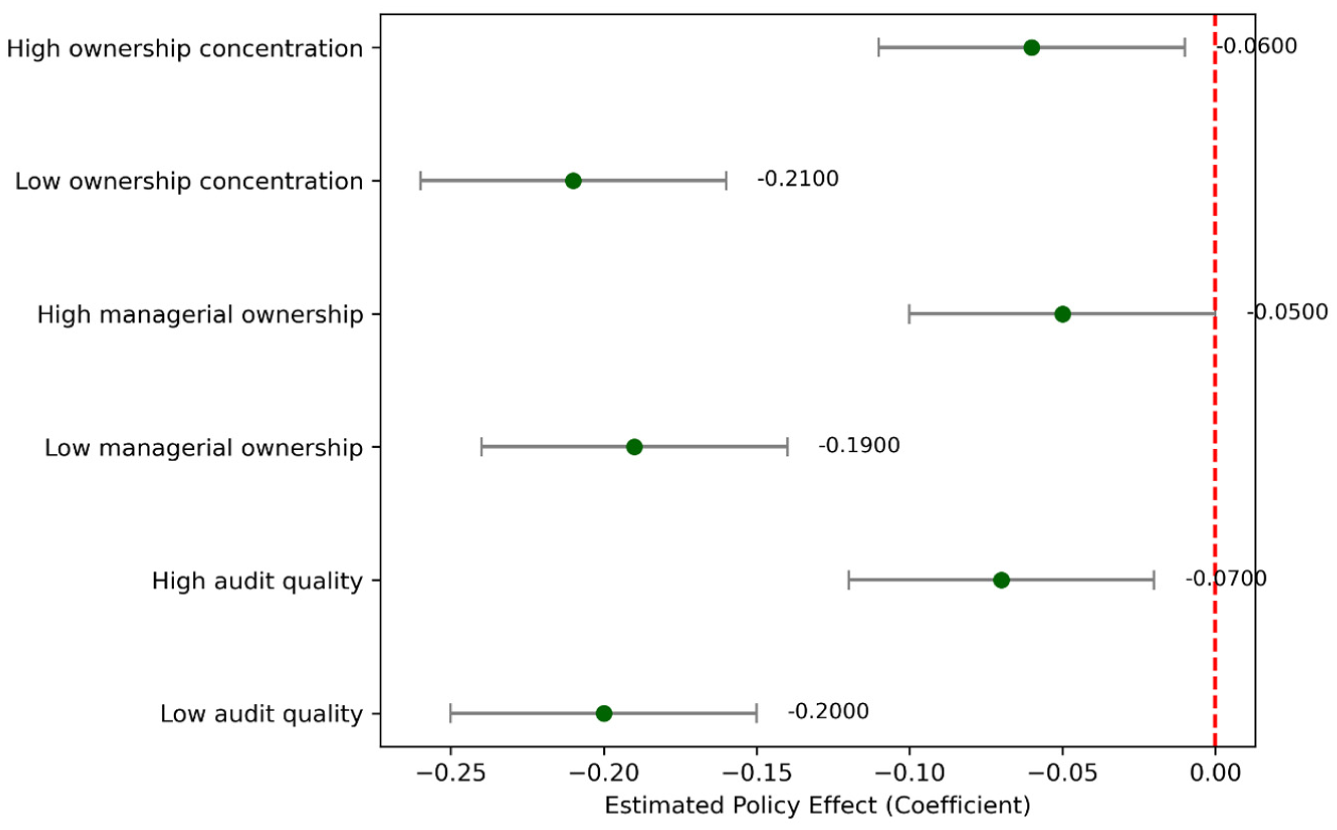
Heterogeneous effects of SEMPs by governance structure.
(2) Managerial Ownership Heterogeneity
Managerial shareholding represents the alignment of interests between executives and shareholders. When managerial ownership is high, managers have stronger incentives to pursue long-term firm value and comply with environmental standards. Conversely, when managerial ownership is low, short-term incentive structures may induce managerial myopia, increasing the risk of environmental non-compliance. Hence, SEMPs are expected to exert greater regulatory impact in firms with weaker managerial incentives. Managerial ownership is captured by the aggregate shareholding ratio of directors, supervisors, and executives. Firms with managerial ownership above the median are categorized as high-incentive firms, while those below are low-incentive firms. The results in Figure 5 indicate that SEMPs have a more pronounced emission-reducing effect in firms with lower managerial ownership.
(3) Audit Quality Heterogeneity
Audit quality reflects the credibility of firms’ external monitoring. High-quality audits can deter earnings manipulation, improve disclosure transparency, and strengthen investor and regulatory confidence. When audit quality is low, information asymmetry between firms and external stakeholders increases, weakening market-based governance. Therefore, SEMPs are expected to exhibit stronger effects among firms with weaker audit oversight. Audit quality is proxied by a dummy variable equal to one if the firm is audited by a Big Four accounting firm and zero otherwise. Firms audited by Big Four firms are categorized as high-audit-quality firms, and others as low-audit-quality firms. Results in Figure 5 corroborate that the emission-reducing effect of SEMPs is significantly stronger among firms with lower audit quality.
Conclusions and Implications
Conclusions
This study investigates the impact of SEMPs on corporate pollution emissions. Using the staggered provincial roll-out of SEMPs in China as a quasi-natural experiment and firm-level data from 2017 to 2024, the results show that SEMPs significantly reduce firms’ emissions by curbing greenwashing and fostering green innovation. Moreover, stronger regulatory intensity and more developed green finance systems amplify these effects.
Academic Implications
First, this study shows that SEMPs represent a new form of regulatory technology that embeds enforcement into digital infrastructures. By transforming compliance from human supervision to algorithmic execution, SEMPs automate coercive and normative pressures and enhance institutional credibility. This finding extends institutional theory to the digital governance context, revealing how technological systems themselves can sustain regulatory legitimacy and reduce enforcement discretion.
Second, the analysis identifies a dual mechanism that improves both actual environmental performance and disclosure credibility. By replacing unverifiable self-reporting with machine-verified data, SEMPs reconstruct the information structure of regulation and shift firms’ incentives from symbolic disclosure toward substantive action. This contribution advances the literature on information asymmetry and impression management by showing that digital transparency can reshape corporate legitimacy strategies.
Finally, empirical results confirm that credible and data-driven enforcement stimulates green innovation rather than hindering it. When regulatory pressure becomes predictable and information transparent, firms respond strategically by investing in cleaner technologies and long-term capability building. This “digital Porter effect” enriches the understanding of how RegTech-based governance transforms environmental stringency into a source of innovation and competitiveness.
Policy Implications
The main findings yield the following policy implications.First, policymakers should accelerate the nationwide expansion of SEMPs and integrate monitoring networks across pollutants and regions. Establishing unified standards for data collection and use will enhance data comparability and regulatory efficiency. econd, enforcement mechanisms should be strengthened by improving inspection timeliness, increasing penalty certainty, and linking monitoring data directly to regulatory responses. hird, complementary policies such as tax incentives, R&D subsidies, and technical guidance are needed to support firms in building long-term environmental capabilities beyond passive compliance. inally, transparency and public participation should be enhanced by making verified emissions data publicly accessible, thereby reinforcing reputational incentives and enabling civil society oversight.
Overall, SEMPs represent a transformative innovation in China’s environmental governance, shifting from “symbolic compliance” to verifiable, technology-enabled enforcement. By integrating real-time monitoring, institutional deterrence, and market incentives, SEMPs not only reduce pollution but also foster sustainable capacity building within firms, offering valuable lessons for other countries seeking to leverage digital technologies for environmental regulation.
Limitations and Future Research Directions
While this study provides evidence that SEMPs reduce pollution emissions through greenwashing suppression and capability building, several limitations should be acknowledged.
First, the quasi-experimental design is bounded by the available rollout data of SEMPs across provinces. While the staggered implementation offers credible variation for causal inference, limited information on concurrent environmental initiatives restricts the ability to analyze broader policy interactions. As more detailed provincial or sectoral data become accessible, future studies can expand the framework to examine multi-policy dynamics.
Second, the current dataset does not capture firm-level differences in digital compliance maturity or internal governance quality. This limitation reflects data availability rather than methodological design. Future research could integrate SEMPs data with audit, patent, or ESG datasets to reveal how organizational capabilities shape environmental responses.
Finally, the generalizability of these findings is shaped by China’s institutional context. The SEMPs operate within a centralized environmental governance system, where regulatory data are collected, verified, and enforced through vertically integrated bureaucratic structures. This configuration enables unified data standards, centralized monitoring, and top-down accountability, which may not be directly replicable in countries with more decentralized or market-driven environmental systems. In such settings, digital platforms may rely more heavily on voluntary participation, third-party verification, or regional coordination, potentially weakening enforcement certainty and institutional coherence. Future comparative research could examine how the effectiveness of RegTech-based environmental governance varies across governance model to clarify the boundary conditions of the SEMPs’ effectiveness.
Footnotes
Funding
The authors disclosed receipt of the following financial support for the research, authorship, and/or publication of this article: This work was supported by the National Social Science Fund of China [Grant No. 21CJY059].
Declaration of Conflicting Interests
The authors declared no potential conflicts of interest with respect to the research, authorship, and/or publication of this article.
Data Availability Statement
The data will be made available upon reasonable request.