
Abstract
Logistics industry’s sharp expansion within major river basins has generated acute contradictions between economic development imperatives and ecological protection requirements, with enterprise clustering patterns that often conflict with environmental sustainability goals in sensitive watershed regions. Despite national policies promoting coordinated river basin development, persistent spatial inequalities and ecological pressures from logistics activities highlight urgent challenges in achieving sustainable regional development, which existing research has inadequately addressed. This study investigates the spatiotemporal evolution of Class A logistics enterprises across China’s six major river basins (2005–2023) using GIS spatial analysis, coupled with coordination assessment, and the Optimal Parameter Geographical Detector (OPGD). Results reveal that 68.3% of high-grade enterprises (3A–5A) cluster in plains with an elevation below 500 m, with logistics density increasing by 39.6% within 5 to 10 km buffer zones of water systems. Distinct spatial patterns emerge: the Yangtze River Basin exhibits dual-core axial development (with a density of 42.7/km2 in the Shanghai-Wuhan corridor), the Pearl River Delta demonstrates port-driven agglomeration, while 53.2% of enterprises in the Yellow River Basin concentrate near energy bases. Factor interaction analysis reveals dual enhancement effects (GDP-foreign investment synergy, q = .68) and nonlinear trade-offs between institutional and environmental factors. The Yangtze and Haihe Basins achieve higher coupling coordination through infrastructure-policy integration, while the Yellow River Basin shows significant imbalances. This study proposes a nature-culture integration analytical framework, providing evidence-based strategies for optimizing logistics spatial patterns while balancing ecological and economic priorities in environmentally sensitive river basin regions.
Keywords
Introduction
Historically, global economic systems have developed in close relationship with water systems, in which river basins function as both geographical constraints and drivers of human settlement, commerce, and industrial development (Liotta et al., 2023; Pumo et al., 2017). These basin-scale socio-ecological systems are the cause and effect of complex interactions between hydrological features, topography, human settlements, and economic activities, creating distinctive spatial-economic landscapes with unique developmental trajectories (J. Wu et al., 2022; Zhong et al., 2022). Globally, integrated river basin management has emerged as a critical policy priority, reflecting the recognition that sustainable development requires coordinating economic growth with environmental protection at watershed scales (Qi et al., 2020; L. Wang et al., 2025). At the international level, the European Union’s Water Framework Directive (2000) established comprehensive basin management principles adopted across 27 member states, emphasizing ecological integrity alongside economic objectives (Schlager et al., 2025). Parallel to this European initiative, similar frameworks have been implemented worldwide, including the Mekong River Commission’s basin development framework, the Murray-Darling Basin Plan in Australia, and transnational governance arrangements for the Rhine and Danube, collectively demonstrating a global commitment to coordinating sustainability at the basin scale.
Within this international context, China’s logistics industry expansion within major river basins exemplifies the acute contradictions between economic imperatives and ecological protection requirements common in rapidly industrializing nations. While the sector contributes significantly to regional economic growth, generating over 2.1 trillion yuan in transportation, storage, and postal services across six major basins in 2023, its spatial development patterns increasingly conflict with environmental protection imperatives (Ding & Liu, 2024; Dubie et al., 2020). In response to these challenges, recent policy initiatives, including China’s Yellow River Basin Ecological Protection and High-Quality Development Plan (2019) and Yangtze River Protection Law (2021), mirror the aforementioned international emphasis on balancing basin development with sustainability (X. Chen et al., 2023; Ke et al., 2022). More importantly, despite significant technological advances in transportation and communication, these ancient geographical imprints continue to influence contemporary spatial economic patterns, particularly in logistics networks that facilitate material flows across regions (Cao et al., 2025), underscoring the persistent relevance of basin-scale geographical constraints in modern economic development.
However, while the existing literature on logistics spatial evolution has made significant contributions, it still exhibits several essential limitations that hinder a comprehensive understanding of basin-scale dynamics. First, previous studies have primarily focused on individual metropolitan areas or specific transportation corridors (S. Kang, 2022; Sakai et al., 2020) and have thus failed to capture the distinctive dynamics that emerge at the basin scale, where the interaction between varied geographical conditions and economic processes is evident. Second, research has typically examined single factors, such as accessibility (Verhetsel et al., 2015), land costs (Woudsma & Jakubicek, 2020), or policy frameworks (Orji et al., 2019), while overlooking the complex interaction effects that characterize basin environments. Third, quantitative assessments of how logistics development can coordinate with broader economic and environmental systems in basin regions remain underdeveloped, creating a critical gap in pathways of sustainable regional development (Guerrero et al., 2022; Sha et al., 2025).
To address these limitations, this study employs an integrated analytical method combining GIS spatial statistics, coordination degree assessment, and Optimal Parameter Geographical Detector (Figure 1). This multi-method approach enables systematic comparison across river basins with varying geographical characteristics, transcending single-city case study limitations through a pattern identification-coordination assessment-mechanism analysis chain that progresses from phenomenon to essence. A comprehensive dataset of Class A logistics enterprises is georeferenced across China’s six major river basins and integrated with multidimensional economic, environmental, and social indicators. The findings inform sustainable regional development policy by balancing logistics efficiency with ecological protection in sensitive river basin environments. Critically, this study elucidates mechanisms through which basin characteristics shape logistics spatial patterns, providing an empirical foundation for geographically informed development strategies aligned with integrated river basin management approaches worldwide.

Research framework.
This research advances logistics geography and sustainable regional development scholarship through four contributions. Conceptually, we establish a nature-culture integration framework positioning geographical constraints as active shapers of logistics spatial evolution, recognizing that basin-specific hydrological, topographical, and ecological features create heterogeneous opportunity landscapes—the first framework explicitly incorporating basin-scale geographical determinants alongside institutional factors. Methodologically, we pioneer an integrated approach combining GIS spatial analysis, coupling coordination assessment, and OPGD to create a pattern-coordination-mechanism analytical chain examining spatial patterns, coordination status, and driving factor interactions, marking OPGD’s first application in logistics geography for quantifying nonlinear interactions while overcoming discretization problems. Empirically, we provide the first systematic comparative analysis across six river basins (2005–2023), encompassing 8,135 enterprises, revealing how similar economic imperatives produce divergent spatial outcomes in different geographical contexts. Practically, we demonstrate quantifiable policy impacts through comparative analysis of major basin strategies, establishing the first evidence-based framework for differentiated logistics development respecting basin-specific constraints and sustainability requirements.
The paper is organized as follows: Literature Review reviews relevant literature and develops an analytical framework. Research Area Overview, Methods, and Data describes methodology and data. Multi-Scale Analysis Results presents findings on logistics spatial patterns. Analysis of LCCD Influencing Factors Based on the OPGD Model analyzes interactions among influencing factors. Discussion discusses implications and strategies for balancing logistics development with ecological protection.
Literature Review
A basin economy refers to an economic type that is supported and led by urban economies, based on and linked by a coastal transportation and logistics system, with the mission of promoting comprehensive economic development along the coast and waterways (Tian & Mao, 2022). The modern logistics industry, as an accelerator of economic growth, influences both the internal organization and operational methods on the one hand, and conducts structural reconstruction of the regional economy and social development on the other. It could be argued that it resonates with and moves in sync with the economic development of cities in their respective river basins (Ali et al., 2021; Ding & Liu, 2024). Consequently, the spatiotemporal structure evolution and siting issues of urban logistics enterprises have attracted widespread attention (Giuliano & Kang, 2018; Strale, 2020). The existing literature primarily explores the evolution characteristics of logistics infrastructure and the spatiotemporal patterns of logistics enterprises, as well as the influencing factors of these evolutions and the consequences of urban logistics expansion.
Evolutionary Characteristics of Logistics Space
Current research typically focuses on the spatiotemporal evolution patterns of logistics enterprises at the urban scale, finding that logistics facilities generally show a trend of spreading from the city center to the suburbs (Giuliano & Kang, 2018). For example, logistics nodes in Asian cities, such as Tokyo and Seoul, have undergone a process of migration from core areas to edge areas (Schlager et al., 2025). In contrast, North American cities like Los Angeles exhibit agglomeration characteristics along transportation corridors (Giuliano & Kang, 2018). This diffusion pattern is attributed to rising land costs, optimization of traffic accessibility, and adjustments in urban functional zoning.
However, despite documenting consistent patterns across diverse cities, studies remain predominantly descriptive rather than explanatory, establishing ‘what’ happens without systematically investigating “why” or “under what conditions” patterns emerge. More fundamentally, the single-city case study design limits comparative insight; most regional logistics research collects data represented by the statistics of the transportation, postal, and warehousing industries, and rarely analyzes from the perspective of geographic information characteristics and quality classification at the enterprise level. Guerrero et al. (2022) explicitly demonstrate that even within France, the spatial ranges of warehouse activity exhibit substantial heterogeneity across urban areas, challenging the assumptions of uniform explanatory models. This reveals a fundamental tension between the depth of case studies and the breadth of comparisons. The absence of basin-scale comparative frameworks represents a significant knowledge gap. River basins constitute distinctive geographical units where hydrological features, topographical variations, and ecological sensitivities create natural boundaries that may not align with administrative jurisdictions. Yet, no prior research has systematically examined how logistics patterns evolve across multiple basins with varying geographical characteristics, despite international policy emphasis on integrated river basin management, which requires coordination between economic development and environmental protection at watershed scales.
Factors Influencing Spatial Distribution
As shown in Table 1, a review and comparison of existing studies indicate that the spatial distribution and evolution of logistics enterprises are influenced by multiple factors, including market demand, cost pressure, and government policies (Ding & Liu, 2024; Du & Li, 2022).
Characteristics and Differences in the Distribution of Logistics Enterprises.

Existing literature has explored the driving mechanisms of logistics enterprise site selection from multiple dimensions, such as economy, geography, and policy. In terms of economic factors, market demand (such as population density, total retail sales) and cost pressures (land rent, labor prices) are core variables (Verhetsel et al., 2015). In geographical factors, the accessibility of transportation infrastructure (highways, ports) has been proven to have a significant impact on the layout of logistics nodes (Guerrero et al., 2022; Guzman & Hessel, 2022; Hesse & Rodrigue, 2004). Policy factors such as industrial planning and ecological compensation mechanisms are also included in the analytical framework (Chai et al., 2023; X. Kang et al., 2024). However, existing research typically remains at the level of single-factor analysis, lacking systematic discussion on the interaction of multiple factors (such as the coupling of economic-environmental-social subsystems) and the heterogeneity impact mechanism at the river basin scale. Recent geographical detector techniques can quantify interaction effects and identify spatial heterogeneity (Song et al., 2020; Wang & Xu, 2017), but their application to logistics spatial patterns remains limited, particularly in environmentally sensitive contexts where natural constraints interact with economic drivers.
Nature-Culture Integration Framework Positioning
Recent scholarship has demonstrated that natural geographical elements and human activities operate as coupled systems, rather than independent factors (Bai et al., 2022). In river basin contexts, hydrological features, topography, and climate conditions create natural constraints that interact with institutional arrangements, economic structures, and technological capabilities to produce distinctive spatial-economic landscapes (Liotta et al., 2023). This dual-constraint perspective extends Porter’s Diamond Model, recognizing that logistics competitiveness in environmentally sensitive regions emerges from the interaction between natural endowments and human adaptations (Sha et al., 2025). The Coupled Human and Natural Systems (CHANS) framework provides theoretical grounding for analyzing these interactions (J. Liu et al., 2021). In basin contexts, hydrological systems and economic activities shape regional development through cross-scale feedbacks: natural constraints influence human adaptive behaviors, while human activities reshape natural systems. Research on urban-environmental coupling has demonstrated that sustainable development requires a systematic analysis of how natural constraints influence human activities and vice versa (S. Chen et al., 2023). In the context of transport infrastructure, recent studies emphasize that geographical features create both opportunities and constraints that interact with policy interventions to determine spatial outcomes (L. Wang et al., 2025).
Recent debates in logistics geography have emphasized platform capitalism’s spatial implications (Loske & Klumpp, 2022) and the logistics sprawl phenomenon’s environmental justice dimensions (Kin et al., 2024). However, these predominantly Global North perspectives overlook how rapid urbanization and ecological fragility create distinctive dynamics in emerging economies. Our basin-scale approach responds to calls for context-sensitive theorization (Rodrigue, 2024) while bridging the gap between economic geography’s spatial turn and sustainability science’s systems thinking.
While nature-culture integration provides the conceptual lens, the dual-constraint mechanism operationalizes this integration by quantifying how natural and cultural factors jointly shape logistics geography. Our framework extends three theoretical traditions: First, we reconceptualize Porter’s Diamond Model (Porter, 1990) by positioning geographical determinants not as passive factor conditions but as active constraints that shape demand patterns, related industry locations, and institutional responses in basin contexts, topography and hydrology fundamentally modify how competitive elements interact. Second, we advance Location Theory by relaxing simplified geographical assumptions in traditional theories (Weber’s least-cost, Lösch’s market areas, Christaller’s central places), recognizing that river basins create heterogeneous opportunity surfaces where optimal locations vary fundamentally across geographical contexts, requiring geographically informed rather than generic models. Third, while recent sustainability research employs coupling coordination models to assess subsystem balance (S. Chen et al., 2023; Z. Wu et al., 2022), we innovate Coupling Coordination Theory through logistics-specific application in river basins: methodologically, by adapting entropy weighting to reflect temporal variation in factor importance; substantively, by demonstrating that what constitutes balanced development in ecologically robust regions differs fundamentally from requirements in fragile watersheds. These extensions address three critical gaps: basin-scale comparative analysis, interaction-focused mechanisms, and natural geographical constraints in environmentally sensitive regions.
Research Area Overview, Methods, and Data
Overview of the Research Area
The six major river basins selected for this study, including the Yangtze, Yellow, Pearl, Huai, Hai, and Songliao, were delineated using the standardized hydrological unit boundaries established by China’s National Basic Geographic Information Database (2022, https://www.ngcc.cn/). This delineation follows watershed-based geographical principles rather than administrative boundaries, ensuring that the analysis captures true hydrological relationships. Figure 2 illustrates these basin boundaries in relation to the distribution of logistics enterprises.
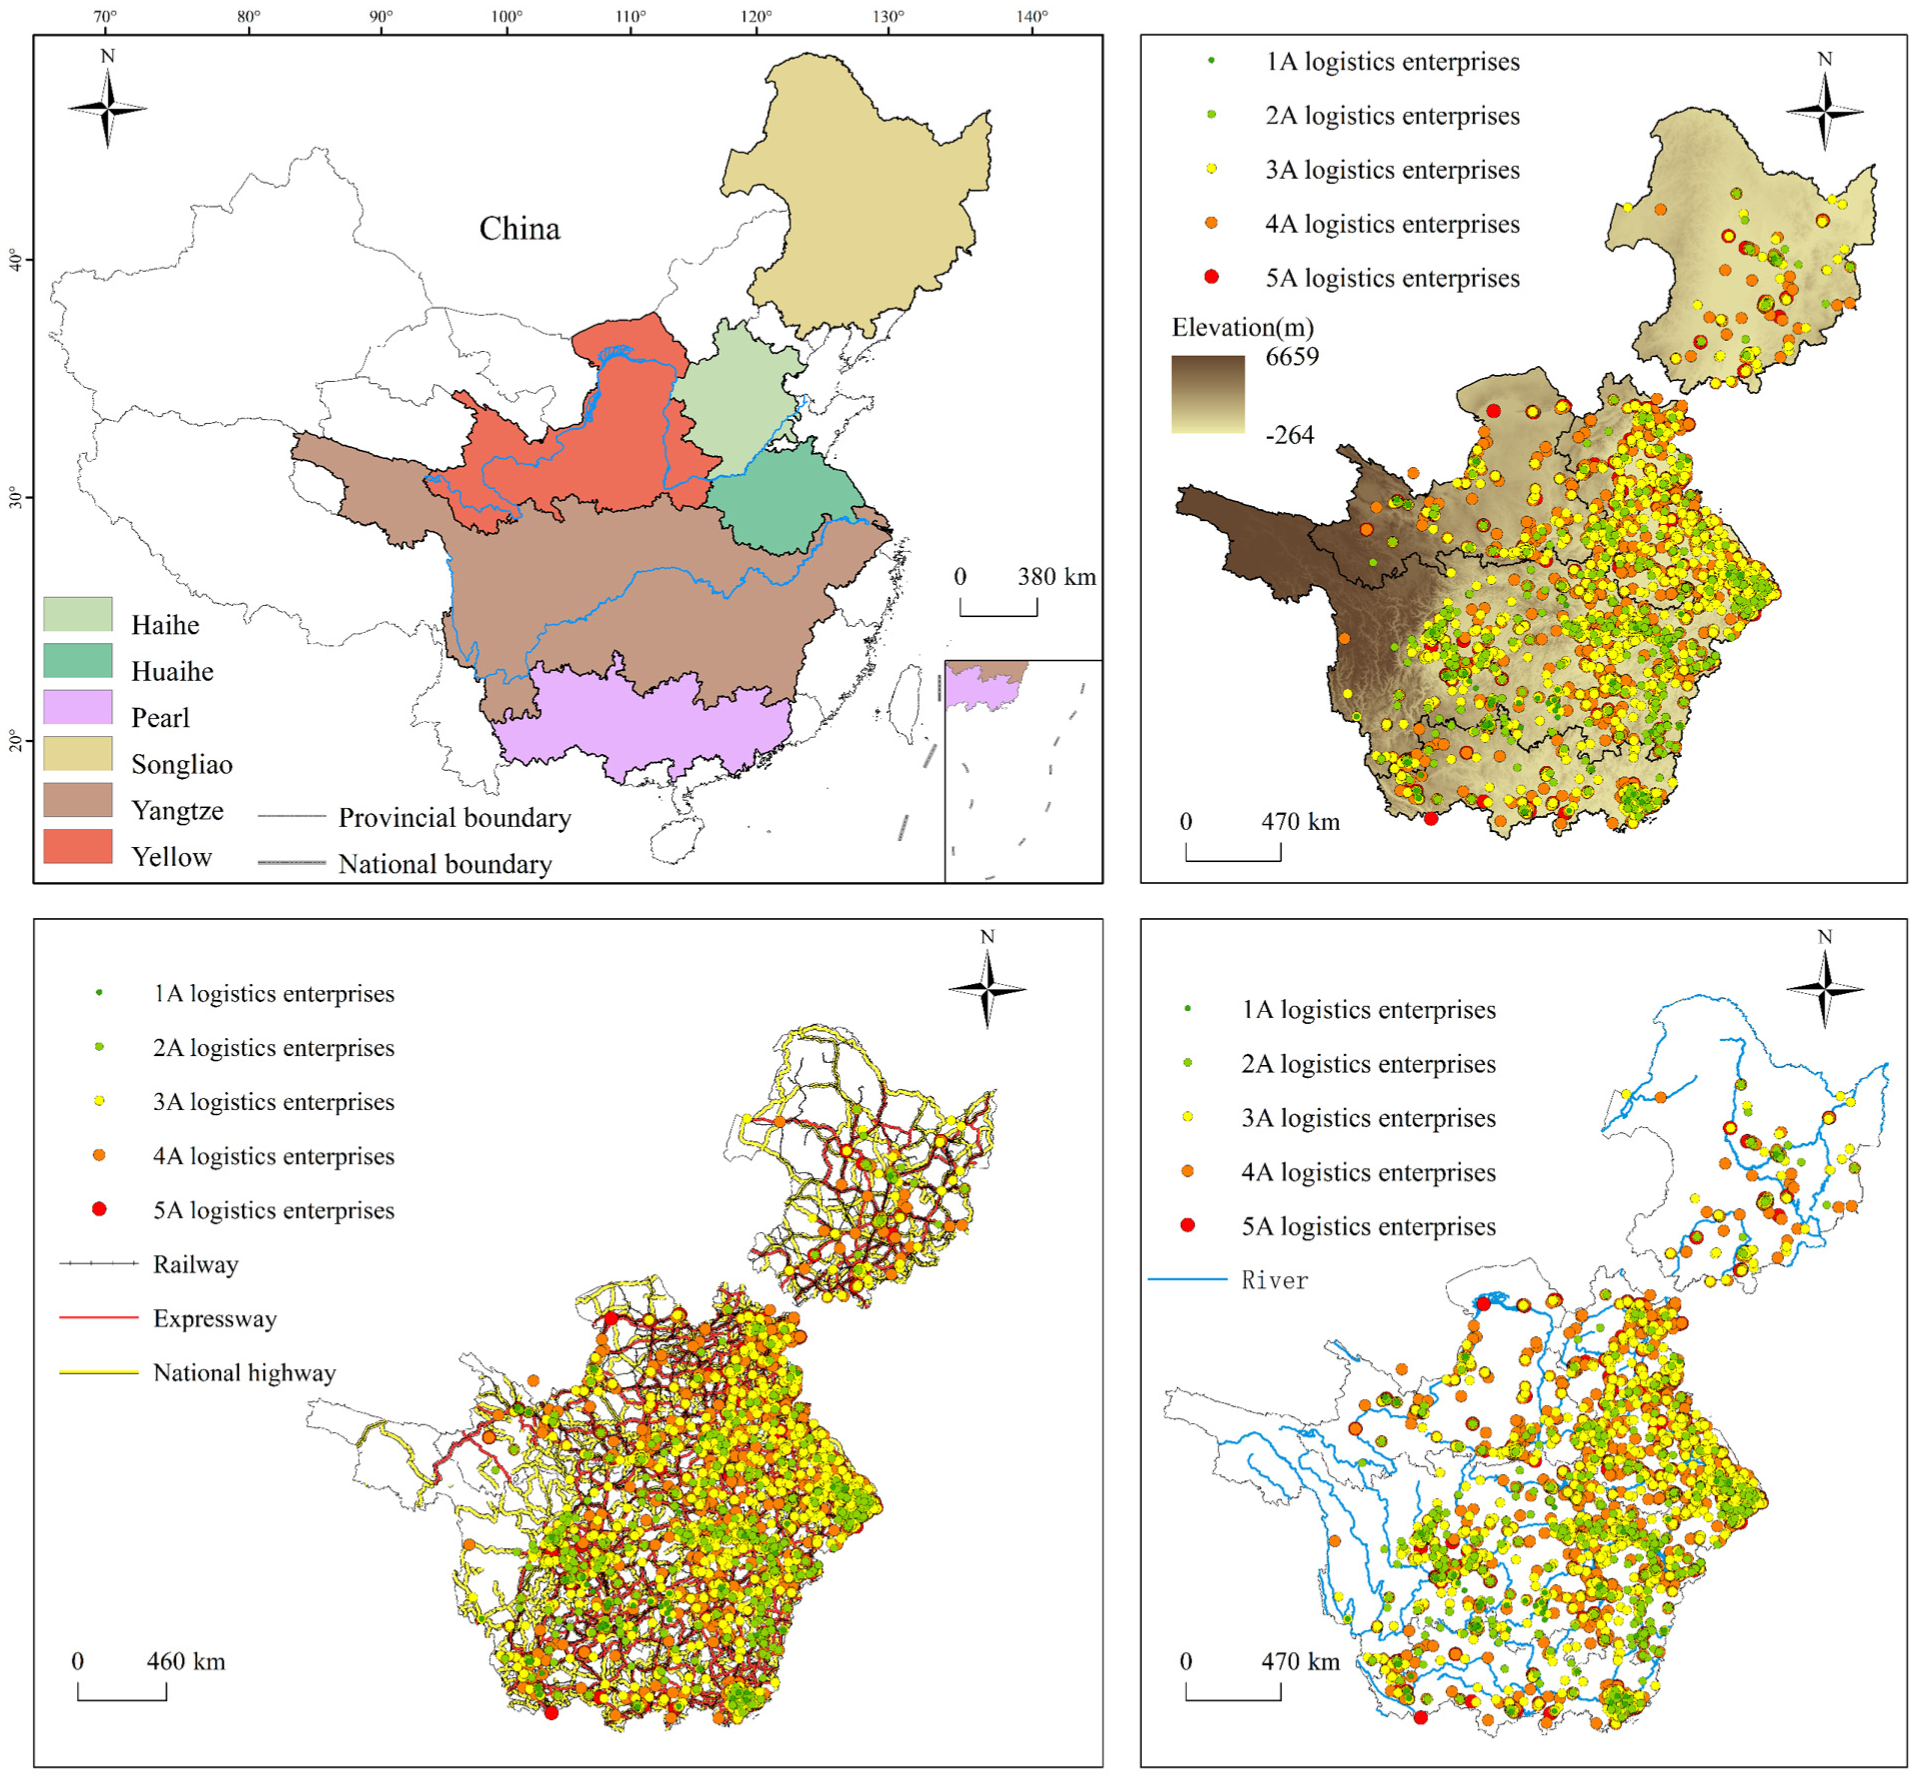
Overview of a logistics enterprise with transportation, hydrology, DEM elevation.
Each river basin represents a distinct hydrological system with unique geographical characteristics that potentially influence logistics development patterns. The Yangtze River Basin, China’s largest, encompasses a diverse geography from the Tibetan Plateau to the East China Sea, featuring extensive navigable waterways (Xia et al., 2025). The Yellow River Basin traverses more arid regions with complex terrain and significant ecological fragility (Lin et al., 2025). The Pearl River Basin features a dense river network in southern China with major seaports at its delta (Lin et al., 2025). The Huai River Basin occupies a transitional zone between northern and southern China with mixed agricultural and industrial characteristics. The Hai River Basin contains the Beijing-Tianjin-Hebei urban agglomeration within a relatively compact area. The Songliao Basin in northeastern China experiences seasonal freezing that affects water transportation.
This basin-scale approach allows us to analyze how varying hydrological, topographical, and climatic conditions influence logistics spatial patterns across different regional contexts. The development of logistics enterprises in China’s six major river basins is closely related to the transportation, hydrological, and topographical conditions of the basins (Figure 2). In terms of transportation, the Yangtze Golden Waterway and its developed network of roads and railways provide convenient transportation channels for logistics enterprises, leading to the aggregation of many 3A to 5A level logistics enterprises and the formation of scale effects. Regarding hydrological conditions, the flood season is beneficial for reducing the cost of inland water transport. However, the flood season in some basins threatens the safety of logistics facilities along the banks, which requires flexible responses from logistics enterprises. In terms of topography, plain areas such as the North China Plain are conducive to constructing large-scale logistics parks and attracting high-grade enterprises.
In contrast, logistics enterprises in complex terrain areas are limited, mostly consisting of 1A to 2A level enterprises with sparse distribution. As shown in Figure 3, the development dynamics of logistics enterprises in China’s six major river basins over the past two decades reveal differences in the magnitude and trend of data among logistics enterprises of different grades. For instance, the data of 3A to 5A level logistics enterprises are relatively high and stable in most years. In contrast, the data for 1A and 2A level enterprises fluctuates greatly, indicating a gradual increase in industry concentration, with large, high-quality enterprises continuing to grow. In contrast, small and medium-sized logistics enterprises face greater competitive pressure or market uncertainty.
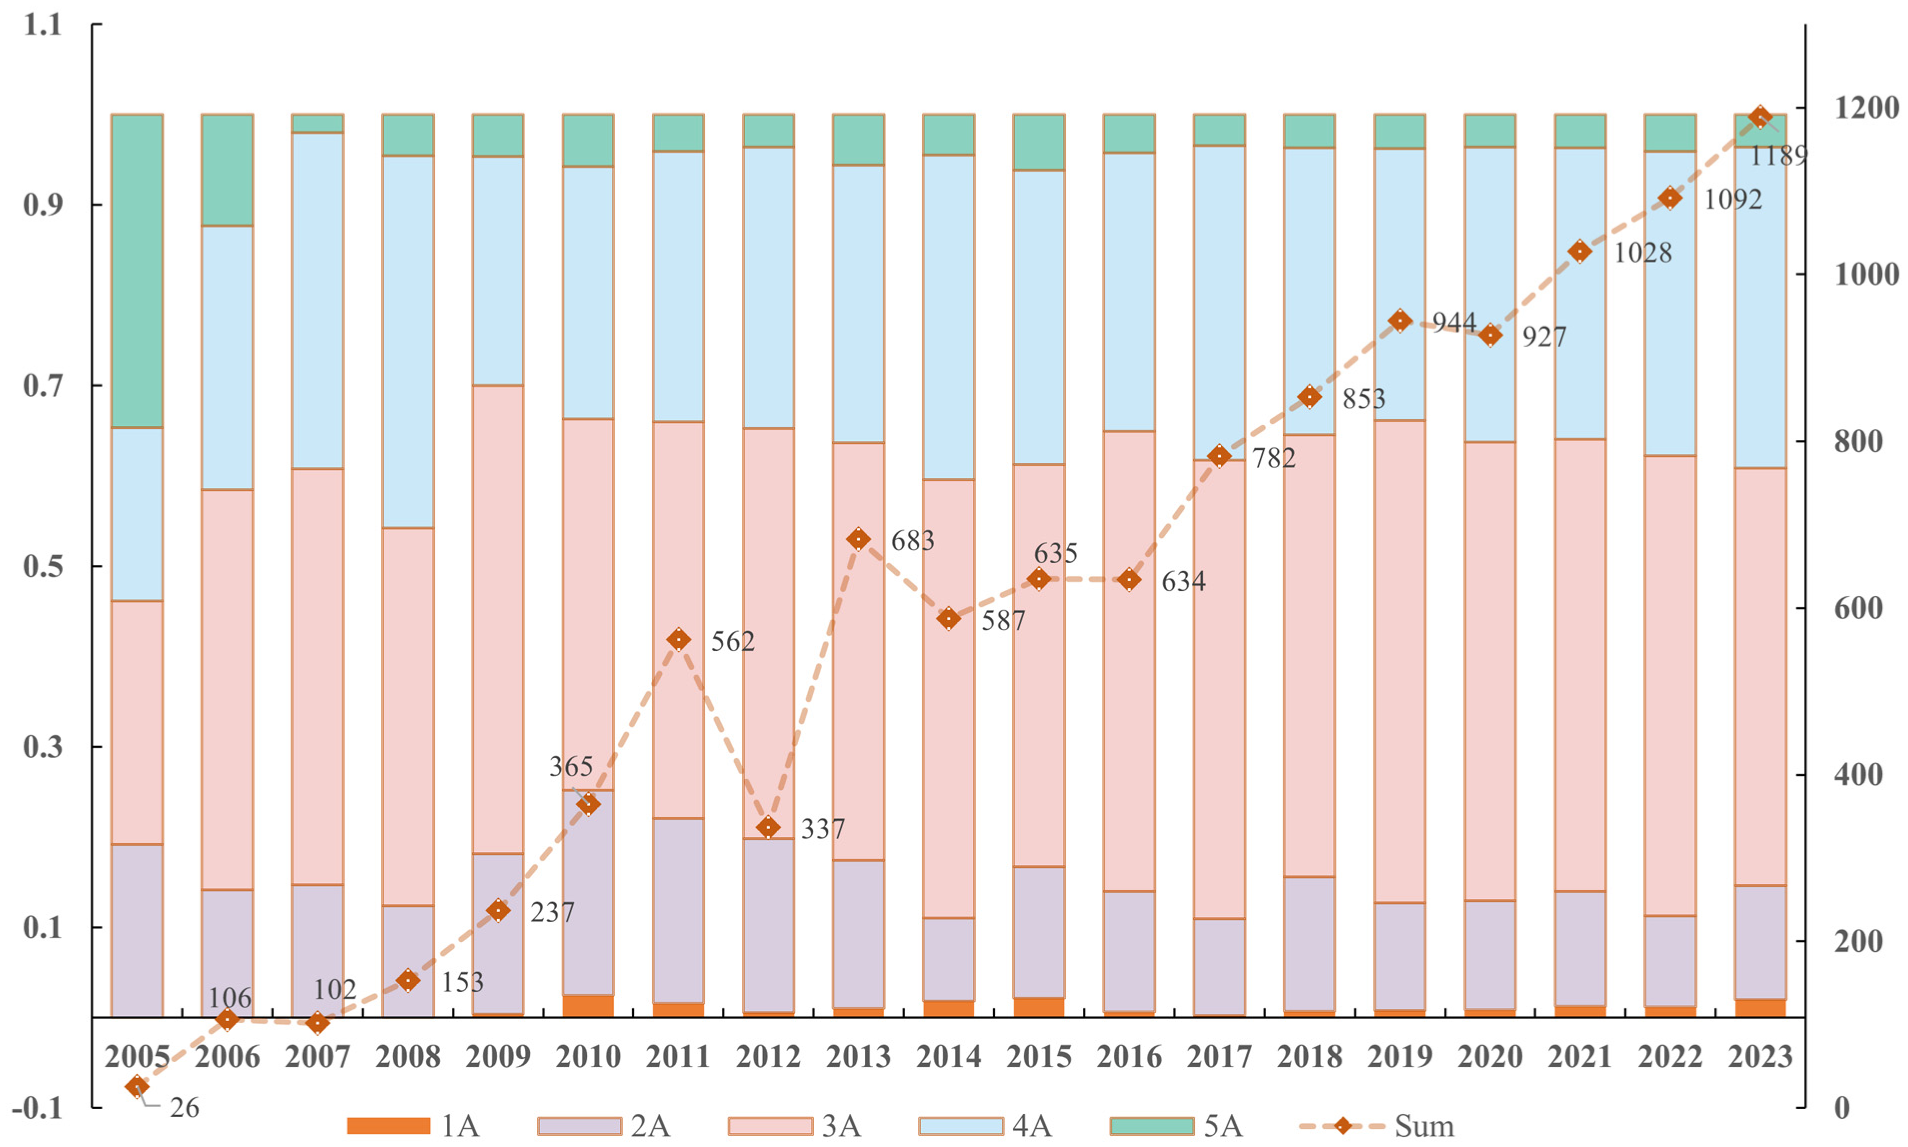
Changes in the number of logistics enterprises at different levels from 2005 to 2023.
Based on DEM elevation data, a quantitative analysis was conducted on the distribution of logistics enterprises in different altitude ranges of six major river basins. The results revealed that in the low altitude area of 0 to 500 m, the density of A-level logistics enterprises reaches 0.85 per square kilometer, and the proportion of 3A to 5A high-level enterprises reaches 68.3%; In the mid altitude area of 500 to 1,000 m, the density of enterprises decreases to 0.37 per square kilometer, and the proportion of high-grade enterprises decreases to 41.6%; In high-altitude areas above 1,000 m, the density of enterprises further reduces to 0.12 per square kilometer, and the proportion of high-grade enterprises is only 23.5%. Together, terrain has a direct constraining effect on the distribution of logistics enterprises, mainly by affecting the cost of infrastructure construction and transportation efficiency. Especially in the upper reaches of the Yellow River with complex terrain, the density of logistics enterprises is only 1/5 of that of the the Middle and Lower Yangtze Valley Plain, despite the rich resources.In addition, a significant negative correlation between the altitude and logistics enterprise density was confirmed by calculating their Pearson correlation coefficient (r = −.73, p < .01), further verifying the importance of terrain factors in the framework.
Indicator Construction and Methodology
Indicator Construction
The Coupling Coordination Degree Model was selected for this study because of its unique ability to quantitatively assess the complex relationships between multiple subsystems that characterize river basin logistics development. Unlike conventional methods that examine relationships between isolated factors, this model enables us to systematically analyze the degree of balanced development between economic benefits, environmental impacts, and social services within the logistics sector. This is particularly relevant in river basin contexts, where sustainable development requires harmonization between economic growth objectives and environmental protection imperatives within complex geographic settings. The selection criteria for indicators adhere to the principles of comprehensiveness, measurability, availability, and theoretical relevance (Table 2).
Logistics Industry Coupling Coordination Index System.

This model has been successfully applied in analyzing coordinated development relationships across multiple domains, including urban-rural integration (X. Chen et al., 2023) and economic-ecological systems (J. Wu et al., 2022), but has rarely been deployed in logistics spatial analysis at the river basin scale. Its application in this context allows us to identify systemic imbalances between development dimensions and provide empirical support for regionally differentiated development strategies that respond to the specific characteristics of different river basin environments. Furthermore, by incorporating entropy weighting methods for indicator evaluation, the model provides an objective assessment framework that adjusts to the changing relevance of different factors over time, capturing the dynamic nature of logistics system evolution. The mathematical formulation for this model is expressed as:


Where C represents the coupling degree; D is the coupling coordination degree; T is the comprehensive evaluation index; U1, U2, and U3 are the respective development levels of the economic, environmental, and social subsystems; For quantitative processing, the entropy weight method with differential standardization procedures for positive and negative indicators was used to ensure methodological rigor and comparability, and α1, α2, and α3 are weight coefficients determined via the entropy weight method, which objectively assigns weights based on data variation, with values fluctuating annually to reflect changing subsystem conditions (X. Chen et al., 2023).
This integrated framework operationalizes logistics sustainability through three synergistic subsystems: the economic, quantified by capital input (fixed asset investment), value creation (industrial added value), and structural metrics (employment, enterprise density) to assess developmental intensity; the environmental, employing standardized metrics for energy consumption and pollutant emissions to evaluate ecological efficiency and impacts in line with national governance priorities (X. Chen et al., 2023; X. Wu et al., 2022); and the social, measuring transportation service capacity and public service accessibility (e.g., post and telecommunication services) to gauge equitable distribution and quality of life, providing a more holistic evaluation than purely economic measures (O’Connor, 2010; Sha et al., 2025).
Geographic Detector
The geodetector is a robust spatial statistical tool whose core function lies in analyzing spatial heterogeneity and its underlying driving mechanisms, with notable merits including easy operation and minimal sample restrictions (Wang & Xu, 2017). Due to these advantages, it has been widely applied in multiple fields, such as natural resources and environment (Qiao et al., 2022), Spatial pattern of watershed territory (Lin et al., 2025), and ecological protection (Y. Guo et al., 2024), providing reliable quantitative support for revealing the internal mechanisms of spatial differences in various research objects (Table 3).
Classification of Interaction Types.
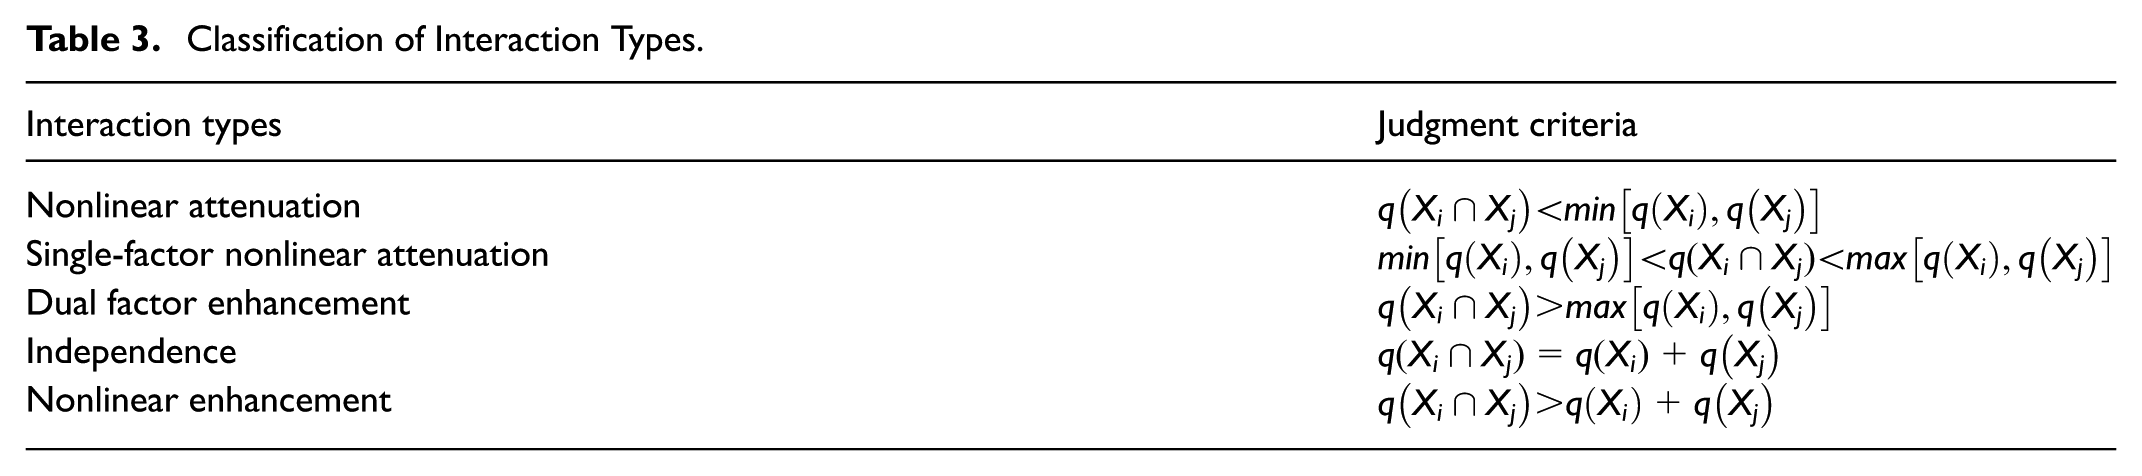
The selection of this model for exploring the driving factors of logistics industry inequality within river basins is justified by three key aspects: first, in terms of research objective compatibility, logistics industry inequality in river basins is essentially a phenomenon of spatial heterogeneity in the distribution of the logistics industry, which highly aligns with the model’s core capability of analyzing spatial heterogeneity and its driving forces; second, regarding prominent technical advantages, the model’s characteristics of easy operation and few sample constraints ensure reliable analysis of spatial heterogeneity and driving factors even when sample size is limited or data acquisition is challenging, significantly enhancing the feasibility of this study; third, in terms of strong quantitative analysis capability, the model calculates the q-statistic to quantify the explanatory power of each factor on the spatial pattern (with q-values ranging from 0 to 1, showing a positive correlation with explanatory power), which can accurately measure the contribution of different factors to the spatial phenomenon of logistics industry inequality in river basins and meet the research’s demand for quantitative identification of driving factors. In this study, the geodetector is specifically applied to identify the factors driving logistics industry inequality within river basins, thereby revealing the mechanisms behind such spatial disparities, and its core calculation formula is as follows:

Where
Data Collection Details
Since July 2005, the China Federation of Logistics and Purchasing has conducted annual assessments based on standardized criteria outlined in Classification and Assessment Indicators for Logistics Enterprises (national standard: GB/T 19680). Building on this standardized assessment framework, the initiative has yielded a nationally consistent dataset that is critical for rigorous logistics enterprise analysis (Figure 3). Our study leverages this dataset to examine 8,135 cumulative Class A logistics enterprises, focusing on 168 data-complete cities across China’s six major river basins over the 2005 to 2023 period. Notably, the 2023 cumulative sample reveals distinct hierarchical characteristics: 3A-level and 4A-level enterprises account for 44.9% and 38.5% of the total, respectively, and collectively make up 83.4%, thus forming the core of the Class A logistics sector. In contrast, 5A-level enterprises (5.9% of the total) embody top-tier service capabilities, while 2A-level (9.7%) and 1A-level (1.0%) enterprises function as foundational and niche segments, respectively.
In parallel with analyzing enterprise hierarchical distribution, ensuring the reliability of geographic analysis was essential to contextualizing these trends within China’s six major river basins. To this end, we first defined the initial geographic scope based on city-level administrative units, which aligns with data from China’s National Basic Geographic Information Database (2022). To refine this scope and eliminate data biases, a two-stage exclusion process was implemented: First, county-level administrative units (such as county-level cities and forestry districts) with fragmented enterprise records were removed; Subsequently, cities within each basin with critical data gaps were further screened out. Specifically, these gaps included the absence of assessment data for three or more years, unobtainable address information for geocoding, and unimputable key statistical indicators. The final result was a set of 168 data-complete cities, distributed across the basins as follows: The Yangtze River Basin contains 55 cities (32.7% of the total), the Pearl River Basin has 32 cities (16.7%), the Yellow River Basin includes 28 cities (19.1%), the Haihe River Basin comprises 20 cities (11.9%), the Huaihe River Basin has 18 cities (10.7%), and the Songliao River Basin contains 15 cities (8.9%).
To ensure accurate spatial alignment of enterprises across the 108 cities, a two-tier verification protocol was employed in the geocoding process. The primary matching phase, achieving a 95% success rate, involved cross-referencing official enterprise addresses with the Tianyancha business registry ( www.tianyancha.com ) and utilizing the Amap Open Platform API (https://lbs.amap.com/) for geocoding, ensuring an accuracy of ±10 m. This initial process also included manual verification for ambiguous addresses. For the 342 enterprises that required secondary verification, representing approximately 4.2% of the total for 2023, a multi-source triangulation approach was adopted to address any inconsistencies. This methodology leveraged company websites, Baidu Maps street view imagery, and historical address records. In addition to these geocoding initiatives, rigorous quality control procedures were implemented to ensure data reliability, encompassing three critical checks: administrative boundary compliance (with three outliers corrected), tracking of temporal consistency (with no anomalies identified), and spatial plausibility verification against land use data (resulting in 11 adjustments). For missing statistical indicators, which accounted for 2.3% of all indicator-year-city combinations, predictive mean matching was employed.
Multi-Scale Analysis Results
Buffer Zone and Equitability Indicators
In Geographic Information Systems (GIS), buffer zone analysis serves as a spatial analysis tool used to address proximity issues, involving the automatic creation of buffer polygon layers within a certain width around point, line, and area entities, which can reveal the influence or service range of specific geographic elements and their spatial relationships with other components. The impact of hydrological and road networks is particularly crucial for the layout of logistics enterprises.
On the one hand, water systems, as significant natural elements, influence the surrounding environment and human activities to the extent that this influence is defined by setting buffer zones at specific distances. As shown in Figure 4, the number of A-level Logistics Enterprises within a 5-km buffer zone of the water system is 2,171, then increases to 3,031 within a 10-km range, indicating that as the buffer zone radius expands, the area of influence of the water system also increases, including more geographic space and elements related to the siting of logistics enterprises. On the other hand, roads, as components of transportation networks, significantly affect land use and landscape patterns in adjacent areas. The direct and potential impacts of roads on neighboring areas were evaluated by setting buffer zones of 1 and 5 km. In Figure 3, the 1-km road buffer zone includes 4,245 point elements, then increases to 6,190 within a 5-km range, revealing that the radiating effect of roads on surrounding logistics enterprises strengthens as the distance increases.

Analysis of water system and road buffer zones in A-level logistics enterprises.
Geographic Information Systems (GIS) was used to study spatial distribution patterns, conduct spatial cluster analysis, and assess class imbalance issues within datasets, during which the Nearest Neighbor Index (NNI), Geographic Concentration (GC), and Imbalance Index (IMI) were widely utilized. NNI focuses on the distribution characteristics of spatial points, GC on the degree of concentration of industries or economic activities in geographical space, and IMI on class imbalance issues within datasets. The Nearest Neighbor Index measures the proximity between spatial data points; an NNI less than 1 typically indicates that data points are spatially clustered; an NNI greater than 1 indicates that data points are spatially dispersed; an NNI close to 1 suggests that the distribution of data points is close to random. The Geographic Concentration index measures the concentration of spatial data, which is positively correlated with the GC value. The Imbalance Index is used to assess class imbalance issues within datasets; The larger the absolute value of IMI, the higher the degree of imbalance.
Table 4 displays the distribution of NNI, GC, and IMI values over time from points to areas in different river basins. Overall, logistics enterprises within the basins tend to shift from a clustered state to a significantly clustered state. Here, a single ↓ indicates an increase in clustering, ↑↓ suggests a decrease in clustering followed by a rise, ↑ indicates a continuous increase followed by a reduction in clustering, and ↓↑ indicates an initial increase followed by a decline. For example, in the Liaohe River Basin, the Nearest Neighbor Index decreases from 0.61 in 2008 to 0.29 in 2023, the Geographic Concentration increases from 34.23 to 37.19, and the Imbalance Index fluctuates between 0.74 and 0.79. In general, the spatial distribution of logistics enterprises in different river basins shows a diverse trends in terms of Nearest Neighbor Index, Geographic Concentration, and Imbalance Index, reflecting the impact of differences in economic development, transportation infrastructure construction, and industrial layout on the spatial distribution of logistics enterprises in each basin, and underscoring the necessity for an in-depth study on these changes from a multi-scale perspective.
Regional Equitability Indicator Values.

Note. NNI = Nearest Neighbor Index; GC = Geographic Concentration; IMI = Imbalance Index.
Spatial Feature Analysis
Standard Deviational Ellipse (SDE) is an analytical method used to describe the directional and dispersed characteristics of the spatial distribution of geographic elements and specific calculations. To capture the 18-year evolutionary dynamics of the sector, four temporal snapshots (tracking cumulative counts up to each respective year) were analyzed. As shown in Figure 5, the study of the spatial distribution of logistics enterprises summarizes the distribution characteristics of logistics enterprise nodes in two-dimensional space by constructing a standard ellipse. The center of the ellipse represents the average central position of the logistics enterprise distribution, and the major and minor axes of the ellipse respectively reflect the dispersion of logistics enterprises in the primary and secondary directions. The longer the major axis, the more dispersed the distribution of logistics enterprises in that direction; the shorter the minor axis, the more concentrated the distribution perpendicular to the major axis.

Spatial distribution point map of A-level logistics enterprises in the six major rivers.
As shown in Figure 5, SDE exhibits diverse evolutionary patterns when studying the spatial distribution of logistics enterprises in different river basins and years. The directional trend is from northeast to southwest in the Liaoh River Basin and Hai River Basin, from west to east in the Yellow River Basin and Huai River Basin, and from east to west in the Yangtze River Basin and Pearl River Basin. Economic development patterns reveal that resource endowments, industrial structures, and economic development levels vary across different regions, resulting in shifts in the directions and intensities of logistics demand. For example, the complementary resources and industries in the northeastern and southwestern areas of the Liaohe and Haihe river basins (Northeast Revitalization Plan, Beijing-Tianjin-Hebei logistics integration and coordinated development) have promoted logistics enterprises to adjust their layout between these two regions to meet the needs of material circulation; The economically developed eastern region has a strong demand for logistics services. Business expansion to the western region also conforms to the trend of economic development as regional economic integration advances. In terms of transportation network layout, the construction of transportation infrastructure has a significant impact on the distribution of logistics enterprises. The extension of highways, railways, and other infrastructures in specific directions can indeed facilitate the expansion of logistics enterprises. For instance, affected by transportation facilities (Belt and Road construction), the Yellow River Basin and Huai River Basin have formed a logistics channel from west to east; The water systems of the Yangtze and Pearl River basins, as important transportation arteries, can also promote the layout and expansion of logistics enterprises along the water systems.
Policy and Market Influences
From a policy perspective, the government’s increased support for the central and western regions will promote economic growth and industrial transfer in the western areas, thereby strengthening economic connections and logistics activities in the east-west direction. Table 5 presents a clear comparison of the similarities and differences between the Standard Deviational Ellipse and the centroid model, as well as the spatial autocorrelation and kernel density results. Policy interventions significantly reshape the spatial distribution of logistics through their interaction with market mechanisms. We analyze three basin development strategies to reveal distinct policy-market dynamics: the Yangtze River Economic Belt demonstrates growth amplification through policy-market alignment, the Guangdong-Hong Kong-Macao Greater Bay Area reveals unintended concentration from market dominance, and the Beijing-Tianjin-Hebei region achieves successful redistribution through comprehensive intervention.
Results of Spatial Feature Analysis.
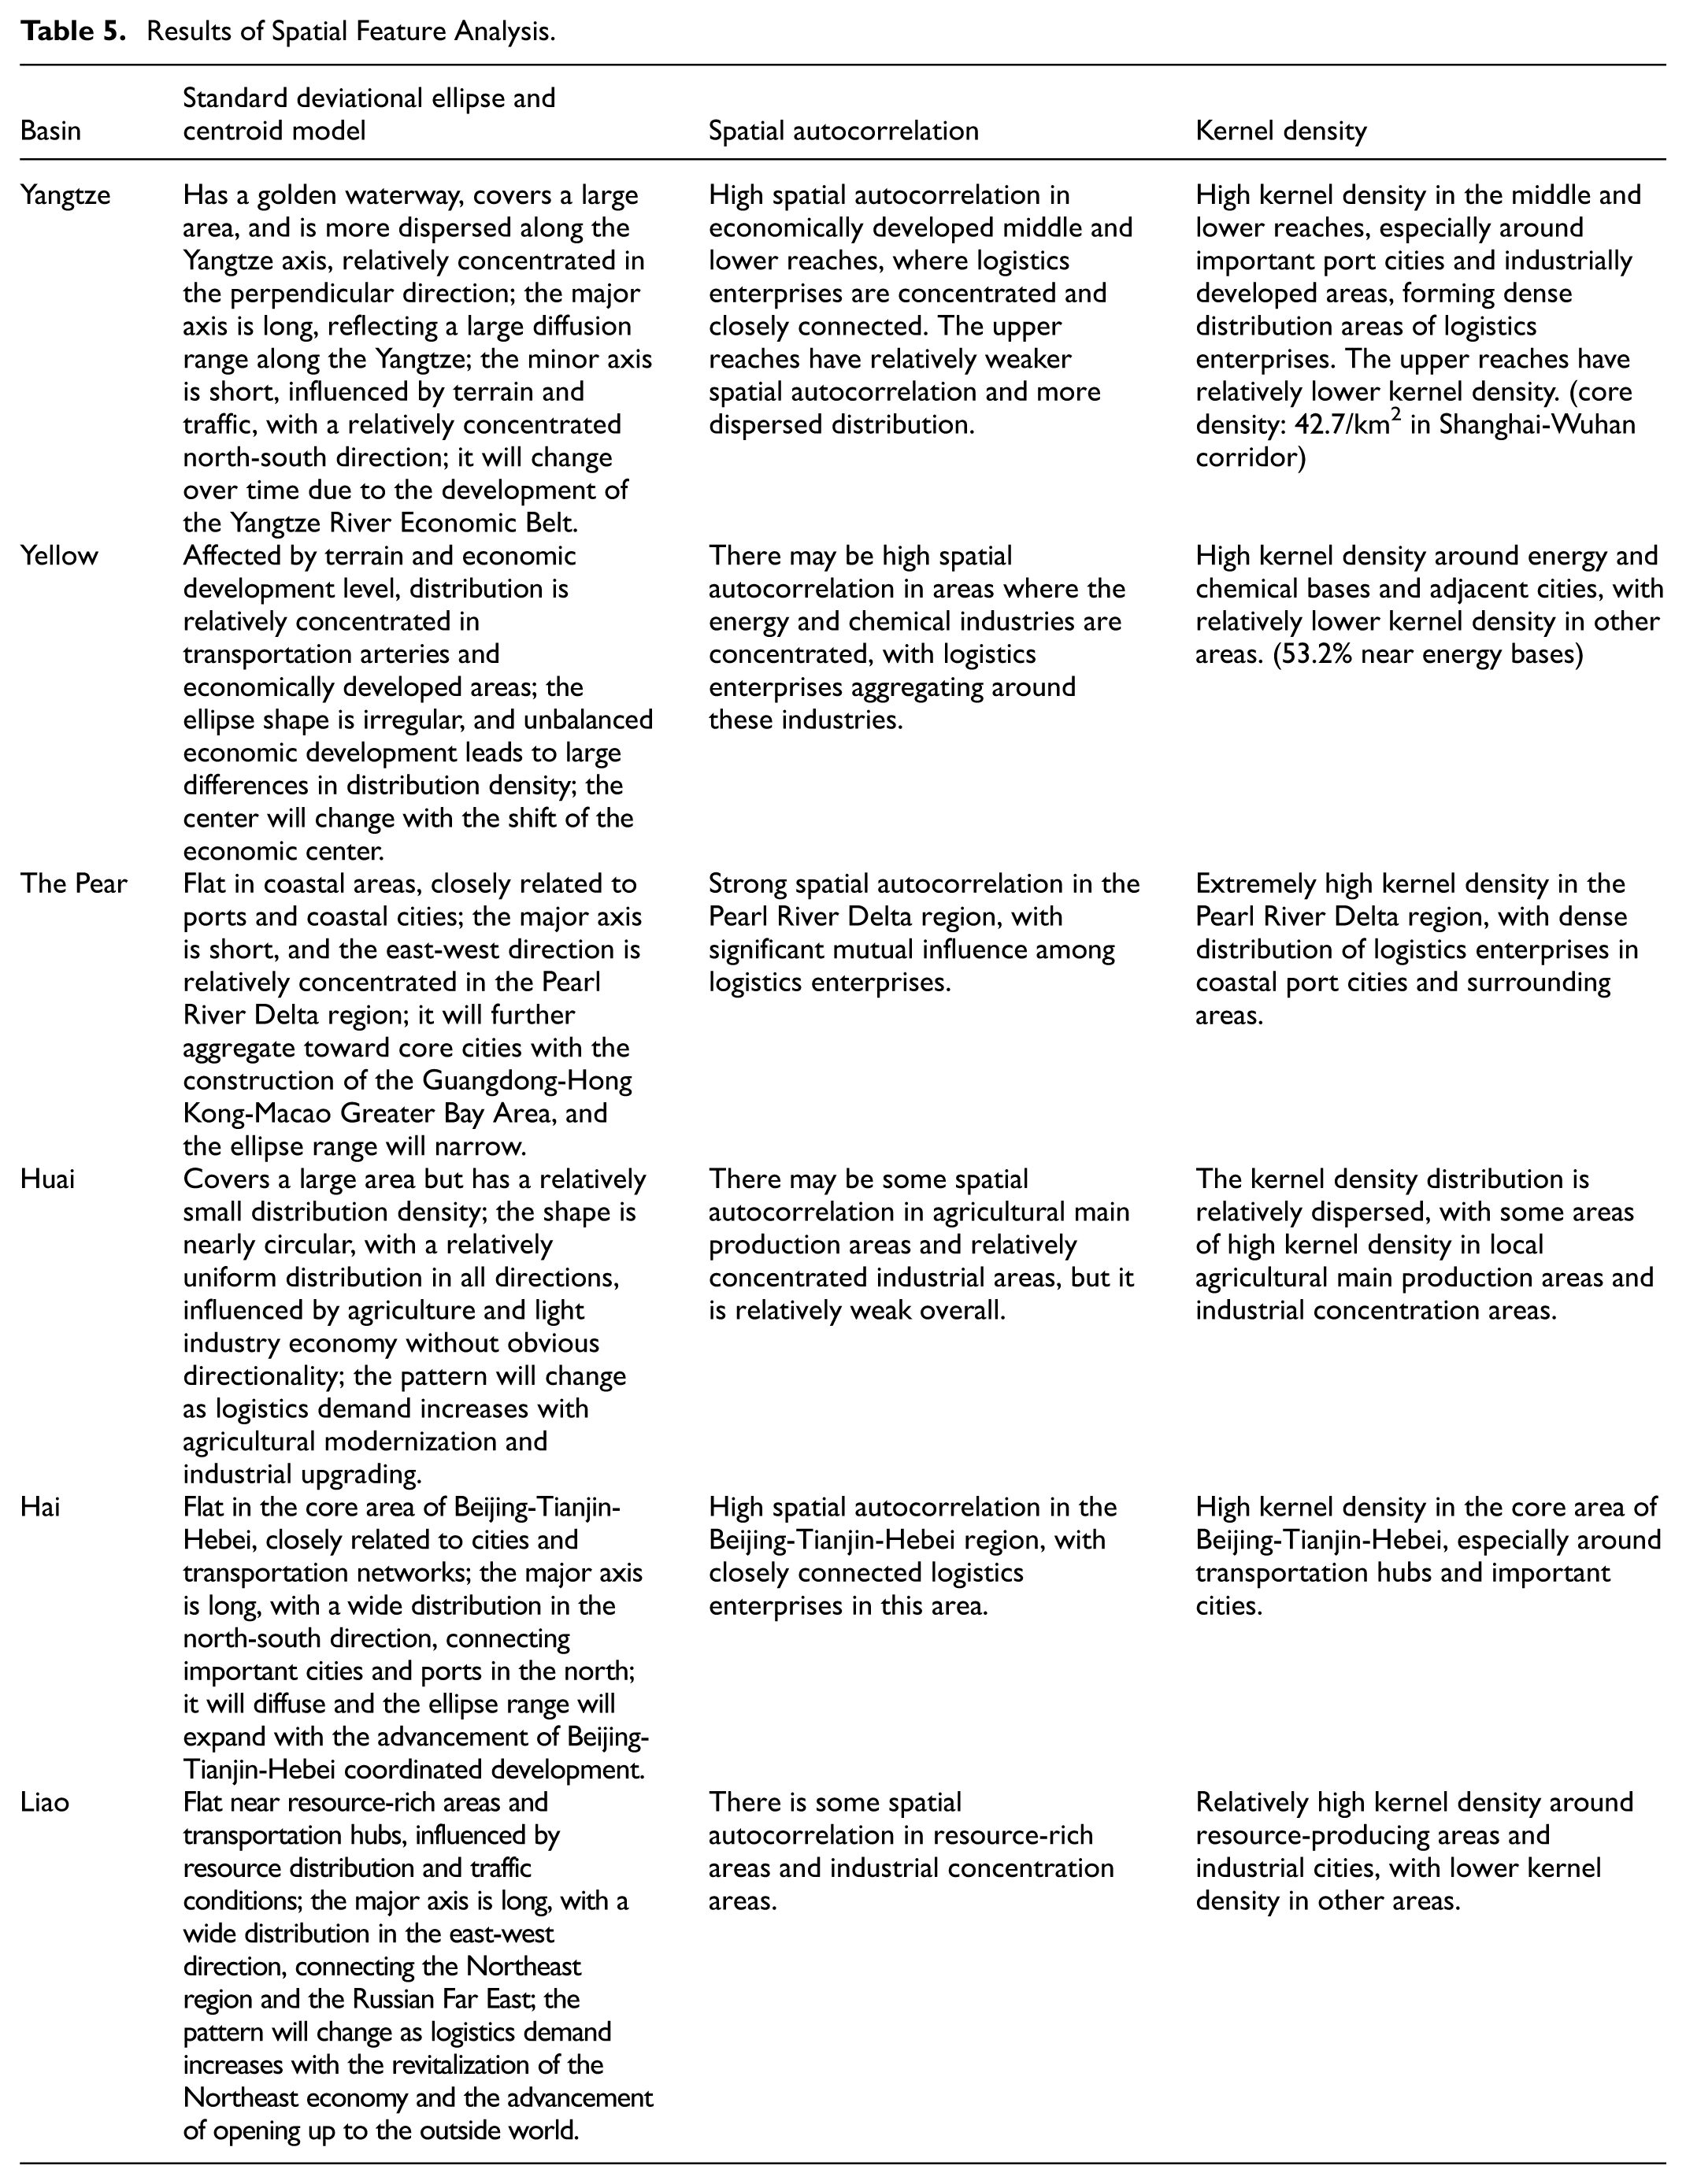
The Yangtze River Economic Belt Development Plan (2016) succeeded by reinforcing existing advantages, with average annual enterprise growth accelerating from 8.7% (2013–2016) to 13.4% (2016–2019), while riverside cities achieved 15.2% annual growth versus 9.8% in non-riverside cities through targeted waterway infrastructure investment that amplified geographical advantages (X. Kang et al., 2024). Conversely, the Greater Bay Area Outline (2019) reveals policy limitations when market forces dominate: despite balanced development objectives, high-grade enterprise density in core cities increased 21.7% (2019–2023), tripling the 7.4% national rate, as deep-water port monopolies, concentrated technology ecosystems, and demand agglomeration overwhelmed peripheral development incentives (Lin et al., 2025). The Beijing-Tianjin-Hebei Strategy (2014) achieved genuine redistribution despite market resistance, with Beijing’s enterprise share declining from 41.3% to 33.8% while Hebei’s increased from 29.2% to 34.9%, redirecting approximately 180 enterprises through comprehensive multi-instrument coordination including regulatory constraints, fiscal incentives, and infrastructure investment that created competitive alternatives to Beijing’s market advantages (B. Wang & Yu, 2024).
Analysis of LCCD Influencing Factors Based on the OPGD Model
Coupling Coordination Degree Assessment
As shown in Table 6, analysis of the coupling coordination in different years displays that the Haihe River Basin and the Yangtze River Basin consistently rank at the top, while the Yellow River Basin and the Songliao Basin are at the bottom. U1-, U2-, and U3- represent the economic, environmental, and social subsystems, respectively. The coupling coordination analysis revealed several critical problems in river basin logistics development: (a) Significant coordination imbalances between economic growth and environmental protection, particularly in the Yellow River Basin (coordination degree 0.339) and Songliao Basin (0.299). (b) Higher coordination in the Yangtze (0.480) and Pearl River (0.476) Basins was achieved through effective infrastructure-policy integration. (c) The environmental subsystem consistently underperforms economic development (U32 = 0.163 vs. U31 = 0.188), indicating unsustainable development patterns. (d) Temporal fluctuation in coordination (declining from 0.363 in 2013 to 0.342 in 2018 before recovering to 0.422 in 2023) demonstrates the effectiveness of policy interventions. On average, the coupling coordination degree of the social subsystem is greater among the three subsystems.
Coupling Coordination Degree Assessment Results.

Influencing Factors Analysis
Previous studies have indicated that the spatial distribution of logistics enterprises is affected by multiple factors (Lagorio et al., 2016; Liang et al., 2022; S. Liu et al., 2022). Factors such as the proportion of transportation fiscal expenditure to total fiscal expenditure (TFE), population density (PD), per capita gross domestic product (PGDP), total retail sales of consumer goods (FILB), actual foreign capital used in the current year (FD), fiscal decentralization (PA), year-end balance of various loans from financial institutions (MPY), number of patent applications (TDH), the number of mobile phone users at the end of the year (TRSCG), and the total mileage of roads within the territory (AFIU) are all considered relevant to the distribution of logistics enterprises. However, current research still has some limitations regarding the specific correlations between these factors and their comprehensive impact on the distribution of logistics enterprises.
Before using the OPGD analysis, a correlation analysis was conducted on the factors affecting the spatial distribution of logistics enterprises, as shown in Figure 6, to demonstrate the rationality of the selection of influencing factors, among which TFE did not have a significant impact for multiple years and was therefore removed in subsequent analysis. OPGD includes single-factor detection in Table 6 and factor interaction detection in Figure 7, calculating the q-value for each factor to represent its explanatory power on the spatial distribution of logistics enterprises. The q-value ranges from 0 to 1, with a higher q-value indicating a stronger explanatory capability.

Factor correlation analysis.

Factor interaction detection results.
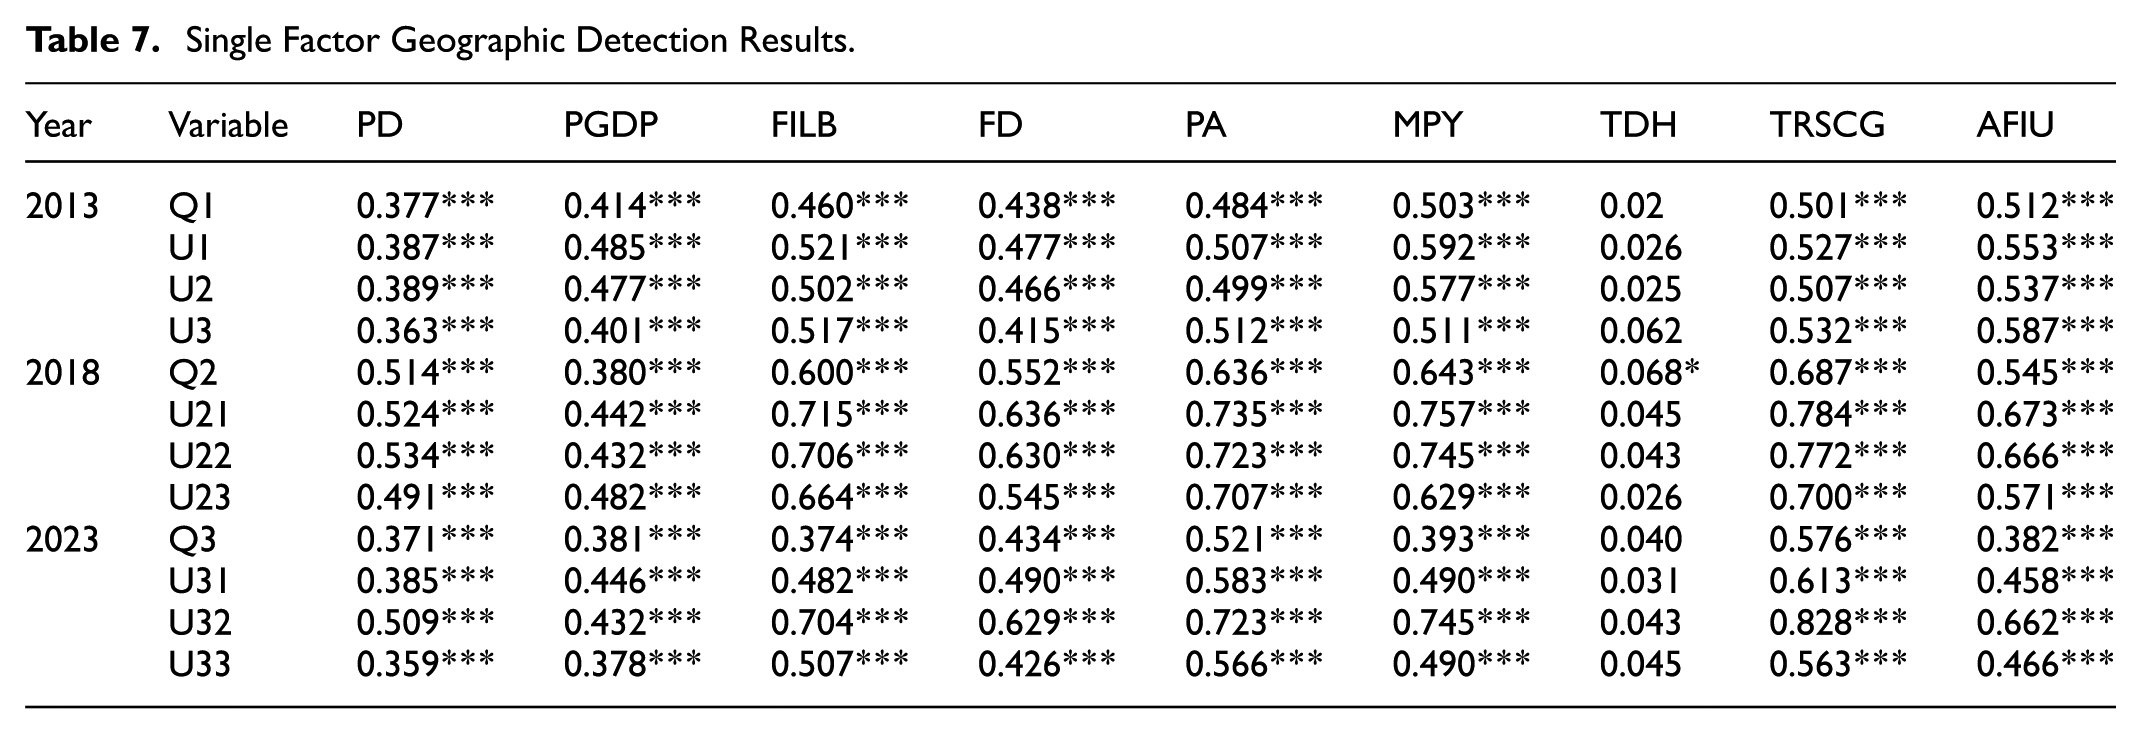
Single Factor Analysis
Results of the univariate analysis are shown in Table 7. The analysis reveals that: (a) Factors such as FILB, FD, PA, TRSCG, MPY, and AFIU have greater explanatory power, while TDH has a lower impact and did not pass the significance test; All other factors pass the 1% significance level. (b) A higher value of FILB indicates more frequent circulation of goods, directly stimulating logistics demand and prompting logistics enterprises to gather in areas with high consumer activity, so as to serve the distribution and supply of goods better. (c) Higher FD, PA, and MPY imply more funds available for the development and expansion of logistics enterprises; Sufficient funding enables logistics enterprises to invest in facility construction, technology upgrades, and business expansion, thereby affecting their layout and scale of development. (d) A good TRSCG is conducive to the transmission and management of logistics information, thereby improving the efficiency and accuracy of logistics operations. Meanwhile, the total mileage of internal roads, as a key indicator of AFIU, implies that the more developed the road network, the higher the accessibility and efficiency of logistics transportation. Consequently, logistics companies tend to locate in areas with convenient road transport to reduce transportation costs and improve service timeliness.
Single Factor Geographic Detection Results.
Factor Interaction Analysis Based on Porter’s Diamond Model Framework
The interaction analysis reveals several significant patterns that validate Porter’s theory in the context of river basin logistics spatial evolution (Figure 7): To analyze the complex interactions revealed by the OPGD results systematically, factors were categorized within Porter’s Diamond Model framework: factor conditions (patent applications TDH, total road mileage AFIU), demand conditions (per capita GDP, total retail sales of consumer goods FILB), related and supporting industries (year-end loan balance from financial institutions MPY, actual foreign investment utilized FD), and institutional environment (fiscal decentralization PA).
First, the interaction between factor conditions and demand conditions demonstrates strong dual-factor enhancement effects. The interaction between patent applications and per capita GDP yields a q-value of 0.68, indicating a mutual enhancement between innovation capacity and market demand in shaping logistics spatial patterns, which confirms Porter’s assertion that advanced factor conditions (innovation) combined with sophisticated demand conditions create stronger competitive advantages than either factor alone.
Second, related supporting industries and institutional environment exhibit nonlinear enhancement interactions. For instance, the interaction between actual foreign investment utilized and fiscal decentralization (q = 0.72) suggests that institutional innovation creates a multiplier effect for attracting foreign capital in logistics development. Similarly, the year-end loan balance from financial institutions interacts with fiscal decentralization to significantly improve the financing environment for logistics enterprises in regions with high degrees of fiscal decentralization.
Third, complex interaction chains are observed among multiple elements of the Diamond Model. In densely populated and economically developed regions, high population density provides ample labor resources (basic factor conditions) while supporting large consumer markets (demand conditions). Meanwhile, transportation infrastructure (an advanced factor condition) interacts with communication technology (related industries), as evidenced by the significant interaction between road mileage and mobile phone users, thereby improving logistics efficiency and expanding service scope.
Fourth, the interaction between patent applications and industrial SO2 emissions exhibits a nonlinear decay (q = 0.41), indicating a conditional mitigating effect of technological innovation on environmental impacts and reflecting the complex relationship between advanced factor conditions and sustainable development constraints.
In summary, these interaction patterns vary across different river basins. Regions characterized by well-developed infrastructure, active technological innovation, and strong institutional support exhibit significant advantages in logistics development. These findings empirically validate the applicability of Porter’s Diamond Model in explaining the formation mechanisms of river basin logistics spatial patterns and provide a theoretical foundation for developing differentiated logistics strategies.
Discussion
Theoretical Contributions
The nature-culture integration framework conceptualizes logistics spatial evolution as emerging from dual constraints. Natural constraints operate through topographical influence, as evidenced by 68.3% of high-grade enterprises clustering below 500 m elevation, hydrological effects whereby water system proximity reduces costs, and climate conditions affecting operational patterns through temperature and precipitation variations. Cultural-economic constraints interact through institutional frameworks involving policy interventions, technological capabilities enabling infrastructure development, and market structures reflecting demand concentrations. Critically, these produce non-additive interaction effects. Water system proximity becomes particularly advantageous when combined with institutional support and port infrastructure, creating multiplier effects, which extend Porter’s Diamond Model by recognizing that competitive advantages emerge from how factor conditions, demand, related industries, and institutions interact with basin-specific geographical determinants.
Our Findings Engage Four Theoretical Perspectives
Challenging Spatial Homogeneity Assumptions. Recent logistics geography acknowledges spatial heterogeneity but struggles to analyze it systematically. Guerrero et al. (2022) demonstrate warehouse activity heterogeneity within urban areas, while S. Kang (2022) identifies distinct phases in Seoul’s logistics sprawl. However, single-city designs limit comparative insights. Our basin-scale analysis reveals that individual factors show modest explanatory power with q values below 0.6, whereas dual-factor interactions dominate in 18 of 36 pairs. Innovation-demand synergy achieves q values of 0.68, exceeding combined effects by 56%, which quantifies Zhang et al. (2025) qualitative theory that spatial patterns emerge from contextual interactions rather than universal mechanisms. We advance by revealing systematic variation: identical factor combinations produce different outcomes across basins depending on geographical context.
Extending Coupling Coordination Theory. Z. Wu et al. (2022) propose that sustainable development requires analyzing coupled systems, demonstrating that SDG decoupling is followed by re-coupling as development progresses. S. Chen et al. (2023)reveal spatial correlation networks linking pollution reduction with economic growth. We extend this framework to logistics-specific river basin contexts. The Yangtze Basin achieves high coordination at 0.480 through infrastructure-policy integration, supporting the re-coupling thesis. However, the Yellow River Basin maintains persistently low coordination at 0.339 despite policy interventions, revealing critical limitations identified by (Tan et al., 2025). Ecological fragility creates fundamental constraints where re-coupling proves elusive. This geographical specificity advances coupling coordination theory: development trajectories depend critically on environmental carrying capacity, not merely institutional design. We integrate Strale’s (2020) temporal dynamics of decoupling to re-coupling with spatial heterogeneity concerning context-dependent feasibility.
Contributing to Sustainable Transport Debates. Research debates whether technological innovation alone enables sustainability transitions. Liotta et al. (2023) analyze 120 cities and demonstrate environmental gains via transport policy portfolios, supporting technological optimism. Conversely, Ding and Liu (2024) identify persistent inefficiencies in China’s logistics despite technological advances, suggesting structural constraints. Our basin-scale evidence reveals that both perspectives hold context-dependently. The Yangtze Basin’s coordination success aligns with He et al. (2019), where comprehensive policy portfolios combining modal shifts, digital platforms, and infrastructure investment enable sustainability gains. However, the Yellow River Basin validates concerns raised by Kazmi et al.’s (2025) in ecologically fragile contexts, where technology alone cannot overcome environmental carrying capacity limits, which resolves the debate: sustainability transitions succeed where geographical conditions permit sufficient water resources and moderate topography but face fundamental barriers where ecological fragility dominates through water scarcity and desertification risk. Geography emerges as critical in determining technological effectiveness, an insight overlooked by city-level studies ignoring basin-scale environmental heterogeneity, as noted by (Tuan & Lan, 2025).
Connecting to Regional Development Theory. J. Wang et al. (2025) demonstrate how high-speed rail creates uneven benefits, while Sha et al. (2025) reveal phasing effects in urbanization’s eco-environmental impacts. Our findings extend these insights to logistics contexts. The Pearl River Delta’s intensifying concentration despite balanced policies exemplifies findings by L. Wang et al. (2025) that infrastructure can amplify spatial inequality when market advantages concentrate in core zones. Coordination degree variation ranging from 0.299 to 0.480 validates the phasing concept of Sha et al. (2025), suggesting that regions occupy distinct stages of development-environment relationships. However, Beijing-Tianjin-Hebei redistribution demonstrates that comprehensive institutional portfolios can counteract market-driven concentration, qualifying deterministic interpretations. While geography constrains possibilities, coordinated policy action retains transformative capacity.
Policy Implications
Comparative analysis across the six major river basins reveals that policy effectiveness fundamentally depends on alignment between intervention strategies and geographical contexts, requiring differentiated approaches that respond to basin-specific constraints and opportunities (See Appendix Table S1). For ecologically fragile watersheds such as the Yellow River Basin, where coordination remains critically low (0.339) and environmental subsystem development lags significantly, policy priorities must center on ecological protection mechanisms. Drawing on Guo and Ma’s (2021) environmental governance framework, effective interventions include mandating green technology adoption for the 53.2% of enterprises concentrated near energy bases, establishing permit systems linked to ecological restoration that address what Ding and Liu (2024) identify as persistent carbon efficiency deficits, and developing multimodal transport networks that leverage underutilized waterway capacity. In contrast, developed corridors like the Yangtze Basin, characterized by relatively high coordination but facing extreme spatial concentration (peak density 42.7/km2), require infrastructure-technology integration strategies aligned with Liotta et al.’s (2023) comprehensive policy portfolio approach. These include modal shift mandates within navigable waterway zones, digital platform deployment addressing spatial correlation network inefficiencies in carbon emissions identified by X. Kang et al. (2024), and secondary port investments that disperse concentration pressures following Cao et al.’s (2025) findings on multi-dimensional spatial peer effects. Meanwhile, basins experiencing pronounced spatial inequality, such as Haihe and Huaihe, necessitate urban-rural integration interventions that respond to what Lin et al. (2025) characterize as regional differences in watershed territorial space patterns, incorporating rural network subsidies, integration corridors, and polycentric governance mechanisms advocated by Schlager et al. (2025).
Limitations and Future Research
Research limitations acknowledge three constraints. First, data scope: our analysis focuses on officially certified Class A enterprises, which may underrepresent informal operators, who are estimated to comprise 20% to 30% of logistics activity in peripheral regions. Second, causal identification: while geographical detectors quantify associations and interactions, establishing definitive causality requires complementary approaches, such as natural experiments, quasi-experimental designs, or instrumental variable methods that address endogeneity concerns.
Future research directions include four priorities. First, comparative international analysis: applying our framework to other major basins (Mekong, Rhine, Murray-Darling) would test its generalizability across institutional contexts and development stages, revealing whether nature-culture interaction patterns transcend China-specific conditions. Second, climate change integration: incorporating future climate scenarios (water availability projections, extreme weather frequencies) would examine how environmental constraints may intensify, potentially rendering current coordination strategies obsolete. Third, governance mechanism investigation: while our quantitative findings identify what differs across basins, explaining how these differences emerge requires qualitative case studies examining specific institutional arrangements, stakeholder negotiations, and implementation processes that enable or constrain coordination.
Despite these limitations, this study establishes the conceptual and methodological foundations for geographically informed research on sustainable logistics. By demonstrating that spatial patterns emerge from complex nature-culture interactions that vary systematically across geographical contexts, we provide an evidence-based rationale for context-specific rather than universal policy approaches, contributing to both logistics geography scholarship and sustainable river basin management practice.
Conclusions
This study establishes a nature-culture integration framework examining logistics enterprise spatial evolution across China’s six major river basins (2005–2023). Integrating GIS spatial analysis, coupling coordination assessment, and Optimal Parameter Geographical Detector techniques, we identify distinctive spatial patterns, quantify subsystem coordination, and decipher nonlinear multi-factor interactions.
Three primary findings emerge. First, dual constraints shape spatial distribution. Natural factors create foundational patterns: 68.3% of high-grade enterprises cluster in plains below 500 m elevation, with density increasing 39.6% within 5 to 10 km water system buffers. These natural endowments interact with institutional and economic drivers, producing systematic corridor effects. Second, basin-specific heterogeneity reflects regional distinctiveness. The Yangtze Basin exhibits dual-core axial development (peak density: 42.7/km2); the Pearl River Basin shows port-driven concentration; the Yellow River Basin demonstrates ecological fragility with 53.2% of enterprises near energy sources. Third, factor interactions display complex nonlinearity. Innovation-demand synergy (q = 0.68) validates Porter’s complementarity thesis, while fiscal-environmental interactions exhibit nonlinear decay (q = 0.41), revealing conditional trade-offs.
Theoretical contributions advance three domains. For logistics geography, we challenge single-factor determinism by quantifying interaction effects and demonstrating that spatial patterns emerge from factor complementarity rather than accumulation. For sustainability science, we resolve efficiency-environment debates by revealing context-dependency: coordination proves achievable in robust environments (Yangtze). Still, it faces constraints in fragile regions (Yellow River), connecting transport geography with ecological economics perspectives on carrying capacity. For regional development theory, we integrate temporal dynamics with spatial heterogeneity, demonstrating that development trajectories depend critically on geographical context, challenging universal stage models while validating coordinated policy intervention tailored to regional conditions.
Policy implications derive directly from findings. The Yellow River Basin’s environmental weakness and enterprise concentration near pollution sources (53.2%) require ecological priority interventions: green technology mandates, compensation mechanisms, and modal shifts. The Yangtze Basin’s high density (peaks: 42.7/km2) necessitates intensifying sustainability through waterway modal shift mandates and digital platforms. The Pearl River Basin’s port-driven model requires enhanced port-hinterland coordination: optimizing multimodal connectivity, facilitating cross-border operations, and integrating port-city functions. The Haihe and Huaihe Basins need integration strategies, rural network subsidies and urban-rural corridor development to address core-peripheral disparities. These differentiated approaches challenge uniform national policies, demonstrating that universal prescriptions prove ineffective across heterogeneous contexts.
The study’s value extends beyond China. The nature-culture integration framework and its analytical logic—“dynamic coupling of natural constraints and human adaptation”—transfers to major international basins (Mekong, Rhine, Murray-Darling) balancing development and protection. The OPGD-based multi-factor quantification method overcomes single-region limitations, providing replicable tools for evidence-based policy design across diverse geographical contexts, ultimately enabling coordinated development of logistics efficiency and ecological protection globally.
Supplemental Material
sj-docx-1-sgo-10.1177_21582440251408650 – Supplemental material for How Sustainable Logistics Emerges From Spatial Constraints: A Nature-Culture Integration Perspective Across China’s River Basins
Supplemental material, sj-docx-1-sgo-10.1177_21582440251408650 for How Sustainable Logistics Emerges From Spatial Constraints: A Nature-Culture Integration Perspective Across China’s River Basins by Yu Tian, Bangjun Wang and Ziyu Li in SAGE Open
Footnotes
Ethical Considerations
As this research involves exclusively secondary analysis of aggregated institutional data without human subject interaction, formal institutional review board (IRB) approval was not required per our institution’s research ethics guidelines, which exempt studies analyzing publicly available, de-identified institutional records. This study analyzes secondary data from publicly available sources and does not involve direct human subject participation. All enterprise data utilized are obtained from official government databases (China Federation of Logistics and Purchasing, a national industry association authorized to publish enterprise assessment results) and publicly accessible business registries (Tianyancha business information platform). No private, confidential, or personally identifiable information was accessed or analyzed.
Consent to Participate
Informed consent is not applicable to this study, as no human participants were recruited, and all data analyzed are publicly available institutional records. The China Federation of Logistics and Purchasing’s assessment system explicitly permits use of published enterprise classifications for research purposes.
Consent for Publication
All authors have read and approved the paper, which has not been published previously, nor is it being considered by any other peer-reviewed journal.
Author Contributions
Yu Tian, Formal analysis, Methodology, Software, Investigation, Data curation, Writing-original draft, Validation, Conceptualization, Writing-review & editing. Bangjun Wang, Conceptualization, modeling, Resources, Supervision, Writing-original draft, Writing-review & editing. Ziyu Li, Software, Investigation, Data curation, Writing-original draft.
Funding
The authors disclosed receipt of the following financial support for the research, authorship, and/or publication of this article: The authors are very grateful to the anonymous reviewers and editor for their insightful comments that helped us improve the quality of this paper. This research is supported Fundamental Research Funds for Central Universities (2025JCXKSK05), the Graduate Research and Practice Innovation Program of Jiangsu Province (KYCX25_2998), Graduate Research and Practice Innovation Program of China University of Mining and Technology (2025WLKXJ124)
Declaration of Conflicting Interests
The authors declared no potential conflicts of interest with respect to the research, authorship, and/or publication of this article.
Data Availability Statement
The data that has been used is confidential and will be provided upon request. All geographic and statistical data used comply with Chinese data protection regulations. Enterprise locations are reported at aggregate spatial scales (buffer zones, density maps) rather than precise coordinates, protecting individual enterprise operational details while enabling spatial pattern analysis.
Supplemental Material
Supplemental material for this article is available online.
References
Supplementary Material
Please find the following supplemental material available below.
For Open Access articles published under a Creative Commons License, all supplemental material carries the same license as the article it is associated with.
For non-Open Access articles published, all supplemental material carries a non-exclusive license, and permission requests for re-use of supplemental material or any part of supplemental material shall be sent directly to the copyright owner as specified in the copyright notice associated with the article.