
Abstract
Achieving carbon neutrality (CN) has been a consensus worldwide in the current era of intensifying climate change. artificial intelligence (AI), as one of the most promising digital technologies, have achieved amazing development and application during the past years, and also bespoke great potential in reshaping social production and living styles profoundly. Against this backdrop, the role of AI development in achieving CN has arisen the attention of the academia. This study evaluates AI development and CN performance in China using panel data from 30 provinces between 2011 and 2021. Employing the panel Tobit, panel quantile, threshold effect, and spatial Durbin models, it finds that: (1) AI development is characterized a remarkable positive influence on CN and conductive in achieving the CN goals. (2) The positive effect of AI development on CN exhibits nonlinear characteristics, with a stronger impact at lower CN levels. (3) The influence of AI development on CN grows as green fiscal expenditure increases. (4) A spatial spillover effect exists in the impact of AI on CN. Therefore, AI development is suggested to be encouraged to promote the realization of CN goals, especially in developing countries.
Keywords
Introduction
The Fifth Assessment Report of the Intergovernmental Panel on Climate Change emphasized that climate change is primarily driven by increased greenhouse gas emissions from human activities, a conclusion reaffirmed in the Sixth Assessment Report (Wu et al., 2022). The global detriment resulting from the greenhouse emissions has emerged as a pivotal concern in the 21st century, and the idea of carbon neutrality (CN) has been adopted in increasingly more countries (Millot & Maïzi, 2021). According to the Global Carbon Neutral Annual Progress Report 2023, over 150 countries have pledged to achieve CN by the 2050s.
The Carbon Neutrality Standard (PAS 2060) of the British Standards Institution (BSI) defines CN as “the emission of greenhouse gases associated with an object that does not result in a net increase in global emissions of greenhouse gases into the atmosphere” (Lee et al., 2022). Alternatively, CN is achieved when the CO2 emitted by an organization, group, or individual over a given period is offset through forest absorption, anthropogenic conversion, or geological sequestration, thereby attaining “net zero emissions” (Zou et al., 2021). CN promotion has a great potential in reducing carbon and air pollutant emissions, improving air quality and solving environmental problems caused by human activities (Shi et al., 2021).
As an active participant and supporter of global climate governance, China is vigorously implementing its green development strategy, committed to energy conservation, emissions reduction and environmental protection (Omri, 2020), and a clear target of achieving CN by 2060 has been proposed (A. Zhang & Deng, 2022). As illustrated in Figure 1, the continuous increase in China’s total and per capita CE threaten the realization of its CN goal. China’s CN achievement not only implies a major transformation of its economic growth mode and a profound adjustment of energy system, but also has great significance for the global joint response to climate change (Y. Wang et al., 2021).

Trends in China’s CE.
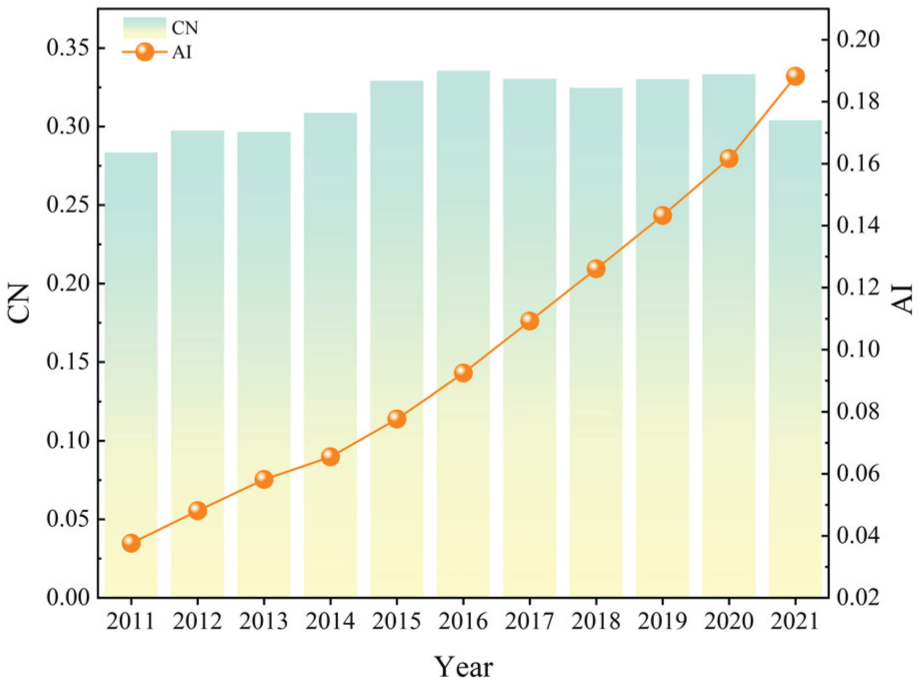
Achieving CN requires concerted efforts across all sectors of society. Artificial intelligence (AI) has been recognized as one of the most promising digital technologies and a leading driver of the Fourth Industrial Revolution (Vinuesa et al., 2020). With unprecedented growth, broad applicability, and profound influence, AI has created significant opportunities for low-carbon development (Tian et al., 2023). Substantial progress has been made in China’s AI development. As illustrated in Figure 2, two key indicators—AI patent applications and industrial robot production—have increased rapidly, demonstrating notable advancement in China’s AI sector.

Trends in China’s AI development.
The impact of AI development on CN can be manifested in multiple dimensions. AI development not only plays a crucial role in developing renewable energy and improving energy efficiency which directly contribute to CE reduction (J. Zhang, 2021), but also helps achieve the intelligent protection and management of forest resources, thereby improving the carbon absorption capacity of forests and increasing carbon sinks (CS; Mishra & Agarwal, 2023). Significant potential has also been demonstrated by AI in facilitating carbon capture, utilization, and storage (Yao et al., 2023). However, it also presents new challenges, namely increased energy consumption and electronic waste. (P. Chen et al., 2022). Moreover, the advancement and utilization of AI technologies may raise a range of social and ethical issues that could impede CN progress (Cowls et al., 2021).
Based on the above, this study, taking China as an example, proposes that AI exerts significant positive influence and non-linear characteristics on CN, and that spatial spillover effects exist. The article explores the multifaceted impacts of AI development on CN from both theoretical and empirical perspectives to address existing research gaps. The specific marginal contributions of this paper are as follows: (1) Existing studies mostly focus on the impact of AI on CE, but less systematically analyze the relationship between AI and CN. Before conducting the empirical analysis, this study systematically investigates the evolutionary trends of AI and CN based on quantitative measurements, and innovatively employs ArcGIS visualization and kernel density estimation methods to assess the spatial distribution characteristics and dynamic evolution patterns of CN, respectively. (2) Existing literature has largely analyzed the relationship between AI development and CN within a linear framework (Chotia et al., 2024; Shang, Yang et al., 2024; Shang, Zhou et al., 2024), while this paper further reveals the non-linear evolution of this relationship. Such findings not only expand the theoretical boundaries of related studies but also provide new empirical basis for understanding the complex role of AI development in the CN process. (3) Green fiscal expenditure (GF) has been shown to facilitate low-carbon transitions through multiple channels (Yuan & Pan, 2023), while AI development relies on governmental financial support (C. Zhang & Lu, 2021). This study establishes an integrated framework linking AI development, CN, and GF, thereby enriching the theoretical connotation of the “finance–technology–environment” synergy mechanism. It also provides a scientific basis for local governments to optimize fiscal expenditures, enhance policy precision in climate governance, and maximize carbon reduction efficiency. (4) Limited attention has been paid to the spatial effects of AI development on CN in existing studies. This study adopts SDM to reveal this spatial spillover effect, which contributes greatly to the improvement of policy measures for AI development to promote CN. The findings provide valuable insights for designing cross-regional policies and fostering interregional low-carbon collaborative governance.
The subsequent structure of this study is shown in Figure 3.

Research framework.
Literature Review
In recent years, topics related to CN have been at the forefront of academic interest. Studies evaluating CN performance from multiple perspectives have been increasingly conducted.
The framework for measuring CN performance has been constructed. For instance, a six dimensional framework for assessing the CN capacity of Chinese provinces was proposed by Niu et al. (Niu et al., 2021). Additionally, the first provincial-level CN evaluation indicator system in China was developed, and the corresponding CN index was calculated (P. Yang et al., 2022). More recently, a new evaluation indicator system was introduced to dynamically reflect the balance among energy, economy, and environmental factors during the process of CE reduction (Chun et al., 2023).
Furthermore, factors affecting the achievement of CN goal include trade openness (Ibrahim, 2022), energy consumption (Khan et al., 2023), foreign direct investment (Q. Zhang et al., 2023), renewable energy (Nathaniel et al., 2023), technological innovation (Ibrahim & Mohammed, 2023), resource dependence (Ibrahim et al., 2023), economic growth (Nathaniel et al., 2023), energy efficiency (Jahanger et al., 2023), green energy and environmental regulation policies, etc. Evidence also indicates that green technological advances have contributed to CE reduction over the past three decades, and technological change is expected to play an even larger role going forward (Habiba et al., 2022). Yasmeen et al. concluded that economic development factors drive the increase in CE per capita and energy efficiency was a constraint on reducing CE per capita (Yasmeen et al., 2020). By taking India as an example, found that energy consumption exerts the greatest impact on CE (Ahmed et al., 2022).
AI not only drives economic and social development, but also contributes to environment sustainability. In recent years, AI has been widely applied in fields such as healthcare (He et al., 2019), education (J. Chen et al., 2020; L. Chen et al., 2020), finance (Li et al., 2023) and manufacturing (Mypati et al., 2023), promoting intelligent upgrading and innovative development in various industries. Research on AI primarily examines its effects on employment (C. H. Yang, 2022), environment (Shang, Yang et al., 2024; Shang, Zhou et al., 2024), and economic growth (X. Wang et al., 2025). It was found that AI is a “double-edged sword.” On the one hand, the introduction of AI technologies, such as industrial robots, has created new jobs and strengthened the labor market (Shen & Zhang, 2024). On the other hand, the widespread use of AI may reduce traditional job positions performed by workers, leading to unemployment of low-skilled labors (Frank et al., 2019).
The relationship between AI development and CE has also been investigated. It is argued that AI development can promote energy restructuring and industrial structure upgrading, which can effectively reduce CE (Ding et al., 2023; Dong et al., 2023; X. Xu & Song, 2023; F. Yang & Wang, 2023). Conversely, other scholars take a different view, suggesting that AI technologies may increase CE by consuming more energy. For example, Strubell et al. found that training an AI language processing system would generate 1,400 pounds of CE, and that the generated CE from building and training an AI language system to a full set of experimental simulations would even generate up to 78,000 pounds of CE (Strubell et al., 2019).
Existing literature has examined the spatial spillover effects of AI development on CN. Some studies suggest that AI development positively influences CN in neighboring regions, contributing to CE reduction in adjacent areas. (Ding et al., 2023). However, others argue that AI development inhibits CN in neighboring regions. Tu et al. found that industrial intelligence negatively impacted CE performance in neighboring areas, diminishing their overall CE progress. (Tu et al., 2024).
Previous studies hold significant implications for comprehending the CE reduction effect of AI development, and also provides an important reference for this study. Nevertheless, several research gaps still need to be further discussed: (1) Most studies employ linear research methods to examine the relationship between AI and CN, neglecting potential non-linear effects; (2) AI development requires government financial support, however, existing literature has yet to incorporated green financial expenditure into the empirical analysis of AI development and CN; (3) Few studies have explored the spatial spillover effects of AI on CN, leaving the impact of AI on CN in neighboring regions unclear. Based on that, this study tries to fill in these gaps by adopting 30 provinces in China within the period 2011 to 2021.
Theoretical Analysis and Research Hypotheses
Influencing Mechanisms of AI Development on CN
CN can be achieved by two ways: reducing CE and increasing CS (Lee et al., 2022). Among them, CE reduction c1an be pursued from both the energy demand and supply perspectives, while CS enhancement can be analyzed through ecological CS and artificial CS. By combining with energy-saving and carbon-reducing technologies, AI technologies can play an active role in carbon monitoring, carbon accounting and intelligent analysis assistance, as presented in Figure 4.

Theoretical framework diagram.
Firstly, the control and reduction of energy demand hold immense significance in achieving CN goals. Through electrification and the widespread adoption of smart technologies, energy saving and carbon reduction effects can be achieved in the manufacturing, transportation, construction, agricultural sectors etc. In industry, where high energy consumption and emissions are concentrated, energy conservation and electrification significantly lower energy use and CE, making a considerable contribution to CN (Liu et al., 2022). Transportation, the second largest sector of CE globally, can improve energy efficiency and reduce CE through intelligent transport systems, the Internet of Vehicles, and autonomous driving technologies (Zhao et al., 2022). The building sector, as the largest global consumer of electricity, can reduce energy consumption and CE through smart building technologies that enable real-time monitoring and control of energy use (Mehmood et al., 2019). Agricultural production is one of the domains where energy consumption and CE are concentrated. By promoting advanced technologies and digital management in crop planting and residuals disposal, CE from the agricultural sector can be effectively reduced (SaberiKamarposhti et al., 2024).
Secondly, from the perspective of energy supply, AI holds significant potential for achieving CN by enhancing both clean energy production and transmission. The application of AI technologies in the energy sector can improve energy efficiency and reduce energy waste and CE (Ahmad et al., 2021). Energy transmission is a link that cannot be ignored in the process of clean energy application. In this process, AI technologies can improve the safety and efficiency of energy transmission through intelligent controlling systems. In addition, the integration of AI in renewable energy, particularly in wind and solar power generation, plays a key role in improving electricity generation efficiency and reducing CE (Qin et al., 2024).
Additionally, ecological CS refers to the absorption and sequestration of atmospheric CO2 by natural vegetation and wetland environments through photosynthesis (J. Chen et al., 2020; L. Chen et al., 2020). In this process, AI can be applied to monitor, analyze, and predict changes in forest and marine ecosystems, thereby improving the accuracy and efficiency of ecosystem management. AI can also be used to simulate and optimize ecosystem structures, enhancing the ecological functions of forests, grasslands, wetlands, and related systems, and ultimately increasing their carbon absorption capacity (Lu et al., 2024). From the perspective of artificial CS, commonly used approaches include carbon capture and storage technologies. In this domain, AI can be used to develop more efficient, cost-effective and sustainable carbon capture and storage technologies, and also to simulate and optimize carbon storage scenarios to improve storage efficiency and safety (Priya et al., 2023).
Based on that,
Nonlinear Relationship Between AI Development and CN
A nonlinear relationship could also exist between AI development and CN, that is, the intensity of the role played by AI may vary with CN level. For example, in low energy-consuming and emission industries, fewer CE are generated, and the capacity for carbon absorption and CN is stronger. In such cases, the contribution of AI to CN appears relatively limited. A possible reason could be that as the CN level rises, achieving further reductions in CE or increases in carbon absorption becomes more difficult. Because the remaining CE abatement potential may be more dispersed, difficult to capture, or less cost-effective, making it more challenging for AI technologies to find new ways to reducing CE and enhancing carbon absorption.
By contrast, for high energy-consuming and emission sectors, production activities are largely rely on traditional fossil energy sources, leading to substantial CE from energy generation, consumption, and related processes. This, accompanied with the lack of advanced technologies to manage CE effectively, results in high CE and relatively low CN levels. Under such circumstances, CN level can be quite improved in terms of both reducing CE and increasing CS with the help of AI technologies. In terms of reducing CE, the utilization of AI technologies enables businesses to decrease their reliance on conventional fossil fuels. Intelligent technologies and digital management can monitor, predict and optimize the production process in real-time, thus minimizing energy consumption and CE (Tseng & Lin, 2024). Meanwhile, by analyzing CE data, AI technologies can reveal the main CE sources and predict future CE trends, providing a scientific basis for the government and enterprises to formulate CE reduction strategies (Amiri et al., 2024). Regarding CS enhancement, AI technologies can monitor vegetation coverage, soil moisture content, and CO2 absorption through satellite images, thereby predicting the growth trends and changes of ecological systems (X. Yin et al., 2021). Moreover, the permeability and stability of underground reservoirs can also be predicted with the help of AI technologies to ensure long-term carbon storage security.
Therefore,
Threshold Effect of GF
Green fiscal expenditure (GF), as an important component of fiscal policy, is designed to encourage and support sustainable development, environmentally friendly economy and green technological innovation (Fang et al., 2024). The impact of AI development on CN is likely to vary across different GF levels. Firstly, GF plays a momentous role in fostering AI advancement. It provides financial support to push the development of green AI algorithms, thereby reducing energy consumption and environmental impact (Alzoubi & Mishra, 2024). In addition, GF funding is allocated to research institutions and enterprises to promote the development of environmentally friendly AI technologies, optimize energy efficiency and reduce CE. Secondly, more significant environmental benefits can be achieved through incremental financial inputs that encourage enterprises to adopt AI technologies to increase energy efficiency and decrease CE (Wei et al., 2023). Finally, higher levels of GF will help enhance environmental consciousness and foster broad participation in CN initiatives across all sectors of society (W. Fan et al., 2022). For example, fiscal instruments can be used by the government to motivate enterprises, social organizations, and individuals to engage actively in environmental protection, forming a collaborative atmosphere that advances CN. In this process, AI technology, as an intelligent technical means, can provide effective solutions for achieving CN more efficiently. Therefore, as the GF level rises, AI technologies can significantly contribute to achieving the CN goal.
Hereby,
Spatial Spillover Effect of AI Development on CN
As a vast country, China is witnessed with significant disparities in regional development. Meanwhile, the intensive flow of production factors as well as the mutual influence and synergistic development among regions cannot be ignored. In this context, AI technologies play a key role in optimizing the allocation of production factors, enhancing energy efficiency, reducing CE, and advancing regional CN advancement. For example, vast amounts of regional energy consumption data can be monitored and analyzed in real time through AI-based methods such as deep learning and cloud computing, thereby generating energy-saving suggestions and reducing CE (Fu et al., 2024). Moreover, the transition and escalation of the local industrial structure can be accelerated through the integration of AI technologies (Li et al., 2023), which in turn promotes green manufacturing and sustainable development.
However, several potential disincentives may arise from the impact of local AI development on CN in neighboring regions. Firstly, the widespread application of AI technologies may cause a concentration of resources and technologies flowing toward focused regions, consequently adversely affecting CN in backward regions (C. Zhang & Lu, 2021). For example, developed regions may possess greater resources and capabilities in AI research and application, while their neighboring underdeveloped areas may face difficulties in keeping pace. Such disparities can intensify regional imbalances and pose challenges to interregional cooperation. Secondly, the innovative development of AI technologies in advanced regions may lead to the relocation of low-tech and high-polluting enterprises to neighboring areas, thus increasing environmental pressures and CE in the neighboring regions (Zhou et al., 2024).
In summary,
Empirical Design and Data
Model Construction
Benchmark Regression Model
The panel Tobit model is an econometric approach designed for cases where the dependent variable exhibits truncation. It effectively handles data structures in which observations cluster at a specific threshold while preserving the advantages of panel data in accounting for individual heterogeneity and time dynamics. In this paper, given that CN indicators often display left-truncation due to technical or policy constraints, ordinary regression methods may lead to estimation bias, which can be corrected by the Tobit model through maximum likelihood estimation. Therefore, by referring to literature (X. Xu et al., 2023), the panel Tobit model is employed to test the effect of AI development on CN. The model is constructed as follows:

where CN refers to carbon neutrality; AI refers to artificial intelligence development;
Panel Quantile Model
The panel quantile model, proposed by Koenker, extends traditional quantile regression to a panel data framework, enabling the analysis of heterogeneous effects of explanatory variables across different quantiles of the conditional distribution of the dependent variable (Koenker, 2004). Unlike traditional mean regression, quantile regression captures the effects of explanatory variables throughout the entire conditional distribution of the dependent variable, rather than being limited to mean effects. To better explore the varying impacts of AI development on CN at different levels of CN, the following panel quantile model is constructed (B. Xu & Lin, 2023):

where,
Panel Threshold Model
The panel threshold model, proposed by Hansen, is used to analyze potential non-linear relationships between explanatory and dependent variables. Specifically, when the value of the threshold variable exceeds a certain level, the effect of the explanatory variable on the dependent variable changes structurally (Hansen, 1999). Considering the possible nonlinear impact of AI on CN, this study adopts the panel threshold model to examine the threshold effect. This model effectively reveals the non-linear relationship between policy instruments and technical effects by identifying the threshold value of GF and its structural impact on the abatement effect of AI. The model is specified as follows (Song, 2021):

where,
Spatial Durbin Model
The spatial Durbin model (SDM) is an econometric model that captures both the spatial dependence of the dependent variables and the spatial spillover effects of the explanatory variables. It achieves this by incorporating a spatial weight matrix into the traditional regression model to identify spatial interactions resulting from geographic proximity or economic linkages (Anselin, 1988). Compared to the spatial lag model (SLM) and the spatial error model (SEM), the SDM offers the advantage of simultaneously capturing both the direct effect of AI development on CN within a region and its indirect effect on CN in neighboring regions, thus providing a more comprehensive analysis (Y. Wang et al., 2024). Therefore, the SDM is constructed to test the spatial spillover effect of AI development on CN as follows:

where ρ is the spatial autoregressive coefficient, W is the space weight,
Description of Variables
Explanatory Variable
CN is defined as the dynamic equilibrium between CE and CS, which depends on CE and carbon uptake. To measure the scale and efficiency of regional CE, three indicators are selected: total CE, CE intensity, and per capita CE. Meanwhile, five indicators, namely total water resources, forest stock volume, forest coverage rate, green space ratio of urban built-up areas, and afforestation area, are used to evaluate the CS function of the ecosystem and the urban greening situation, thereby reflecting the carbon uptake capacity (Xu et al., 2022). The specific indicator description is shown in Table 1. Then, the entropy value method is used to measure CN performance. This method is able to effectively avoid the influence of subjective judgment on weight determination (Huang & Lin, 2024). The specific calculation steps of this method are shown in S1 in Supplemental Material.
CN Comprehensive Evaluation Index System.

Core Explanatory Variable
In recent years, empirical studies have used the patents on industrial robots and AI to quantify AI development performance (Acemoglu & Restrepo, 2017; Fujii & Managi, 2018). Despite that, they are simple indicators that cannot adequately embody the overall AI development performance. Therefore, by referring to literature (Borland & Coelli, 2017), three indicators are selected to measure the development environment, such as mobile phone penetration rate, reflecting the infrastructural foundation for AI; another three indicators are selected to evaluate talent resources, including number of full-time R&D personnels, which delivers professionals to the AI field; the production of industrial robots serves as the indicator for industrial application, which promotes the innovation and application of AI technology; two indicators are selected to measure economic output, including AI patent applications and software business revenue, which reflects both financial and technological support for AI development. The specific indicator description is shown in Table 2. Based on this indicator system, the comprehensive AI development index is measured by entropy value method, with the results reported in S2 of the Supplemental Material.
AI Comprehensive Evaluation Index System.
Threshold Variable
GF may be a potential threshold variable in the process of AI development increasing CN performance (Yuan & Pan, 2023). Therefore, this study selects GF as the threshold variable, measuring it by the proportion of environmental protection expenditures in total local fiscal expenditures.
Controlled Variables
The improvement in CN, with the exception of the impact of AI development, is also associated with some other factors. Specifically, it may include: (1) environmental regulation (Er). Strict environmental regulations not only affect the emissions of pollutants and CO2, but also enhances public environmental awareness and even promotes the achievement of CN goal. ER is measured by the share of local fiscal expenditure on environmental protection in GDP (K. Yin et al., 2022). (2) Infrastructure construction (Infra). Reasonable infrastructure construction is conducive to protect the environment and promotes sustainable economic development, affecting the improvement of CN level. It is calculated as the ratio of the geometric mean of railway and road mileage to the regional land area. (Sun et al., 2019). (3) Fiscal decentralization (Fis). A high degree of fiscal decentralization can increase the flexibility and dominance of local governments in CN, which will have a nonnegligible impact on CN development. It is measured by the ratio of general government fiscal expenditure to general government fiscal revenue (Cheng et al., 2020). (4) Economic development level (Ec). Regional economic development is generally positively correlated with CE; as the economy developed, the more CE is generated in production, consumption and transportation. It is measured by per capita GDP (Du et al., 2012). (5) Population density (Pi). Rising population density can intensify environmental pressures, potentially hindering CN progress. This variable is measured by the average population per square kilometer with a region (Q. Wang & Li, 2021).
Data Sources
For the sake of consistency in statistical caliber and data availability, the study selected 30 Chinese provincial-level administrations as the research sample. Most data on AI development were obtained from the China National Bureau of Statistics (CNBS) and the China Statistical Yearbooks (CSY), except for industrial robot output and AI patent applications. Data on industrial robot production were obtained from the Global Robotics Report, which provides only national-level data. To estimate provincial-level data, the proportion of urban unit employment in the information transmission, software, and information technology service industries of each province relative to the national total was used as a weighting factor. These weights were then applied to national robot production data to derive provincial estimates (Acemoglu & Restrepo, 2020; Borland & Coelli, 2017). The number of AI patent applications is derived by counting AI-related patent applications of the 30 provinces in Patenthub’s Global Patent Database using 7 categories of technology as keywords, namely Natural Language Processing, Intelligent Driving, Cloud Computing, Computer Vision, Deep Learning, Speech Recognition and Intelligent Robotics. Data for all CN indicators and control variables come from the CSY, CNBS, and the China Carbon Accounting Databases (CEADs). Missing data were completed using interpolation, variables were logarithmically transformed for analysis, and price-related indicators were adjusted using 2011 as the base year. The distributions of the various variables are shown in Figure 5.

Scatter diagram of variables and boxplot of distribution.
Descriptive Statistics
The descriptive statistics for the main variables are presented in Table 3. The results of skewness, kurtosis, and the Jarque-Bera test, presented in S3 of the Supplemental Material, indicate that most variables significantly deviate from a normal distribution. The correlation coefficient matrices, shown in S4 of the Supplemental Material, reveal that the absolute values of most correlation coefficients are below .75, suggesting that there is no significant multicollinearity.
Descriptive Statistics of Variables.

Analysis of AI and CN Variation Characteristics
Temporal Changing Trends of AI Development and CN Level
By observing the changes in AI development and CN performance, their development trends can be roughly understood, as presented in Figure 6. Apparently, the performance of AI development and CN in 30 Chinese provinces generally exhibited an upward trend. Generally, AI development was witnessed with a strong development momentum during the observed years, while CN was observed with an unstable growing trend. Specifically, CN has maintained a steady growth from 2011 to 2016, followed by a temporary decline between 2017 and 2018. It then gradually rebounded in 2019 and 2020, showing a slow upward trend. In 2021, it has once again decreased.
Trends in China’s AI and CN development.
Spatial Evolution Trends of CN Level
For further in-depth analyses of the spatial evolution of CN performance in China, spatial distribution maps of the average CN performance for 2011, 2015, 2019, and the entire period from 2011 to 2021 are presented in Figure 7. The measuring scores of CN are categorized into five levels, with higher levels representing higher CN performance.

Spatial distribution of CN.
In 2011, as depicted in Figure 7a, Beijing, Tianjin, Jiangsu, Shanghai, and Ningxia were observed with very low CN scores within 0.15, which fell into the first rank, indicating a relatively low CN performance. The CN scores in Liaoning, Hebei, Shandong, Hainan, Shanxi, Henan, Anhui, Hubei, Xinjiang, Qinghai, Gansu, Chongqing and Guizhou ranged from 0.15 to 0.3, corresponding to the second level. Fujian, Guangdong, Jilin, Hunan, Jiangxi, Shaanxi and Guangxi scored between 0.3 and 0.45, belonging to the third level and reflecting a low-to-medium CN performance. The CN score in Heilongjiang was between 0.45 and 0.6, which was at the fourth level, indicating its high-middle CN level. The CN scores in Sichuan and Yunnan were in the range of 0.6 to 0.8, which belonged to the fifth level, signifying a comparatively high CN level. Then in 2015, as seen in Figure 7b, a growth can be found in CN scores in Beijing, Guangdong, Zhejiang, Fujian, Jiangsu, Hubei, Hunan, Guizhou, Jiangxi and Guangxi, while a decrease was witnessed in Qinghai. Again, in 2019 as presented in Figure 7c, Qinghai and Heilongjiang continued to improve their CN scores, while Jiangsu exhibited a slight decrease. It can be noticed from Figure 7d that, the distribution pattern of the average CN scores of the 30 provinces from 2011 to 2021 is similar to that of other years, and the eastern region has won lower CN scores, and the mid-western regions have achieved medium CN scores.
Characteristics of the Spatial Dynamic Evolution of CN
Kernel density estimation is a nonparametric method used to analyze spatially uneven distributions. By estimating the probability density of a random variable and transforming it into a continuous density profile, the dynamics of the distribution of the variable can be characterized (Zambom & Dias, 2013). In the kernel density plot, a rightward shift in the curve position signifies an elevation in attribute values, while peak height corresponds to modal concentration density. The emergence of multiple distinct peaks indicates a multimodal distribution, suggesting the presence of heterogeneous subgroups within the dataset. Notably, when the curve exhibits an elongated right tail and a wider distribution, this configuration demonstrates increased dispersion across the measured values, reflecting growing variability within the population (Węglarczyk, 2018).
To more effectively observe the dynamic evolution of China’s CN, the kernel density curves were plotted using Stata software. As depicted in Figure 8, it vividly illustrates the transformation of the kernel density of the overall CN levels across 30 Chinese provinces from 2011 to 2021. The curves gradually shifted rightward over time, indicating that CN levels in most provinces exhibited an upward evolutionary trend. This finding is in line with the overall trajectory of the CN development levels across the country. Furthermore, a significant change observed is the increase in the number of wave peaks within the kernel density curves, accompanied by a decrease in the height of the main peak. This phenomenon suggests an increasing polarization of CN development levels and a widening gap among provinces. Moreover, the broader spread of the curves implies a growing absolute disparity in CN performance across regions. In conclusion, the kernel density curves reveal that, although the CN levels in the 30 Chinese provinces have shown an upward trend during 2011 to 2021, the polarization of these levels is intensifying, and the spatial discrepancies are also escalating (Figure 8).

Evolution characteristics of CN kernel density.
Empirical Results and Discussions
Benchmark Regression
The benchmark regression analyzing AI’s effect on CN is shown in Table 4. Column (1) presents the direct effect of AI development on CN without controlled variables. It reports a coefficient of 0.024, significant at the 1% level, indicating that a 1% increase in AI development leads to a 0.024% increase in CN. Columns (2)–(6) display the results with the gradual inclusion of controlled variables. All coefficients remain positive, confirming that a 1% increase in AI development consistently enhances CN across the models. Overall, the findings demonstrate that AI development exerts a significant and stable positive effect on CN. Thus,
Benchmark Regression Results.

, **, and * are significant at 1%, 5%, and 10% levels respectively, the coefficients in parentheses correspond to robust standard errors, and “ln” means taking the logarithm of variables, the same below.
Robustness Test
To verify the plausibility that AI positively affects CN and test its robustness, the following procedures were conducted. (1) Using the lagged term of AI as the explanatory variable. As the impact of AI development on CN could be persistent, and the present AI development may have a direct impact on future CN. Thus, the one period lagged term (L-lnAI) of the original core explanatory variable has been used for robustness test. (2) Adding controlled variables. As urbanization may affect the CN process, the urbanization rate was added as a control variable to enhance model robustness. (3) Winsorizing the data sample. To eliminating the possible influence of extreme sample values, all variables are subjected to the upper and lower 1% winsorizing treatment. (4) Excluding municipalities from the sample. There may be significant differences between the four municipalities and other provinces in AI development, so the municipalities are excluded from the sample regions. (5) Mixed regression. The regression was rerun by treating panel data as cross-sectional to test result stability. (6) Introduction of dummy variables. The breakout of the COVID-19 pandemic from 2020 to 2022 may have influenced AI development and CN. Consequently, a dummy variable was introduced, taking the value of 1 for 2020 and subsequent years and 0 otherwise, to distinguish between the pre-pandemic and post-pandemic periods and assess potential heterogeneity in AI’s effects on CN.
Based on the above procedures, the regressions were re-estimated, and the results are presented in Table 5. As shown in columns (1)–(5), all regression coefficients for the explanatory variables remain significantly positive at the 1% level, providing further supported
Robustness Test Results.

Note. *, **, and *** represent the significance levels of 10%, 5%, and 1%, respectively, the coefficients in ( ) correspond to robust standard errors, and “ln” means taking the logarithm of variables.
Endogeneity Test
To address potential endogeneity between variables, an instrumental variables approach was employed. The lagged term of the explanatory variable (L-lnAI) was used as the instrument in a two-stage least squares regression. The results, shown in columns (1) and (2) of Table 6, indicate that the regression coefficient of lnAI remains positive and significant at the 1% level. Secondly, Infra from 2000 to 2010 was adopted as an instrumental variable for AI. Infra during 2000-2010 affects the later Infra related to AI, satisfying the correlation between instrumental variables and core explanatory variables. Moreover, Infra from 2000-2010 is uncorrelated with CN during 2011-2021, ensuring the exogeneity of the instrumental variable. Therefore, selecting Infra from a decade prior as an instrumental variable is more appropriate. The regression results in columns (3) and (4) indicate that the coefficients of lnAI are significantly positive. In summary, the positive contribution of AI to CN remains significant after considering endogeneity.
Endogeneity Test Results.

Note. *, **, and *** represent the significance levels of 10%, 5%, and 1%, respectively, the coefficients in ( ) correspond to robust standard errors, and “ln” means taking the logarithm of variables.
Panel Quartile
To examine whether heterogeneity exists in the effect of AI on CN across different CN levels, the panel quartile analysis has been conducted, and five representative quartiles of 0.10, 0.25, 0.50, 0.75 and 0.90 are selected for regression. The specific estimation results are shown in Table 7, where Columns (1)–(4) show that the regression coefficients of lnAI are significantly positive at the 0.10, 0.25, 0.50 and 0.75 quantile points of CN, indicating that AI is conducive to the promotion of CN level in the above cases. Despite that, the regression coefficient values gradually decrease. At the 0.90 quantile in Column (5), the coefficient of lnAI becomes the smallest and loses statistical significance, which means that AI development wound no longer facilitate CN in this case. In summary, as the level of CN increases, AI development exhibits a positive but decreasingly marginal efficient non-linear effect on the promotion of CN, which means the promotion of AI development on CN would be more efficient at lower CN levels. Thus,
Panel Quantile Regression.

Note. *, **, and *** represent the significance levels of 10%, 5%, and 1%, respectively, the coefficients in ( ) correspond to robust standard errors, and “ln” means taking the logarithm of variables.
Threshold Effect
As great divergence could be existed in GF levels among these 30 provinces, a panel threshold model was established to test the possible non-linear relationship between AI development and CN from the perspective of GF. The results, presented in Table 8, show that the single GF threshold passes the 1% significance level test, whereas the double and triple threshold models fail to reach significance. Therefore, the single-threshold model was used to analyze the impact of AI development on CN under different GF levels, and the results have been presented in Table 9.
Threshold Condition Test.

Note. *** represents the significance level of 1%.
Threshold Effect Test Results.

Note. *, **, and *** represent the significance levels of 10%, 5%, and 1%, respectively, the coefficients in ( ) correspond to robust standard errors, and “ln” means taking the logarithm of variables.
When the GF level is below the threshold value of 0.543, the regression coefficient in the impact of AI on CN is 0.026 with a significance level of 5%. By contrast, when the GF level exceeds the threshold value, a greater regression coefficient of 0.035 can be observed, and it is significant at the 1% confidence level. This indicates that the positive impact of AI development on CN will be stronger as the GF level increases. This may be attributed to the fact that higher GF levels foster a more supportive environment for the advancement of green AI technologies, which can take an active role in improving CN performance. Thus,
Spatial Spillover Effect
Global Spatial Correlation
To examine the spatial agglomeration characteristics of CN development across China, a spatial correlation test was performed on the CN indices of 30 provinces to determine the presence of spatial dependence. The Moran’s index of CN for these provinces from 2011 to 2021 was calculated using Stata software, as shown in Table 10. Under the adjacency weight matrix, all Moran’s I indices of CN were found to be significantly positive, indicating a strong spatial positive correlation of CN among the 30 provinces. That is, a clustering effect exists among regions with similar CN levels.
CN Moran Index.

Note. *** represents the significance level of 1%.
Local Spatial Correlation
To intuitively reflect the spatial agglomeration and regional heterogeneity of CN in Chinese provinces, the years 2011, 2015, 2019, and 2021 were selected as representative time points for analysis. Moran’s I scatterplots were plotted using Stata software, where the horizontal axis (z) represents the normalized CN value and the vertical coordinate (Wz) represents the spatially lagged value of the CN processed by row normalization. These scatterplots not only reflect the spatial correlation of CN levels between each province and its neighbors, but also reveal the clustering patterns and evolutionary dynamics of CN across the 30 provinces. Based on the scatter plot of Moran’s I, high-high (HH) and low-low (LL) indicate that the CN levels in these provinces has a positive spatial spillover effect, while high-low (HL) and low-high (LH) indicate a negative spatial correlation. As shown in Figure 9, there are three types of CN agglomeration in China, namely HH, LL and HL, implying a general spatial clustering of CN development in China. Among them, eight provinces, namely Yunnan, Heilongjiang, Hunan, Jiangxi, Fujian, Guangdong, Guangxi and Jilin are locatedted in the first quadrant (HH). Meanwhile, the spatial distribution of LL and HL clusters has remained largely unchanged, indicating that the spatial agglomeration of CN level in China are relatively stable.
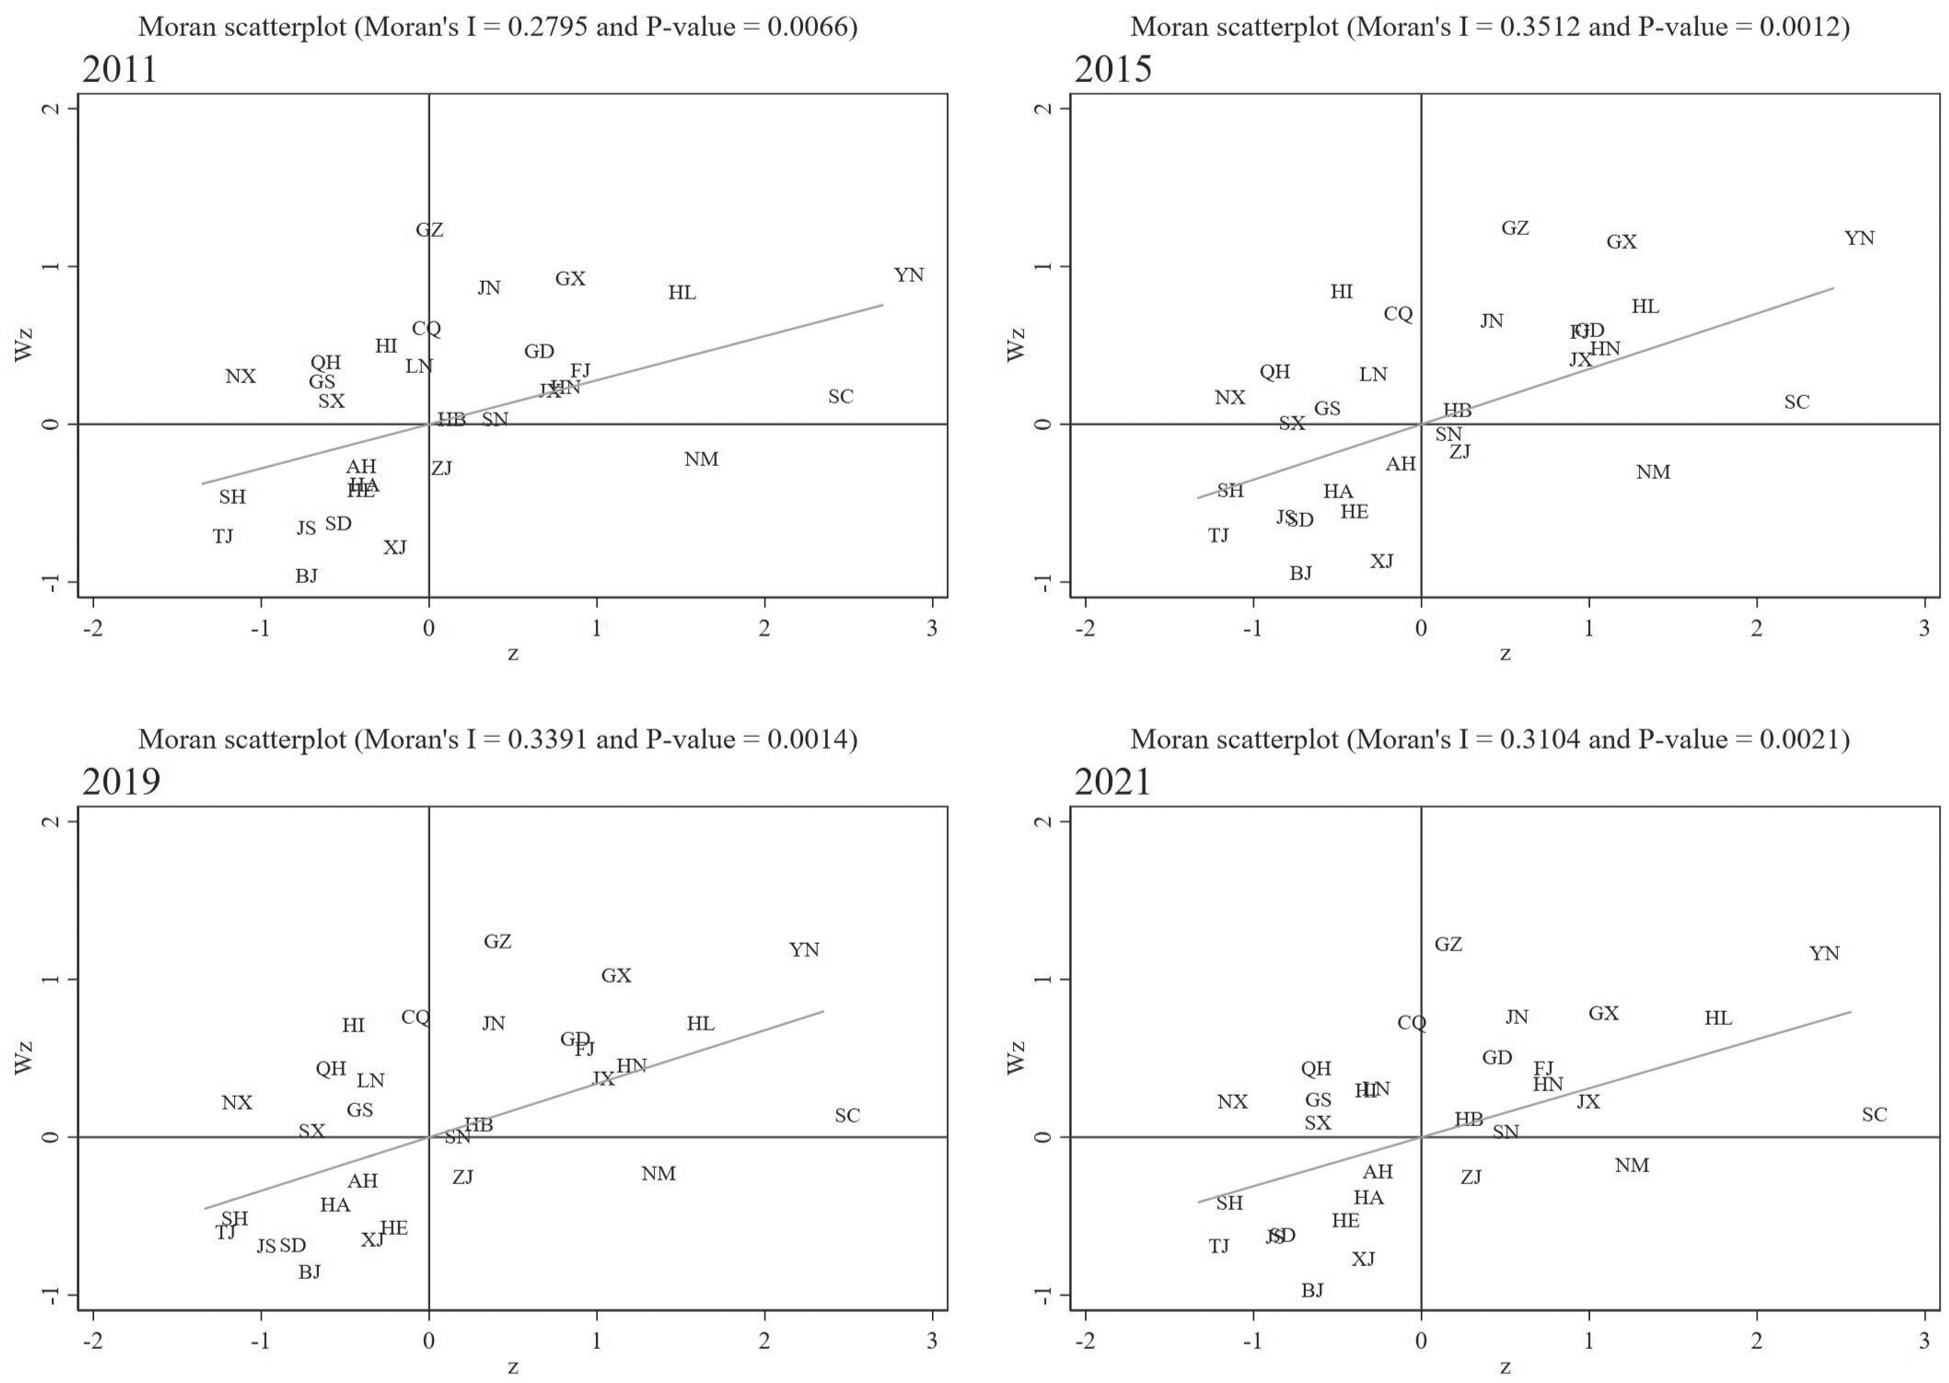
CN Moran scatter plot.
SDM Regression
To determine the appropriate model, the LM, LR, Wald and Hausman tests are conducted, and the results are shown in S4 of the Supplemental Material. Based on previous analysis, an obvious spatial clustering effect of CN can be noticed. To further explore this, a SDM is applied to examine how AI development impacts CN. The regression results, shown in Table 11, demonstrate that AI positively influences CN at a 5% significance level. However, the W×lnAI term reveals a significant negative impact on CN in neighboring provinces, suggesting that while AI development enhances local CN, it may hinder CN in adjacent regions. When the total effect is decomposed into direct and indirect effects, the results reveal a potential “siphoning effect,” whereby regions with rapid AI development attract resources and advantages from adjacent areas, thereby constraining their CN progress. So,
SDM Regression Results.

Note. *, **, and *** represent the significance levels of 10%, 5%, and 1%, respectively, the coefficients in ( ) correspond to robust standard errors, and “ln” means taking the logarithm of variables.
In addition, three dynamic SDM models were employed to further examine this effect, and the results are presented in S5 of the Supplemental Material. It reveals that both the time lag and spatial lag terms of the explanatory variables are statistically significant, thereby confirming the robustness and validity of the results obtained from the dynamic SDM estimation.
Discussions
Amid deepening global climate crises, CN has transitioned from scientific warning to political imperative. Fortunately, the rapid advancement of AI offers a transformative approach to CN challenges. Although existing studies have established theoretical linkages between AI and CN, some critical gaps remain. This study innovatively quantifies the performance of AI development and CN through entropy-weighted indices, empirically validates the relationship between AI development and CN, and explores the mediating effect of GF in this relationship. Furthermore, the spatial diffusion patterns of AI development on CN is explored. These findings advance both AI-driven decarbonization theory and climate governance praxis.
This study examines the differential impacts of AI development on CN across varying CN development stages. Empirical analysis reveals a diminishing marginal effect of AI development on CN advancement, with statistical significance disappearing at the 0.90 quantile as CN levels rise. This finding fills an important gap in the existing literature. Although previous studies have confirmed the general driving effect of AI development on CN (Shang, Yang et al., 2024; Shang, Zhou et al., 2024), regional heterogeneity in CN development has been largely overlooked, thereby limiting the policy applicability of those findings. Based on that, some implications can be derived: (1) In regions with mature CN systems, policy priorities should be redirected from AI adoption toward alternative emission reduction strategies to avoid resource misallocation; (2) For early-stage CN adopters, the technological potential of AI can be leveraged through coordinated policy incentives and green investment mechanisms; (3) As CN thresholds evolve, dynamic policy calibration should be implemented to optimize resource allocation and maximize environmental returns on AI investments. This phased approach enables differentiated yet adaptive climate governance aligned with regional decarbonization trajectories.
As an important tool for regulating the relationship between environmental governance and technological innovation, GF has usually been ignored in studies. GF has been proved to be conducive to reducing pollutant emissions and protecting ecological environment (H. Fan & Liang, 2023), while the development of AI technology development fundamentally depends on government financial support. Our study found that GF did play a reinforcing role in the process of AI development affecting CN. This effect may stem from the ability of regions with high GF levels to provide high-quality AI algorithms and real-time CE data streams through targeted investment in digital infrastructure such as smart grids and carbon monitoring platforms, which significantly improves the prediction accuracy and optimization efficiency. GF drives the decarbonization effect of AI development through dual market incentives. By reducing the marginal cost of deploying AI abatement technologies and stimulating technology diffusion through market-based policy tools such as carbon tax rebates and clean technology subsidies, GF strengthens the linkage between digital innovation and environmental performance. For instance, Germany’s Industry 4.0 tax incentives have significantly increased the return on investment in AI abatement. In addition, GF also promoted spatial synergy between AI computing centers and renewable energy bases through cross-regional resource allocation optimization, further enhancing systemic efficiency and sustainability.
A significant inhibitory effect on the CN process in the surrounding areas has been revealed in this study. Some studies found that AI adoption within a region inhibits the improvement in CE efficiency in adjacent areas (Zhou et al., 2024). In contrast, other studies argue that the development of industrial intelligence promotes reductions in CE intensity both locally and regionally (Meng et al., 2022). This divergence originates from multiple determinants: regional development gaps, technological diffusion barriers, energy allocation imbalances, policy coordination deficits, geographic scope selection, temporal coverage, dataset representativeness, and modeling specification differences. This study reveals AI’s dual mechanisms in constraining peripheral CN. Advanced regions objectively retard the low-carbon transition process in technologically peripheral regions through patent barriers to carbon monitoring algorithms and data monopolies. For example, about 78% of global industrial CE data is held by multinational corporations, which significantly increases difficulty in CE monitoring and governance for other enterprises. In addition, AI clusters are found to weaken the green innovation capacity of neighboring regions by siphoning off digital talent and green financial resources from them. Collectively, these factors contribute to the spatial non-equilibrium of AI technology diffusion, thereby hindering CN progress in surrounding areas.
Conclusions and Policy Implications
Conclusions
The CN strategy is not only a core component of China’s new development pattern but also a crucial pathway to achieving high-quality development. This study investigates the mechanisms through which AI technology drives CN, using panel data from 30 Chinese provinces from 2011 to 2021. Employing the Tobit model, quantile regression, threshold effect model, and SDM, it systematically addresses the research questions outlined in the introduction and yields the following findings:
(1) Benchmark regression results indicate that a 1% increase in AI development leads to a 0.04% rise in the CN index (β = .040, p < .01). This result remains robust after robustness test and endogeneity analysis, confirming the universality of AI advancing CN.
(2) Quantile regression analysis shows that the coefficients of AI are .045, .041, .036, and .030 at the .10, .25, .50, and .75 quantiles of CN, respectively, all statistically significant, while the coefficient at the .90 quantile (.026) is insignificant. This suggests that as the CN level rises, the facilitating effect of AI development gradually weakens and eventually becomes insignificant once CN reaches a higher stage.
(3) GF endeavors to back ecological environmental protection through financial resources, exerting a non-negligible impact on the optimization of the “technology – environment” relationship. The effect of AI on CN varies across GF levels. When GF exceeds the threshold of 0.543, the coefficient of lnAI on CN increases from 0.026 to 0.035, and AI’s marginal utility improves by 34.6%. This indicates that higher GF levels strengthen AI’s positive impact on CN.
(4) SDM model estimation reveals that AI development exerts a positive direct effect on local CN but a negative spatial spillover on neighboring regions, which calls for a synergistic governance of cross-regional carbon quota trading and technology sharing platform.
The above findings systematically address the research questions posed in the introduction. Nevertheless, this study has several limitations. (1) The provincial data used in this study may contain statistical errors related to CE and carbon uptake, especially for indirect emissions and unreported sources. The current CN measurement framework relies primarily on publicly released provincial-level data, which is to some extent constrained by limitations in data collection and statistical methodologies, thereby failing to comprehensively reflect the actual circumstances of all CE sources. Future research should consider incorporating data correction and supplementation techniques to mitigate biases arising from these limitations. (2) This study is based on panel data from 30 Chinese provinces. Future research could integrate micro-level firm data to explore the mechanisms of AI technology diffusion and its heterogeneous impacts on CN. In addition, due to data availability constraints, the most recent data from 2022 to 2024 are not included. Subsequent studies could extend the dataset to further verify the dynamic effects of AI development on CN. (3) Although this paper adheres to the principles of availability and scientific rigor in selecting indicators, some indicators may still be omitted or fail to fully reflect the development of CN and AI. Future research could further enrich the indicator system to more accurately characterize CN and AI. (4) Focusing on empirical analysis within the Chinese context, this study offers valuable insights for developing nations; however, the universality of its conclusions requires further verification. Future research should employ cross-national comparative data to test the external validity of these findings. (5) This study primarily examines the independent effect of AI development on CN without accounting for potential interactions with other factors. Future research could explore the interplay between AI and variables such as environmental regulations to provide a more comprehensive understanding of their combined impacts.
Policy Implications
Based on the findings, the following policy recommendations are put forward:
Firstly, the development and application of AI in CN should be enhanced. Significant opportunities and untapped potential remain across various sectors within CN, offering significant scope for growth and innovation. As AI has not yet been fully integrated into these sectors, strengthening its application is imperative. For example, given the pervasive nature of CE in human activities and its substantial contribution to global climate change, the adoption of advanced technologies has become a crucial strategy for mitigating negative environmental impacts. Among these technologies, AI, as a cutting-edge and adaptable new technology, has the potential to significantly reduce CE from economic activities. Therefore, deepening AI application in economic operations is essential to combating climate change. In addition, the utilization of AI can not only broaden the channels for clean energy and establish high-intelligence energy collection factories, but also promote industrial innovation and develop advanced energy technologies. Concurrently, targeted support should be provided to regions with relatively low levels of CN. For these less-developed areas, priority should be directed toward fostering the growth of AI within their borders. This necessitates the implementation of policy incentives and financial investments aimed at enhancing the utilization and application of AI technologies in these regions. By doing so, we can expedite the achievement of the overarching goal of advancing CN across the board.
Secondly, the positive role of GF should be fully utilized. The study results indicate that when GF exceeds the threshold of 0.543, AI’s contribution to CN is significantly enhanced. This indicates that adequate environmental financial input is an important guarantee for unleashing the emission reduction effect of AI. Based on this conclusion, the government is advised to optimize the fiscal expenditure structure to ensure that green financial inputs reach the required level for realizing AI’s low-carbon capacity. Additionally, financial support should be more precisely targeted, with differentiated incentives tailored to specific industries and regions to enhance AI’s effectiveness in driving low-carbon transformation. Considering technological advancements and market dynamics, fiscal policy should incorporate a dynamic adjustment mechanism to regularly evaluate AI’s emission reduction trends in response to fiscal expenditure changes. Such an approach would help ensure the optimal allocation of financial resources and maximizing their marginal effectiveness.
Thirdly, attention should be directed toward mitigating the negative impact of AI development on CN in neighboring regions, while also working to increase CN levels in those areas. Localities should promote technology transfer and knowledge sharing in the field of AI. Additionally, talent cultivation and attraction from surrounding regions should be encouraged to strengthen participation in AI research, development, and application, thereby advancing AI progress and achieving CN goals. Meanwhile, the valuable experiences of more advanced regions can be utilized to establish a regional cooperative mechanism. This would promote the optimal allocation of resources and collaborative development between regions, thereby supporting improvements in CN levels across neighboring areas.
Supplemental Material
sj-docx-1-sgo-10.1177_21582440251408407 – Supplemental material for The Multiple Impacts of Artificial Intelligence on Carbon Neutrality: Evidence From China
Supplemental material, sj-docx-1-sgo-10.1177_21582440251408407 for The Multiple Impacts of Artificial Intelligence on Carbon Neutrality: Evidence From China by Haiyang Qiu, Jiaqian Kang, Xin Li, Long Zhang and Boyan Lei in SAGE Open
Footnotes
Funding
The authors disclosed receipt of the following financial support for the research, authorship, and/or publication of this article: This work was funded by the National Social Science Foundation of China (22BZZ039), the National Natural Science Foundation of China (72304234), the Henan Province Soft Science Research Program Project (232400410054) and the Postgraduate Education Reform and Quality Improvement Project of Henan Province (YJS2022JD30).
Declaration of Conflicting Interests
The authors declared no potential conflicts of interest with respect to the research, authorship, and/or publication of this article.
Data Availability Statement
Data will be available on request.
Supplemental Material
Supplemental material for this article is available online.
References
Supplementary Material
Please find the following supplemental material available below.
For Open Access articles published under a Creative Commons License, all supplemental material carries the same license as the article it is associated with.
For non-Open Access articles published, all supplemental material carries a non-exclusive license, and permission requests for re-use of supplemental material or any part of supplemental material shall be sent directly to the copyright owner as specified in the copyright notice associated with the article.