
Abstract
The fashion industry is undergoing a profound transformation towards sustainability, with eco-friendly paper handbags exemplifying the balance between environmental responsibility and commercial viability. Despite the growing attention to sustainable design, a persistent cognitive gap remains between consumers and designers, particularly regarding aesthetic and functional preferences. To address this issue, this study develops an integrated analytical framework combining Importance–Performance Analysis (IPA), Conjoint Analysis (CA), and Fuzzy Comprehensive Evaluation (FCE), using survey data from 444 consumers and 417 designers in China to systematically examine and quantify preference misalignment. The results reveal moderate yet structured divergences across key product attributes: consumers place greater emphasis on style and price positioning (with a preference for the high-end tier), whereas designers prioritise cost efficiency and functionality, while both groups show consistent recognition of environmental and practical value. These findings suggest that preference divergence in sustainable fashion arises not from conflicting values but from differentiated attribute priorities. The study advances theoretical understanding by elucidating the mechanisms of consumer–designer cognitive divergence in sustainable product design and offers a transferable IPA–CA–FCE framework that supports precision–oriented, market-responsive, and environmentally aligned design strategies.
Plain Language Summary
Sustainable fashion is growing fast, and paper handbags are one example that aims to be both eco-friendly and commercially viable. Yet consumers and designers do not always want the same things. In this study, we surveyed 444 consumers and 417 designers in China and used a combined toolkit (IPA, CA, and FCE) to see where their priorities match or differ. We found moderate but patterned differences. Consumers care most about style and prefer higher-end price positioning, while designers put more weight on cost efficiency and functionality. Importantly, both groups agree that environmental benefits and practical performance matter. In other words, the gap is not about clashing values—it comes from different priorities across product attributes. By showing exactly where priorities diverge and align, our framework helps teams make design decisions that are market-responsive, environmentally responsible and feasible to produce. The approach can be used beyond paper handbags to guide other sustainable fashion products. One-sentence takeaway: Aligning design choices with the style and price expectations of consumers (without losing sight of cost, function, and sustainability) can narrow the gap between consumers and designers in sustainable fashion.
Keywords
Introduction
In the context of mounting global concern over environmental issues, sustainable development has become a core issue across all industries (Muñoz-Torres et al., 2021). The United Nations Sustainable Development Goals (SDGs) have been shown to provide a development framework for all industries, profoundly influencing corporate perceptions of sustainable development (Landrum & Ohsowski, 2018; Wynn & Jones, 2022). In light of these developments, the fashion industry is undergoing a gradual transition towards sustainability and a circular economy (Todeschini et al., 2017). The utilisation of eco-friendly fashion paper handbags, fabricated from fibre paper or high-density polyethylene (HDPE), exemplifies a distinctive sustainable appeal and application potential (Zhang et al., 2020). This study focuses on the specific material context of paper handbags to explore design optimisation and consumer–designer preference alignment; therefore, it does not involve cross-material comparisons with other packaging types such as plastics.
Despite companies’ efforts in sustainable fashion, consumers generally perceive these actions as marketing–driven rather than a commitment to environmental responsibility, thereby undermining corporate credibility (Neumann et al., 2021). This erosion of trust indicates an implementation gap whereby high-level sustainability claims are not consistently translated into verifiable product-level attributes and clear communication cues. In particular, weak alignment between environmental responsibility and consumers’ aesthetic and functional expectations reduces perceived authenticity and dampens behavioural intentions (Barbaritano & Savelli, 2021). Moreover, while consumer awareness of sustainable fashion is widespread, it lacks depth, and inconsistencies between companies’ SDG promotion and market performance exacerbate trust issues between brands and consumers (Blazquez et al., 2020). This dearth of confidence is characterised by a substantial discrepancy between consumers’ perceptions of the sustainable value of fashion products and their expectations of brands. Achieving a balance between traditional brand values and sustainable development concepts has become a key issue driving innovation in the fashion industry (Faraoni, 2021). It is evident that companies lack systematic research on consumer needs (such as environmental protection, aesthetics, and functionality).
To address these challenges of trust and misalignment, companies must achieve a balance between consumer education (i.e., communicating environmental benefits) and economic feasibility (i.e., cost-effective production; Hofmann et al., 2022). In order to achieve this objective, designers must address the challenge of balancing environmental friendliness, aesthetics and functionality in the process of material acquisition, skill enhancement, and cultural integration (Agusalim, 2021). Concurrently, consumer demand for sustainable fashion is centred on product environmental transparency, reasonable pricing, and overall design value (Radhakrishnan, 2020). However, research indicates that sustainable design faces significant barriers in its implementation, which include both internal factors, such as a lack of design knowledge and methods, and external factors, such as insufficient consumer demand and a lack of incentives (Hur & Cassidy, 2019). In particular, the trade-off between aesthetics, cost, and fashion trends has become a key challenge in design practice. Visual content has been demonstrated to play a crucial role in attracting consumers and promoting brands (Bai et al., 2025), while emotional and cognitive factors have been shown to significantly influence the overall consumer experience (He et al., 2025). Despite the emphasis placed on the balance between aesthetics, functionality and sustainability in design in previous studies, there remains a paucity of systematic design practice and analysis specifically for eco-friendly fashion paper handbags. Designers have been shown to play a pivotal role in achieving a balance between corporate goals and consumer needs.
In the field of product design, the Importance–Performance Analysis (IPA) method has been employed to categorise consumers’ preferences for product attributes (i.e., design elements) and optimise product design accordingly (H. Li et al., 2024; Sun et al., 2023). The Conjoint Analysis (CA) method has been demonstrated to quantify consumers’ preferences for different design elements and determine the optimal product design combination (Wang et al., 2022). Furthermore, the Fuzzy Comprehensive Evaluation (FCE) method can be utilised to evaluate the overall quality of product design, thereby ensuring that the final solution meets market demands (Y. Zhao et al., 2024).
To address adoption barriers arising from the gap between consumers’ trust in and perceptions of fashion brands’ sustainability commitments, as well as the misalignment between sustainability communication and market performance, this study proposes a user-anchored design decision pathway. A systematic innovation framework, IPA–CA–FCE, is developed for both consumers and designers, establishing a closed loop of attribute identification, preference modelling and multi-stakeholder quantification. Compared with existing single-point tools, the framework offers greater transferability and scalability, thereby enhancing the scientific rigour and practical feasibility of sustainable design decision-making. Guided by an Identification–Optimisation–Evaluation logic, the study first identifies key attributes of eco-friendly paper handbags and diagnoses importance–performance discrepancies using the IPA method. It then constructs optimal attribute combinations through CA to maximise consumer utility and market acceptance while revealing systematic differences between consumer and designer preference structures. Finally, the FCE method is employed to quantify the magnitude and dimensions of preference misalignment and solution acceptability under multi-criteria and uncertain conditions. Accordingly, the following research questions are proposed:
The structure of this thesis is as follows: Chapter 2 provides a comprehensive literature review, which is instrumental in defining the research topic and core concepts. It also reviews the current state of research in related fields, analyses the limitations of existing studies and emphasises the significance of sustainable design in fashion paper handbags. Chapter 3 outlines the research methodology in detail, detailing the system design process and method selection. Chapter 4 presents the research findings, analysing the system design discoveries and exploring their practical value. Chapter 5 includes a discussion section, proposing optimisation recommendations for businesses and discussing their implications for sustainable development strategies. Chapter 6 summarises the research findings, clarifying their theoretical and practical contributions, identifying research limitations and outlining future research directions.
Literature Review
Research Evolution and Design Challenges in Sustainable Fashion
The promotion of the United Nations Sustainable Development Goals (SDGs) has resulted in a growing body of research examining the role of the fashion industry in global sustainability, particularly in relation to Goals 12 (Responsible Consumption and Production) and 13 (Climate Action; Shafie et al., 2021; Wynn & Jones, 2022). The fashion industry is the second-largest polluting industry after the oil sector (Bailey et al., 2022). It is widely recognised as urgently requiring systemic reforms in raw material selection, production processes and resource management. Moreover, EU policies actively promote the transition to a circular economy model through the ‘reduce–reuse–recycle’ (3R) principle, assigning fashion designers a pivotal role in material selection and product innovation (Dan & Østergaard, 2021; Jacometti, 2019).
Recent research identifies biodegradable materials (such as kraft paper and recycled HDPE) as a means to enhance product sustainability, demonstrating promising application potential in eco-friendly packaging and accessory design (Angulo et al., 2021; Kam & Yoo, 2022; Noyon et al., 2023). Furthermore, minimalist aesthetics and multifunctional design strategies have been demonstrated to enhance the purchasing intent of the health and sustainable lifestyle (LOHAS) group (Q. Li, 2013; Wagner et al., 2017). However, eco-friendly materials are subject to certain limitations in terms of colour, texture, and shape expression, which have been shown to reduce their design flexibility in the aesthetic dimension and may weaken consumers’ perceived value (Rognoli et al., 2022; Sareh, 2024). The question of how to achieve an effective balance between aesthetics, functionality and environmental friendliness remains an important issue to be addressed in current sustainable product design.
The Disconnect Between Consumer Expectations and Design Practices
Despite an increasing number of companies beginning to prioritise sustainable development strategies, consumers’ understanding and acceptance of such products remains limited (Blazquez et al., 2020). Research indicates that consumers primarily focus on environmental labels and material sources when it comes to sustainability awareness, lacking a deeper understanding of the essence of ‘sustainable design’ (Okur & Saricam, 2019; Tryphena & Aram, 2023). Concurrently, while some consumers express a commitment to environmental responsibility, their actual purchasing behaviour is constrained by considerations of product functionality, price, and appearance (Ritch, 2020; Vătămănescu et al., 2021). This phenomenon is indicative of the ambiguity and contradictions inherent in consumers’ expectations regarding sustainability.
Conversely, when promoting product innovation, designers frequently prioritise material feasibility and process sustainability, often overlooking consumers’ genuine requirements in terms of aesthetics and usage scenarios. This tendency can impede the effective acceptance of ‘green design’ by the intended market (Agusalim, 2021; Hur & Cassidy, 2019). Despite the calls from certain studies for consumers to be incorporated into sustainable design processes and for the establishment of user-centred design toolkits (Neumann et al., 2021; Pan, 2012), empirical research remains limited, particularly in terms of the number of systematic application cases and the validation of methods for specific product categories (e.g., eco-friendly fashion paper handbags).
Theoretical Interpretations of Misalignment Between Consumers and Designers
Building on the previously identified disconnect between consumer expectations and design practices, this study elucidates the psychological mechanisms that systematically shape consumer–designer misalignments in sustainable product design. These misalignments are not incidental but reflect a systematic outcome of multiple, interacting psychological processes.
First, consumer decision-making is not purely rational; preferences are constructive and shaped by both emotional and cognitive processes (Bettman et al., 1998; Shiv & Fedorikhin, 1999). Accordingly, purchase decisions are driven not only by rational evaluation but also by affective and social–identity factors (Kam & Yoo, 2022; Shi et al., 2022). In the sustainable fashion context, consumers’ emotional identification with a brand’s environmental responsibility can translate into trust and purchase intention (Neumann et al., 2021). In contrast, design activities in early development stages often prioritise functionality and manufacturability, with insufficient institutionalised attention to aesthetic and emotional experience (Kam & Yoo, 2022; Pedro et al., 2024; Sareh, 2024). This structural imbalance lays the foundation for preference misalignment.
Second, attribution theory suggests that consumers make causal inferences about brand behaviour and product outcomes, which in turn influence their emotions, attitudes, and behavioural responses (Folkes, 1988; Weiner, 2000). In sustainability communication, if consumers attribute green claims to insincerity or inconsistency, their overall evaluation of the brand and its products declines (Nyilasy et al., 2014). For instance, consumers may attribute eco-friendly design to corporate social responsibility (Dai & Guo, 2024), whereas designers tend to view it as a matter of production feasibility (Faraoni, 2021; Sareh, 2024). Divergent attributions regarding motivation and evidence criteria thus amplify the preference gap.
Third, the Value–Belief–Norm (VBN) theory explains why consumers care about environmental protection. Biospheric–altruistic values activate personal norms through environmental beliefs (outcome awareness and ascription of responsibility), thereby promoting pro–environmental behaviour (Stern, 2000; Stern et al., 1999). However, designers in product development often emphasise functionality and market demand (Sareh, 2024) while neglecting consumers’ deeper ecological values (Nguyen et al., 2023). When design and communication fail to align with this motivational pathway, value resonance cannot be triggered, leading to a mismatch between ‘value appeal’ and ‘design supply’.
Finally, expectancy–disconfirmation theory reveals how consumers make purchase decisions based on expectations of product attributes (Schiebler et al., 2025). In sustainable product design, consumers generally form clear expectations regarding environmental performance, price acceptability, and aesthetic appeal (Yang et al., 2024). Yet process preferences that prioritise functionality and cost often hinder these expectations from being met (Sareh, 2024). When sustainable cues are perceived as potentially compromising product performance, preferences tend to shift towards non–green options (Luchs et al., 2010). Thus, the overlap of ‘expectation–performance gaps’ and ‘attribution–value mismatches’ on the demand side constitutes the key psychological mechanism underlying consumer–designer preference misalignment.
In summary, although prior research in consumer behaviour and psychology provides a theoretical foundation for understanding consumer–designer preference divergence, it still lacks an operational path grounded in key attributes of sustainable products. Therefore, this study employs the Value–Belief–Norm and expectancy–disconfirmation theories to define the value and expectation dimensions of environmental performance, price affordability, and aesthetic appeal; applies IPA to translate them into measurable indicators; incorporates constructive consumer choice and dual emotion–cognition processing to interpret attribute weighting and trade-offs through CA; and finally adopts FCE to quantify consumer–designer preference differences under multi-criteria and uncertain conditions.
The Starting Point and Theoretical Contribution of This Study
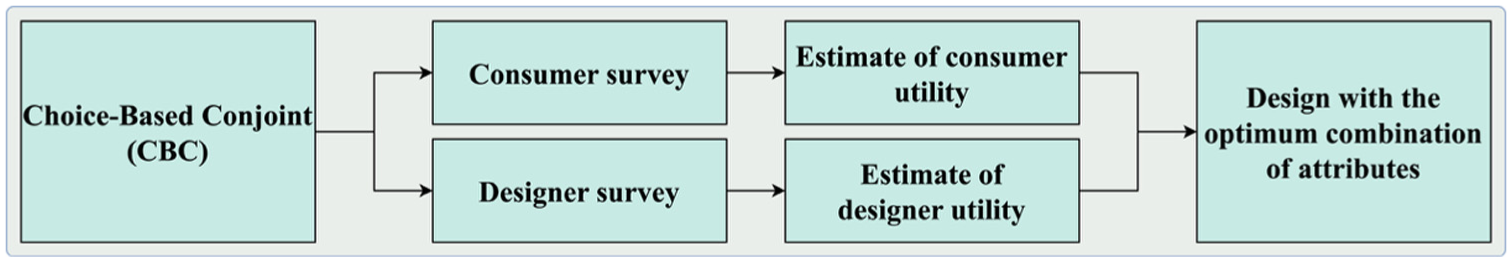
In order to address the aforementioned shortcomings, the present paper proposes a systematic design framework from the dual perspectives of consumers and designers (see Figure 1) and conducts empirical research using ‘eco-friendly fashion paper handbags’ as a case study. In terms of methodology, the paper integrates three analytical tools: Importance–performance analysis (IPA) to identify key attributes of consumer concern, conjoint analysis (CA) to construct the optimal design combination, and fuzzy comprehensive evaluation (FCE) to quantitatively assess preference differences between consumers and designers.

Research model for eco-friendly product design.
The primary contributions of this study are as follows: (1) In theoretically, it addresses the existing lacuna in the literature on the ‘consumer–designer cognitive misalignment in sustainable design’. (2) Methodologically, it proposes a design process integrating the IPA, CA, and FCE tools to enhance the decision-making science and practical applicability of sustainable design. (3) Practically, it provides an optimisation path based on market feedback for the design and development of sustainable fashion products, such as eco-friendly paper handbags, thereby helping to achieve the dual objectives of design precision and product commercialisation.
Method
The objective of this study is to achieve environmentally friendly and fashionable paper handbag designs that will satisfy consumers and bridge the gap between designers and consumers. To this end, a set of innovative systematic design methods will be integrated, with the design process being conducted from the perspective of the consumer. The process in question is illustrated in Figure 2.

Practical steps for systematically designing an eco-friendly fashion paper handbag.
IPA Method for Obtaining Product Attributes and Levels
The concept of Importance–Performance Analysis (IPA) was initially introduced by Martilla and James in 1977. This analytical framework aims to integrate the two dimensions of importance and performance, facilitating the evaluation of product or service attributes. The primary objective of IPA is to assist enterprises in optimising resource allocation and enhancing user satisfaction (Martilla & James, 1977). In the domain of product design, IPA has been employed to analyse the perceived value and satisfaction of various attributes, thus assisting companies in making design decisions (Joung & Kim, 2021). This study considers consumers’ importance of paper handbag design attributes as the importance dimension and satisfaction as the performance dimension to provide a basis for design optimisation (Shaikh et al., 2023). The present paper proposes an IPA–based product attribute identification process (see Figure 3 for details).

Steps to obtain product attribute information using the IPA method.
Obtaining Product Attribute Information
In order to ensure the compliance of information collection, this paper exclusively collects publicly available information about online products. The data is collected through manual review, supplemented by speech-to-text tools and the screenshot function of the Microsoft Edge browser to improve the efficiency of recording and organisation. The specific process is outlined as follows:
(1) The initial phase of the process involves the collection of information and the establishment of preliminary organisational structures. Screenshots were then taken of the front, side, back, top and parameter information of handbags using the Microsoft Edge browser. These were subsequently screened, categorised and deduplicated to ensure the completeness and accuracy of the information. The final result of this process was the organisation of 14 attributes and 54 hierarchical pieces of information.
(2) A detailed exposition on supplementation and attribute categorisation. The utilisation of speech-to-text tools is recommended for the purpose of supplementing product details that have not been covered, such as removable straps, zipper structure, pendant function and hidden pockets. These details should then be categorised into four attributes and 15 hierarchical information items.
(3) Expert Selection and Authority Assessment: The selection of experts was based on three key criteria: technical capabilities, process experience, and academic background. The expert authority coefficient method was employed to evaluate them across six dimensions: work experience, academic background, theoretical knowledge, analytical ability, contribution to achievements and literature support. In conclusion, 10 experts were confirmed to participate in this study, with an expert authority coefficient of 0.96, indicating that the expert group possesses high authority (Sossa et al., 2017).
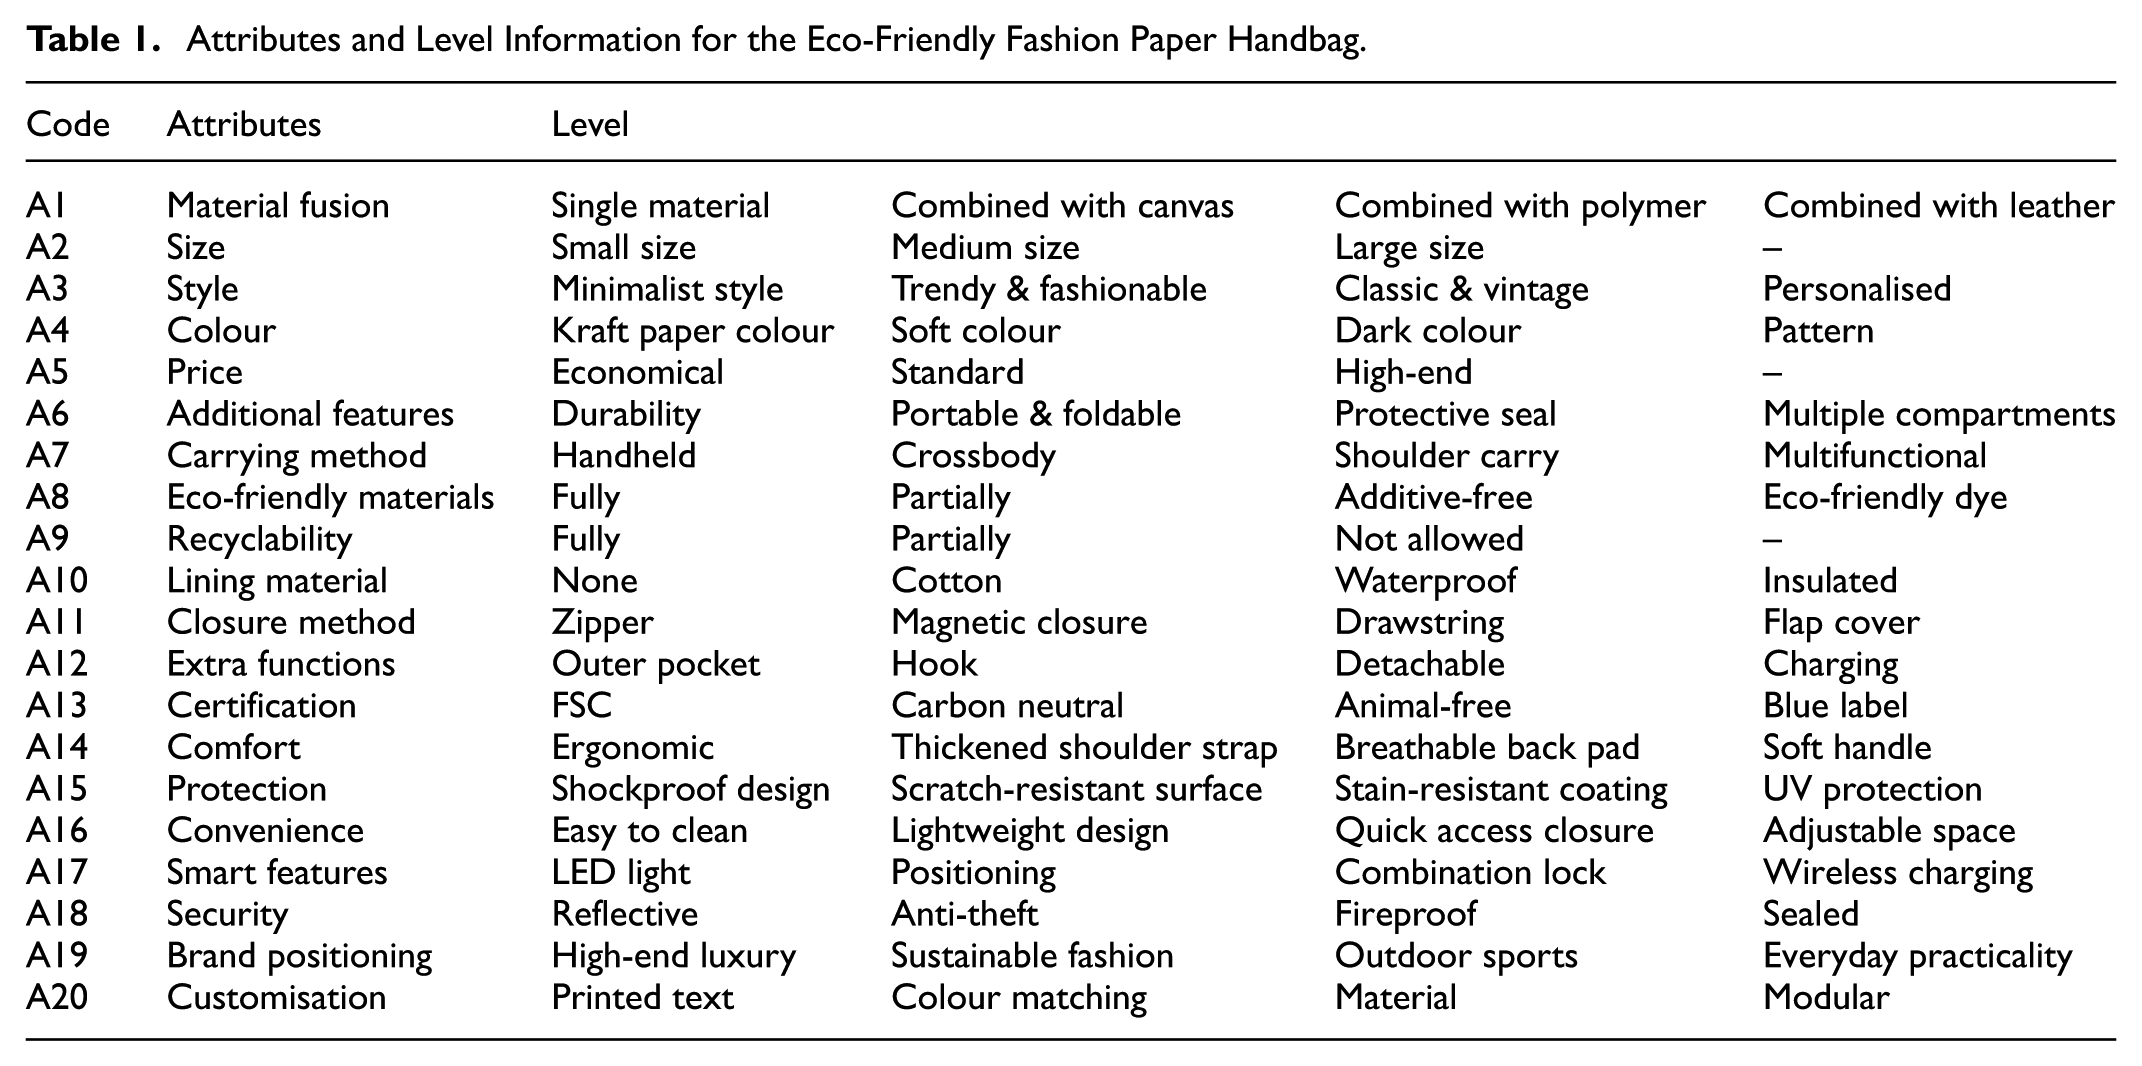
(4) The process of information condensation and attribute confirmation. On 10 October 2024, a group of experts convened to evaluate and augment the information using the brainstorming method, identify any gaps, and summarise and categorise the information using content analysis (e.g., ‘pendant function’ was categorised under ‘additional functions’). The final dataset comprised 20 product attributes and 77 hierarchical information items, as outlined in Table 1.
Attributes and Level Information for the Eco-Friendly Fashion Paper Handbag.
Design, Distribution and Collection of IPA Questionnaires
The design, distribution, and collection of the importance questionnaire and satisfaction questionnaire were all conducted using Wenjuanxing (an online questionnaire platform, www.wjx.cn).
The two questionnaires under consideration both consist of four sections: the first section is the product introduction and instructions; the second section is the respondent basic information; the third section is the attribute evaluation; and the fourth section is the screening questions. The importance questionnaire utilises a 5-point scale ranging from ‘not at all important’ to ‘very important’ to evaluate the significance of each attribute. Similarly, the satisfaction questionnaire employs a 5-point scale from ‘not at all satisfied’ to ‘very satisfied’ to ascertain users’ genuine experiences and perceived preferences.
Generation Z is widely regarded as the primary consumer demographic for this particular product (X. Zhao & An, 2023). The survey instrument was disseminated to university students via online platforms. The sample encompassed six cities: Guangzhou, Hangzhou, Xi’an, Zhengzhou, Shenyang and Hohhot, with the aim of accounting for regional differences in southern, central, and northern China. Guangzhou and Hangzhou are significant production and design centres for eco-friendly paper handbags, while the other cities represent a variety of cultural and consumption backgrounds.
In order to ensure the validity of the data collected, invalid questionnaires were identified through the implementation of attention questions and response time analysis. From 5 November to 27 November 2024, a total of 470 valid importance questionnaires (response rate: 86%) and 447 satisfaction questionnaires (response rate: 82%) were collected.
Data Analysis of IPA Questionnaire
Both sets of questionnaire data were synchronised to SPSSAU (Online Data Analysis Platform, website: www.spssau.com) for analysis. The findings indicated that the Cronbach’s α coefficients for the two questionnaires were 0.934, suggesting that the scales exhibited remarkably high internal consistency (Taber, 2018). The KMO values were 0.899 and 0.890, respectively, both significantly higher than 0.6. The Bartlett sphericity test results showed p-values less than .05, indicating good correlation among variables and suitability of the data for factor analysis (Öztürk & Karakaş, 2016). The detailed statistical results are presented in Table 2. The descriptive statistical indicators were computed using the SPSSAU online platform.
Descriptive Statistics, Reliability and Validity Data of the Questionnaire.

The mean (M) represents the arithmetic average, as shown in Formula 1.

The standard deviation (SD) indicates the dispersion of data around the mean, as shown in Formula 2.

The median (Md) denotes the middle value in an ordered dataset, reflecting the central tendency unaffected by extreme values.
Use a Four-Quadrant Diagram to Obtain Attribute Information
The IPA method calculates the mean values of importance (I) and satisfaction (P) for each attribute to identify their relative positions in a two-dimensional grid (four quadrants). Each attribute is plotted according to its mean importance and performance values (Ii, Pi), as shown in Formula 3.

The construction of a four-quadrant diagram was undertaken to facilitate visual analysis of the mean values of importance and satisfaction, as presented in Table 2. This analysis was conducted utilising the SPSSAU platform (see Figure 4). Among these, attributes in the ‘Keep up the good work’ quadrant (high importance, high satisfaction) should maintain their current performance to sustain user satisfaction; attributes in the ‘Concentrate here’ quadrant (high importance, low satisfaction) are critical design elements that require priority improvement; the remaining two quadrants, with lower attribute importance, can have resource allocation reduced or addressed at a later stage (Bose et al., 2023). It is evident that the attributes in the ‘Concentrate here’ quadrant (Size [A2], Style [A3], Colour [A4], and Price [A5]) and their hierarchical information serve as the foundation for subsequent joint analysis in this paper.

IPA method four-quadrant diagram.
Obtaining the Optimal Combination Using the CA Method
Conjoint analysis (CA) was initially applied in the field of marketing to simulate real-world choice scenarios, thus enabling researchers to identify consumers’ preferences for product attributes and the trade-off mechanisms between multiple attributes (Green & Srinivasan, 1978). This method has been shown to quantify the influence of each attribute level on the formation of preferences (Wang et al., 2022; Yoo & Ohta, 1994), and to enable the construction of optimal product design combinations. This has led to its wide use in the fields of product optimisation and consumer behaviour research. The specific implementation process is illustrated in Figure 5.
Steps for obtaining the optimal combination using the CA method.
Design, Distribution and Collection of CA Questionnaires
In view of the fact that conventional orthogonal designs have been shown to engender prediction biases in conjoint analysis (Sylcott et al., 2015), this study adopted the CA module, which was developed on the basis of the Choice-Based Conjoint (CBC) system in the Wenjuanxing platform. CBC introduces random and efficient design strategies to better align with real-world choice scenarios, thereby enhancing the balance of combinations and the accuracy of utility estimates (Gustafsson et al., 2000). The questionnaire employs a stratified sampling strategy and is structured into three sections: rules introduction, basic information (including a ‘yes/no’ option for the designer), and the CA task (see Sample Table 3). The CA task has been designed with 6 groups and 18 options, with the objective of minimising respondent fatigue and improving data quality. This ensures that each attribute level appears at least 3 times.
Sample Questionnaire for the CBC System of the CA Method.

From 22 November to 17 December 2024, the consumer survey was conducted across 12 universities in six cities spanning southern, central, and northern China, while the designer survey was administered in 11 cities (e.g., Guangzhou, Xi’an and Shenyang). After excluding inattentive or abnormally timed responses, 444 valid consumer and 417 valid designer questionnaires were retained (both exceeding the Wenjuanxing validity threshold, n > 100). Designer demographics were as follows: work experience: 1 to 2 years (22%), 3 to 4 years (48%), 5 to 6 years (21%), and over 6 years (9%); professional sector: product design (100%); geographic distribution: South (62%), Central (26%), and North (12%). Comprehensive subgroup breakdowns are provided in Supplemental Appendix A.
Data Analysis of the CA Method Questionnaire
The Choice-Based Conjoint (CBC) method is grounded in the Random Utility Theory, assuming that an individual n selects the product alternative j within choice task t that yields the highest utility Unjt, as shown in Formula 4.

Where Vnjt denotes the systematic component modelled as a linear combination of attribute levels, and εnjt represents the random error term. The deterministic utility is expressed as shown in Formula 5.

The probability that alternative j is chosen by individual n in task t follows a multinomial logit distribution, as shown in Formula 6.

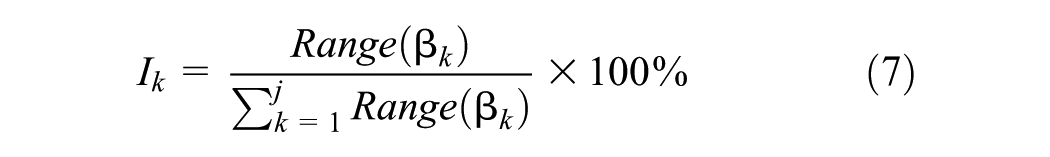
Subsequently, the relative importance of attribute k is calculated as shown in Formula 7.
As demonstrated in Table 4, a clear distinction emerges between consumers and designers with regard to their preferences for paper handbags. In the CA questionnaire, consumers indicated their optimal combination as ‘minimalist style, pattern, large size, high-end price range (>100 yuan)’ (concept utility value: 89.34); meanwhile, designers expressed a preference for ‘personalised, kraft paper colour, medium size, standard price range (50–100 yuan)’ (concept utility value: 198.91). Nevertheless, reliance on group comparisons alone complicates the validation of significant disparities in preferences between the two optimal combinations from the perspective of the consumer. Consequently, subsequent quantitative analysis will be conducted using consumers as samples to ensure the scientific validity, rationality and effectiveness of the difference measurements.
Attribute Importance Data Analysis of the CA Method Questionnaire.

Product Design Practices Based on Optimal Combinations
In order to effectively quantify consumer preferences, the research team constructed a product design prototype based on the optimal combination of the two attributes. On 24 December 2024, the research team conducted a search for ‘women + attribute + fashion bag’ on Taobao (an online shopping platform, www.taobao.com), selected the top–selling products, and extracted their typical attributes for the purpose of redesign. The preliminary design draft was formulated through a combination of computer–aided hand–drawn sketches and visual optimisation of the images using the Stable Diffusion AI tool. This process culminated in the creation of a paper handbag design proposal. The detailed design process is illustrated in Figure 6.

Optimal attribute combinations based on consumer and designer preferences.
Quantitative Analysis Using the FCE Method
The Fuzzy Comprehensive Evaluation (FCE) was proposed by Zadeh (1965) on the basis of fuzzy set theory. The utilisation of membership functions facilitates the conversion of qualitative assessments into quantifiable metrics, thereby rendering it conducive to multifaceted, comprehensive evaluation (Vivek et al., 2020; Zadeh, 1965). This method effectively addresses decision-making problems involving fuzzy information and difficulties in precise quantification, and is widely applied in uncertain analysis scenarios. In recent years, the FCE method has also been extensively utilised for the comprehensive evaluation of products and design schemes (Y. Zhao et al., 2024). The present study employs the FCE method to conduct a quantitative analysis of the differences between consumer and designer preference combinations, with the specific implementation process shown in Figure 7.

Steps for evaluating design proposal using the FCE method.
It is important to note that the IPA–CA–FCE integrated model is not product–specific, but rather a scalable evaluation framework. Its structured logic can be customised and replicated across various sustainable product categories and stakeholder groups to support cognitive alignment in user-driven design. This framework is especially relevant in sectors facing complex trade-offs between aesthetics, functionality and environmental responsibility.
Determination of the Set of Evaluation Factors and the Set of Linguistic Ratings
The evaluation factor set and rating scale set are the core components of the FCE method, which is utilised to systematically measure and interpret preference differences in the attribute levels of eco-friendly fashion paper handbags. The optimal attribute combination design diagram obtained from the aforementioned CA method forms the basis of this paper’s use of the key attributes in Table 4 as the evaluation factor set. In order to enhance the respondents’ perception of preference differences and the interpretability of the evaluation results, this paper proposes a division of the rating scale into five categories. The specific content is shown in Table 7.
The Design, Distribution and Collection of the FCE Method Questionnaire
In light of the previously specified optimal attribute combinations, evaluation factor set and rating levels, we developed a questionnaire entitled ‘Comparative Evaluation of Preference Differences between Optimal Design Combinations’. Based on preliminary research, the focal target group for eco-friendly fashion paper handbags comprises women aged 18 to 40 years with an undergraduate degree or higher. Following a small-scale pretest, the formal survey was administered via the Wenjuanxing platform during 7–24 January 2025 and 15 September–4 October 2025, spanning 114 cities across southern, central and northern China.
The instrument employed a five-point Likert scale (see Sample Table 5). To ensure data validity, we incorporated attention–check items and excluded responses with abnormal completion times, as well as those from male, lower educational attainment, art–major, or elderly participants, resulting in 521 excluded responses and 973 valid responses. Respondents’ basic characteristics and subgroup counts are reported in Table 6; detailed statistical results appear in Table 7; and the city–level demographic breakdown is provided in Supplemental Appendix B.
Sample Questionnaire for Evaluating Preference Differences in Optimal Combination Design.


Note. V1 = significant difference; V2 = strong difference; V3 = moderate difference; V4 = weak difference; V5 = no difference.
Basic Information of the FCE Method Questionnaire.

Note. Q = question; N/P = number/percent.
Statistics of the Evaluation Questionnaire on Preference Differences in Optimal Combination Design.

Note. V1 = significant difference; V2 = strong difference; V3 = moderate difference; V4 = weak difference; V5 = no difference.
The Validity and Reliability of the Questionnaire
The present study conducted reliability and validity tests on the evaluation questionnaire using SPSSAU. When the KMO value exceeds 0.6 and the Bartlett sphericity test p–value is less than .05, the data is deemed suitable for factor analysis (Sigudla & Maritz, 2023). Concurrently, a Cronbach’s α coefficient above .7 signifies that the questionnaire possesses adequate internal consistency (Taber, 2018). The analysis results demonstrated that the KMO value was 0.844, and the Bartlett test p = .000, thereby supporting the applicability of factor analysis; Cronbach’s α was .891, indicating good reliability of the questionnaire.
The Construction of the Membership Degree Matrix
In the FCE method, membership values range from 0 to 1, while survey questionnaire values represent the number of evaluators who prefer a particular rating level within a set of rating levels for the evaluated object. Consequently, the construction of the membership degree matrix necessitates the normalisation of these values. In accordance with the law of large numbers, the normalised value R1 of V1 is calculated to be V1/479. A similar process is employed to construct the membership degree matrix R1 to R5, as shown in Formula 8.

Determine the Weight Vectors of the Factor Set and the Linguistic Rating Set
In order to ensure the consistency and reproducibility of the evaluation results, this study assigned weights based on the attribute importance values derived from empirical consumer data in Table 4. The four core attributes, Style, Price, Colour and Size, had original importance values of 0.36, 0.29, 0.21, and 0.15, respectively, which were normalised to yield the factor set weight vector WF = (0.36, 0.29, 0.21, 0.15). This empirically driven weighting approach eliminates subjective assumptions and ensures that the weights directly reflect the authentic structure of consumer preferences. In comparison with expert judgement methods such as the Analytic Hierarchy Process (AHP), the empirical weighting adopted in this study serves to reduce researcher bias and enhance methodological transparency, thereby improving the cross–study replicability of the framework.
The weight vector of the evaluation statement set is derived from the five-level preference difference values, specifically the score vectors W′V corresponding to (V1, V2, V3, V4, V5) (100, 90, 80, 70, 60). Following the process of normalisation, the evaluation criterion set weight vector WV is obtained as 0.250, 0.225, 0.200, 0.175, 0.150.
Comprehensive Evaluation and Score Derivation of the FCE Method
Firstly, the factor set indicator weight vector WF is multiplied by the membership degree matrix R to obtain the comprehensive membership degree vector S value, as shown in Formula 9.

The subsequent step involves the multiplication of the comprehensive membership degree vector ST (the transpose of the membership degree matrix S) by the evaluation criterion set weight vector WV, in order to calculate the comprehensive score μ, utilising the double weight method, as shown in Formula 10.

In the third step of the process, the score vector W′V is to be multiplied by the comprehensive membership degree vector ST, in order to calculate the double-weight method comprehensive score μ′, as shown in Formula 11.

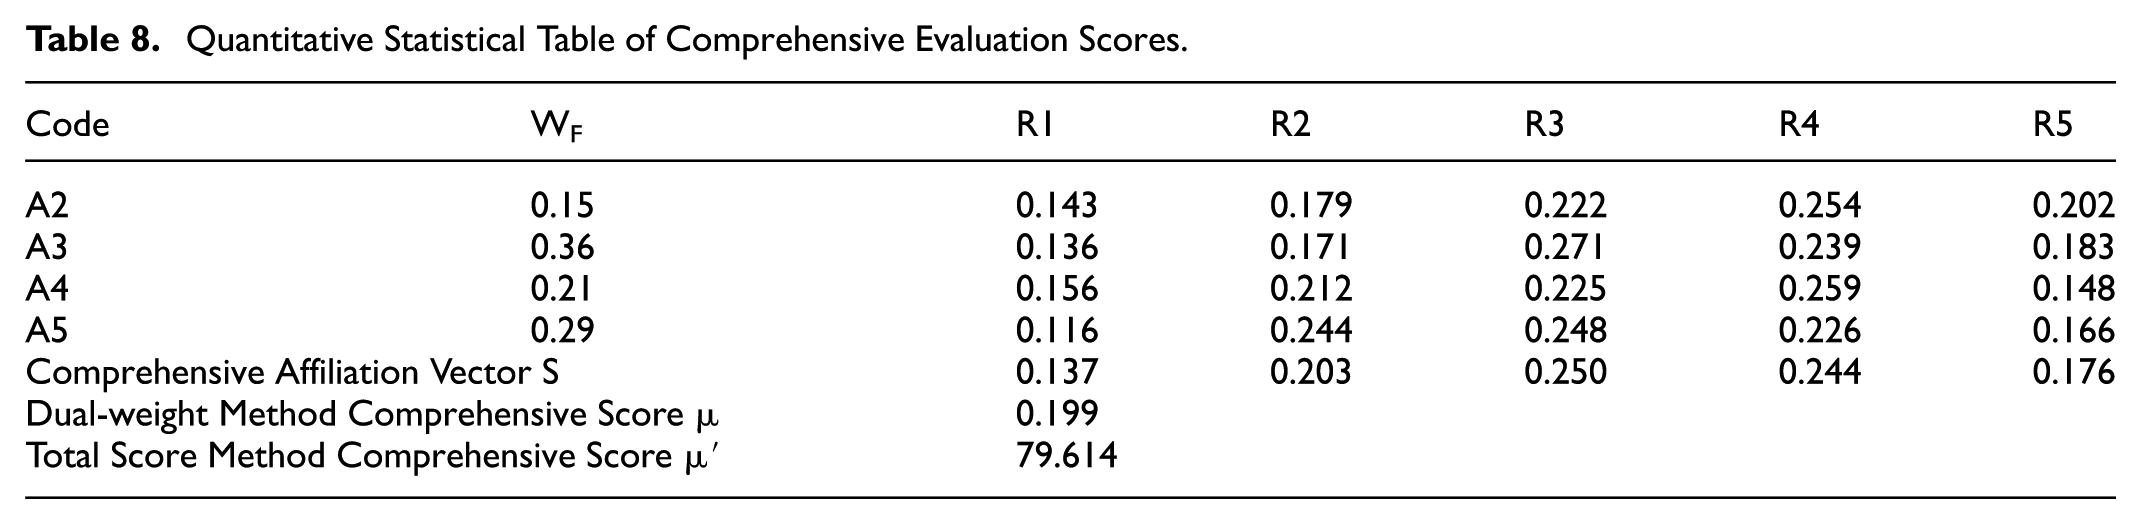
The detailed results of the comprehensive subordination degree matrix calculation are shown in Table 8.
Quantitative Statistical Table of Comprehensive Evaluation Scores.
Analysis of Results
IPA Method Results Analysis
As illustrated in Figure 3, the six attributes that fall within the ‘Keep up the good work’ quadrant are as follows: The following methods are to be considered: carrying method (A7), closure method (A11), comfort (A14), protection (A15), convenience (A16), and security (A18). This finding suggests that consumers’ demands for practicality and a positive user experience in paper handbags have been predominantly fulfilled.
Conversely, the attributes in the ‘Concentrate Here’ quadrant are pivotal domains for product optimisation, reflecting consumers’ elevated priority on these attributes, while contemporary market products have not yet fulfilled expectations. In terms of importance ranking, A4 > A3 = A5 > A2, indicating that colour is the attribute of greatest importance to consumers, as the first perceptual factor and thus has a direct impact on purchasing decisions (Martinez et al., 2021). In terms of performance level, A3 > A2 > A4 > A5, indicating that consumers are least satisfied with price, perceiving it as poor value for money (see Figure 8). Consequently, when optimising product design, companies should prioritise improvements in price (A5) and colour (A4), while also considering style (A3) and size (A2), to achieve the dual objectives of enhancing resource allocation and consumer satisfaction.

Mean distribution of importance and satisfaction in the ‘concentrate here’ quadrant.
CA Method Results Analysis
A significant disparity in the perception of preferences between consumers and designers is evident in the misalignment of attribute priority rankings. Consumer preferences are evidenced by the prioritisation of A3 over A5, A4 and A2, while designers’ rankings are in the order of A5, A2, A4 and A3 (see Figure 9).

Comparison of importance of attributes in consumer and designer questionnaires.
In relation to style, consumers regard it as the most significant attribute, while designers allocate it the lowest priority. This suggests that designers underestimate the influence of style, resulting in a discrepancy between market trends and design. With regard to the matter of price, although both parties assign it a high priority, consumers rank it second, while designers consider it to be of the utmost importance. This finding indicates that designers are prioritising cost and pricing control, while consumers are placing a greater emphasis on the overall value of the product. The combination of the hierarchical preferences delineated in Table 4 indicates a consumer preference for high-end products, while designers exhibit a predilection for standard ones. In relation to colour, both consumers and designers have ranked it third, indicating that colour has achieved a consensus in product design. In relation to size, consumers consider it the least important attribute, while designers assign it a higher weight, suggesting that designers may overemphasise size. This finding suggests that the prevailing size standards have largely met consumer needs, and that optimisation priorities can be appropriately reduced.
FCE Method Results Analysis
As demonstrated in Table 6, Option A is the preferred option among 56% of consumers, suggesting a stronger alignment with market preferences. Nevertheless, Option B retains substantial competitive potential. In terms of age demographics, the 26 to 30 age group demonstrated a clear preference for Option A, while the 31 to 40 age group exhibited a preference for Option B. This finding suggests that product demand varies slightly across different age demographics. With respect to educational attainment, as levels of education rise, the proportion of respondents opting for Option A gradually declines, while the proportion favouring Option B concomitantly rises. This finding indicates that consumers with higher levels of education exhibit a stronger preference for artistic aesthetics, while those with bachelor’s or master’s degrees demonstrate a stronger inclination towards mainstream aesthetics (see Figure 10).

Comparison chart of age and academic background in design plans A/B.
The comprehensive score indicates a discrepancy of 79.23 points between Scheme A and Scheme B, which approaches the lower boundary of the strong difference range (80 points). This finding suggests that the two schemes exhibit a moderately high level of discrepancy in market acceptance, as illustrated in Table 8. This finding indicates that designers may possess an inaccurate understanding of consumer needs. However, it is important to note that the two schemes appear to correspond to different consumer groups, each exhibiting distinct aesthetic preferences. Consequently, they possess the potential for complementary market positioning.
Integration of IPA–CA–FCE Results
The integrated application of IPA, CA and FCE establishes a closed analytical loop that progresses from attribute identification and preference optimisation to multi-stakeholder evaluation. First, IPA identifies the key attributes requiring priority improvement–namely style, price, colour, and size–thereby providing direction for design optimisation. Second, CA reveals systematic differences in attribute prioritisation between consumers and designers: consumers place greater emphasis on stylistic features (while also considering colour and price), whereas designers focus more on cost control and functional feasibility. This divergence in preference structure results in two optimal combinations, highlighting potential misalignments in design decision-making.
Building upon this, FCE quantitatively validates the above combinations under multi-criteria and uncertain conditions. The results indicate that the consumer–oriented combination generally achieves higher market acceptance, while the designer–oriented combination retains appeal among certain groups (such as consumers with higher education levels or older age). Notably, the FCE results do not suggest a dichotomy between the two combinations but rather reveal their complementarity, indicating that different configurations can effectively cover differentiated market segments.
Overall, the IPA–CA–FCE framework achieves a progressive integration from attribute diagnosis → optimal combination → market validation. IPA identifies the key improvement priorities, CA constructs and compares optimal configurations and FCE evaluates acceptance levels and characterises preference misalignments. This systematic integration enhances the logical coherence and explanatory power of the research findings, providing a more operational quantitative pathway for addressing consumer–designer alignment in sustainable product design.
Discussion
Discussion of Research Results
IPA Method Analysis
The integration of environmental sustainability with aesthetic appeal in paper handbags has led to the emergence of a novel product category. The availability of a wide range of colour options, coupled with competitive pricing, has been shown to exert a substantial influence on consumer decision-making processes. It is evident that consumers ascribe considerable importance to the attribute of colour. Existing products may exhibit deficiencies in terms of colour variety, alignment with prevailing trends and expected outcomes, which could compromise user experience and satisfaction, thereby influencing purchase intent. Moreover, paper handbags are often perceived as having lower value and are frequently viewed as low–cost, non–durable items, thus leading to facile comparisons with similar products such as canvas bags or leather handbags. Should the price exceed consumers’ psychological expectations, it may result in a weakening of their market appeal. Consequently, companies are advised to optimise their colour schemes in accordance with prevailing trends, thereby enhancing their aesthetic appeal. Simultaneously, they should establish reasonable prices and underscore the environmental value of their products, thus fostering consumer acceptance of premium pricing. This approach is expected to enhance market competitiveness and customer satisfaction.
CA Method Analysis
A significant disparity exists between consumers and designers in their perceptions of pivotal purchasing factors, including style, price, colour and size. While consumers prioritise the practicality of paper handbags, they place greater emphasis on personalisation and fashionability. Conversely, designers place a higher value on materials, functionality, and environmental attributes, frequently neglecting the impact of style on consumer decision-making. With regard to price, although both parties value it, consumers are more willing to pay a premium for products that meet their needs rather than simply pursuing low prices. Concerning size, designers hypothesise that it impacts functionality, while consumers demonstrate a lesser sensitivity to this aspect, prioritising instead style, price, and colour, that is, visual and economic factors. Consequently, companies are advised to adjust their design strategies to prioritise fashionability and personalisation, optimise pricing and colour schemes, strengthen brand recognition and product differentiation, reduce investment in size, and allocate resources to meet consumers’ core preferences to enhance market acceptance and brand competitiveness.
FCE Method Analysis
While both Design Scheme A and Scheme B received comparable levels of support, consumers exhibited a clear preference for designs that align with their aesthetic preferences and needs. The slightly higher support rate suggests that a consumer–centric design approach may be more effective than a traditional designer–driven model in enhancing market competitiveness. The role of age and education level in shaping preferences is a critical consideration. The 26 to 30 age group, characterised by increased handbag usage, exhibits a heightened inclination towards paper handbags. Conversely, individuals with lower educational attainment demonstrate a preference for designs that are intuitive in nature (Design A). In contrast, those with higher educational attainment place greater value on personalised expression (Design B). The diversification of consumer preferences in terms of functionality, style, price and colour indicates that both designs have market potential. Consequently, companies are advised to enhance their consumer research, with a particular focus on key demographic differences, notably trends among different age groups and educational backgrounds. Furthermore, companies should optimise product design and develop diversified marketing strategies to address diverse market needs, thereby enhancing product competitiveness and customer satisfaction.
Justification of IPA–CA–FCE as an Eco-friendly Product Design Framework
To define a method as an eco-friendly product design approach, it must meet the following criteria: environmental objectives should be incorporated alongside functionality, price and aesthetics at the early design stage (Sareh, 2024); user key attributes should serve as anchors to form measurable improvement priorities (Pinkse & Bohnsack, 2021); and the method should provide a reusable optimisation pathway under multi-stakeholder and uncertain conditions (Jugend et al., 2024). The IPA–CA–FCE framework precisely satisfies these three standards.
IPA makes consumers’ key concerns explicit by identifying improvement areas with ‘high importance–low performance’, thereby clarifying resource allocation and optimisation priorities. CA estimates marginal utilities and attribute interactions under multi-attribute trade-offs, producing optimal combinations through choice-based randomisation and efficient design to enhance external validity. FCE quantitatively compares market acceptance among candidate schemes under multi-criteria and uncertain conditions, measuring consumer–designer preference discrepancies and avoiding superficial comparisons based solely on group averages.
In summary, IPA provides attribute–level identification of ‘importance–performance’ gaps; CA generates and validates optimal combinations acceptable to the market; and FCE evaluates multi-stakeholder preference differences under uncertainty. Collectively, these methods form a practical pathway from information acquisition → gap identification → combination optimisation → acceptance evaluation. Therefore, the IPA–CA–FCE framework not only foregrounds environmental objectives and translates them into measurable and optimisable design decisions but also demonstrates cross-category transferability, qualifying it as an eco-friendly and generalisable product design approach.
Theoretical Implications
Existing research on sustainable fashion primarily focuses on consumers’ attitudes and purchase intentions (Blazquez et al., 2020; Ritch, 2020) or on designers’ trade-offs in materials and production techniques (Agusalim, 2021; Hur & Cassidy, 2019). However, the ‘consumer–designer perception gap’ has largely remained at a qualitative level, lacking analytical frameworks capable of identifying divergences at the attribute level and systematically quantifying them under multi-stakeholder and uncertain conditions. This limitation prevents the field from addressing two fundamental questions: Which specific design attributes drive these gaps? And how can diagnostic insights be translated into market–viable design solutions and optimisation pathways?
The theoretical contribution of this study lies in three dimensions: it proposes and validates an integrated IPA–CA–FCE framework that converts the abstract notion of perception gaps into a measurable cognitive–divergence model and establishes a unified methodological pipeline (‘information acquisition → gap identification → combination optimisation → acceptance evaluation’) with demonstrated cross-category transferability; it reveals, based on this model, that the primary source of misalignment resides in aesthetic attributes (style, colour, size and price sensitivity) rather than functional or sustainability–related values, thereby providing quantitative evidence for non-oppositional divergence and reframing the interpretive logic of consumer–designer relations; and it integrates gap identification, design generation, and market validation within a single empirical framework to advance perception–gap analysis from post hoc observation to design-level application, offering a replicable and transferable theoretical pathway for user-oriented sustainable product development.
Management Implications
Recent research findings suggest the presence of a moderate discrepancy between the perceptions of Chinese enterprises and consumers regarding demand for eco-friendly paper handbags, which is indicative of distinct aesthetic preferences. When selecting eco-friendly paper handbags, consumers place greater emphasis on factors such as style, design, colour variety, price positioning and size. Enterprises should maintain the eco-friendly attributes of their products while optimising design strategies to enhance market appeal and purchase intent. Consumer analysis indicates that individuals aged 26 to 30 exhibit the highest acceptance of eco-friendly fashion products, providing a targeted marketing direction. It is evident that contemporary corporations are able to utilise social media platforms and influencer marketing as a means to enhance product visibility. Moreover, the systematic product design framework proposed in this study has broad applicability and can be used to optimise the development of other sustainable fashion products. This will assist companies in enhancing their competitiveness and brand trust while fulfilling their environmental responsibilities.
Conclusions
Taking eco-friendly paper handbags as a case study, this research integrates the IPA, CA and FCE methods to propose a systematic framework for aligning consumer and designer preferences. The results reveal moderate differences in perceptions regarding style, price, colour and size, while showing a high degree of consistency in the recognition of environmental and functional values. This ‘non-oppositional divergence’ suggests that the core challenge of sustainable design lies not in value conflict but in differentiated aesthetic orientations. Accordingly, this study transforms the abstract concept of ‘consumer–designer perception gap’ into a measurable, optimisable, and transferable analytical path, bridging the theoretical gap in quantifying preference divergence and coordinating multi-stakeholder needs within sustainable fashion.
At the theoretical level, the study identifies the key mechanisms underlying consumer–designer preference misalignment and validates the applicability of the IPA–CA–FCE framework for multi-stakeholder coordination and design optimisation, demonstrating its potential for cross-category transferability. At the practical level, it highlights that enterprises should maintain environmental credibility while paying greater attention to style and price sensitivity, and employ dynamic feedback mechanisms to enhance the alignment between design and market demand.
In sum, this research provides a replicable pathway for consumer–centred sustainable product design and offers new insights for achieving a balance between value resonance and market competitiveness in the fashion industry.
Research Limitations and Future Research
Although this study offers certain theoretical and methodological innovations, the conclusions remain subject to boundary conditions: the sample is drawn primarily from Chinese consumers, and the specificity of the cultural context constrains the cross-cultural generalisability of the findings; moreover, preference matching has not yet undergone external calibration against real market data, making it impossible to identify and quantify any systematic discrepancies between stated preferences and actual purchases.
Future research should broaden the sample across multiple cultural settings and undertake cross-cultural comparisons, combining multi-group measurement invariance tests with hierarchical/multilevel models to evaluate the cross-context robustness of the preference structure and the sources of observed differences. In parallel, the inquiry should be extended horizontally to core apparel categories and accessories to examine the applicability and transferability of the conclusions across product domains. Methodologically, we recommend integrating artificial intelligence and machine learning to enhance the automation and accuracy of preference identification and attribute modelling, and linking multi-source behavioural data to implement external calibration and causal testing so as to assess the genuine impact of preference differences on purchasing behaviour.
Supplemental Material
sj-docx-1-sgo-10.1177_21582440251405333 – Supplemental material for Bridging Consumer–Designer Gaps in Sustainable Fashion: A Framework for Eco-Friendly Product Design
Supplemental material, sj-docx-1-sgo-10.1177_21582440251405333 for Bridging Consumer–Designer Gaps in Sustainable Fashion: A Framework for Eco-Friendly Product Design by Haifei Ge and Jaewook Shin in SAGE Open
Footnotes
Acknowledgements
The work reported in this paper was conducted by support of Dong-A University and Weinan Normal University.
Ethical Considerations
This study complied with institutional and national research-ethics guidelines and adhered to the principles of the Declaration of Helsinki. The study employed a minimal-risk, online questionnaire, involved no medical procedures or human experimentation and did not collect personally identifiable information. On this basis, formal ethics approval was not required, as determined by the Academic Committee of Weinan Normal University on 23 July 2025. All data were analysed and reported in aggregate; results were presented anonymously and used solely for research purposes. All participants were aged 18 years or over.
Consent to Participate
This study involved human participants who completed an online questionnaire. Electronic informed consent was obtained from all participants prior to accessing the questionnaire; participation was permitted only after they agreed to the consent statement. The consent process took place during 5 November 2024–24 January 2025 and 15 September 2025–4 October 2025. Before consenting, participants were informed of the study purpose, procedures, minimal risks and benefits, and confidentiality measures; they were also advised that participation was voluntary, that they could withdraw at any time without consequences, and that responses would be used solely for research purposes. All participants were aged 18 years or over.
Author Contributions
Haifei Ge: Writing – review & editing, Writing – original draft, Visualisation, Validation, Supervision, Software, Resources, Methodology, Investigation, Data curation, Conceptualisation. Jaewook Shin: Writing – review & editing, Supervision, Investigation.
Funding
The authors received no financial support for the research, authorship, and/or publication of this article.
Declaration of Conflicting Interests
The authors declared no potential conflicts of interest with respect to the research, authorship, and/or publication of this article.
Data Availability Statement
Data sharing not applicable to this article as no datasets were generated or analysed during the current study.
Supplemental Material
Supplemental material for this article is available online.
References
Supplementary Material
Please find the following supplemental material available below.
For Open Access articles published under a Creative Commons License, all supplemental material carries the same license as the article it is associated with.
For non-Open Access articles published, all supplemental material carries a non-exclusive license, and permission requests for re-use of supplemental material or any part of supplemental material shall be sent directly to the copyright owner as specified in the copyright notice associated with the article.