
Abstract
Two types of importance-performance analysis (IPA), quadrant model and diagonal line model, are applied widely. Some studies have described the advantages of the diagonal line model, but multiple studies have reported disadvantages of direct measures of importance, as used in the traditional diagonal line model. In addition, there is no clear rationale for the use of a 45-degree diagonal line as a distinguishing line in the diagonal line model. This study used the partial correlation coefficient-base of attributes corresponding to overall satisfaction to measure a new importance value to replace direct importance in the traditional method. The new diagonal line reflects the average of the slope formed by the impact of various attributes on overall satisfaction, rather than a 45-degree diagonal line. The new approach was successfully applied to determine a management strategy of tourist satisfaction, and the results confirm the rationality of the studied case and were considered reasonable by appropriate managers.
Keywords
Introduction
Importance-performance analysis (IPA) has been widely utilized in brand optimization, service quality, and customer satisfaction applications since its initial introduction by Martilla and James (1997). IPA is a popular tool because it is easy to operate and its results are easily interpretable (Feng et al., 2014). The original IPA model relies on data typically collected via survey. After calculations of the performance and importance of various attributes, the means of performance and importance can then be plotted onto the four quadrants of a two-dimensional (2D) matrix-grid. On this matrix-grid, the performance of a given attribute is plotted on the X-axis and the importance of the attribute is plotted on the Y-axis. The quadrants include “Keep Up the Work,” “Concentrate Here,” “Low Priority,” and “Possible Overkill,” numbered from I to IV, respectively.
This original IPA model (quadrant model) has been applied in many previous studies, including Zhang and Chow (2004), Hudson et al. (2004), Aigbedo and Parameswaran (2004), Prajogo and McDermott (2011), Sorensson and Friedrichs (2013), Pan (2015), Hanssen and Mathisen (2018), and Birendra et al. (2018). In addition to this original quadrant model, the diagonal line model has also been widely used, including in studies by Slack (1994), Nale et al. (2000), Levenburg and Magal (2005), Sirdifield et al. (2016), Jahwari et al. (2016), and Boley et al. (2017). Bacon (2003) found that the diagonal line model performed better than the quadrant models, and strongly recommended the use of a diagonal line model for IPA applications. Based on this finding, this study was designed using a diagonal line model.
In particular, two distinct kinds of importance measure are commonly used in IPA applications: (a) direct measures based on a k-point Likert-type scale or metric ratings, as subjective importance, and (b) indirect measures obtained from the performance ratings, either by regression model of an overall service quality, satisfaction ratings assigned to individual attributes, or other objective importance measurements. The advantages and disadvantages of these two kinds of importance measures are discussed in detail in the next section. Although many scholars have suggested that indirect measures are better than direct measures, indirect measures have been little applied in diagonal line models. Thus, a goal of this study was to evaluate the use of indirect measures for diagonal line models.
The reasonability of utilization of a 45-degree diagonal line as a distinguishing line in diagonal line model has not been assessed comprehensively. The importance and performance of each service attribute can be considered as different variables, and these cannot be compared simply. It is important to assess what makes a diagonal slope appropriate for a distinguishing line. Azzopardi performed comparative analysis of data-centered, scale-centered, diagonal methods, competitiveness and importance measurement issues in the IPA literature. Several recent studies compared data-centered and scale-centered methods, so they are not examined here. Instead, the goal of this work was to assess the use of indirect measures for diagonal line models and assess the rationality of use of a diagonal line. Building on previous findings, a more effective indirect measurement method was selected, and an innovative slope calculation method was developed and integrated into a new diagonal line model approach for more accurate application. Finally, this novel approach was compared with a traditional approach for a case empirical study.
Literature Review
Diagonal Line Model
Hawres and Rao (1985) first proposed the use of a 45-degree diagonal line to divide Quadrants I and III of a traditional IPA model into two regions. The lower region of the diagonal line is marked as “Satisfied Needs” and the upper region is marked as “Market Opportunities,” as considerations of marketing decision-making. Any attribute located above the diagonal line has an importance level that exceeds its performance level, indicating that consumers will not be completely satisfied with this attribute. Marketers should consider improving the performance of this attribute to better meet market needs (hence, this is considered a “Market Opportunity”). Any attribute that is located below the iso-rating diagonal has a level of performance that exceeds its level of importance. In this case, consumers attach little importance to the attribute, so marketers are unlikely to gain a competitive advantage by efforts to improve this attribute (hence, this is considered “Satisfied Needs”). Not many studied used this model; however, it is still utilized as Ziegler et al. (2012).
Abalo et al. (2007) further the diagonal line model into four quadrants. Attributes located above the diagonal line are in the “Concentrate Here” region. The regions below the diagonal line are further divided into “Low Priority” for the low performance region, “Keep Up the Work” for the high performance and high importance region, and “Possible Overkill” for the high performance and low importance region. Using this distinguishing method, any attribute located above the diagonal line is considered a candidate attribute worthy of targeted improvement because its importance level is higher than its corresponding performance rating. Any attribute located below the diagonal line and located in Quadrant IV is the same as in the model, with the original IPA model definition of “Possible Overkill.” Attributes located below the diagonal line and in Quadrant III are in “Low Priority” regions, and attributes located above the diagonal line and in Quadrant I are in the “Keep Up the Work” region.
Biesok and Wyród-Wróbel (2015) used another convention, based on analysis of survey data on student satisfaction at the University of Bielsko-Biala. The authors defined a six-field criterion, described below:
The meanings of Regions B and D are the same meanings as those for Quadrants II and IV in the original IPA matrix-grid.
Regions A1 and C1, corresponding to the portions of Quadrants I and III of the original IPA that are below the diagonal line, are designated as “Keep Up the Work” and “Low Priority” regions. The definitions are the same as those in the model of a four-field criterion.
Region A2, the region corresponding to Quadrant I of the original IPA but above the diagonal line, is denoted as a “Warning” region. The attributes are currently positive, but if they become worse, they will require immediate improvement as they may significantly affect customer satisfaction. This is different than the precise definition used in the model of a four-field criterion. (i.e., “Concentrate Here”).
Region C2, in Quadrant III of the traditional IPA but above the diagonal line, is denoted as an “Improve” region, including attributes that should be improved over a certain period of time. Again, this is not exactly the same as the precise definition of a four-field criterion as “Low Priority.”
The matrix-gird of the original quadrant model and the above-mentioned diagonal line model are presented in Figure 1. Very few studies have compared these models to determine whether the diagonal line model or the quadrant model is better.
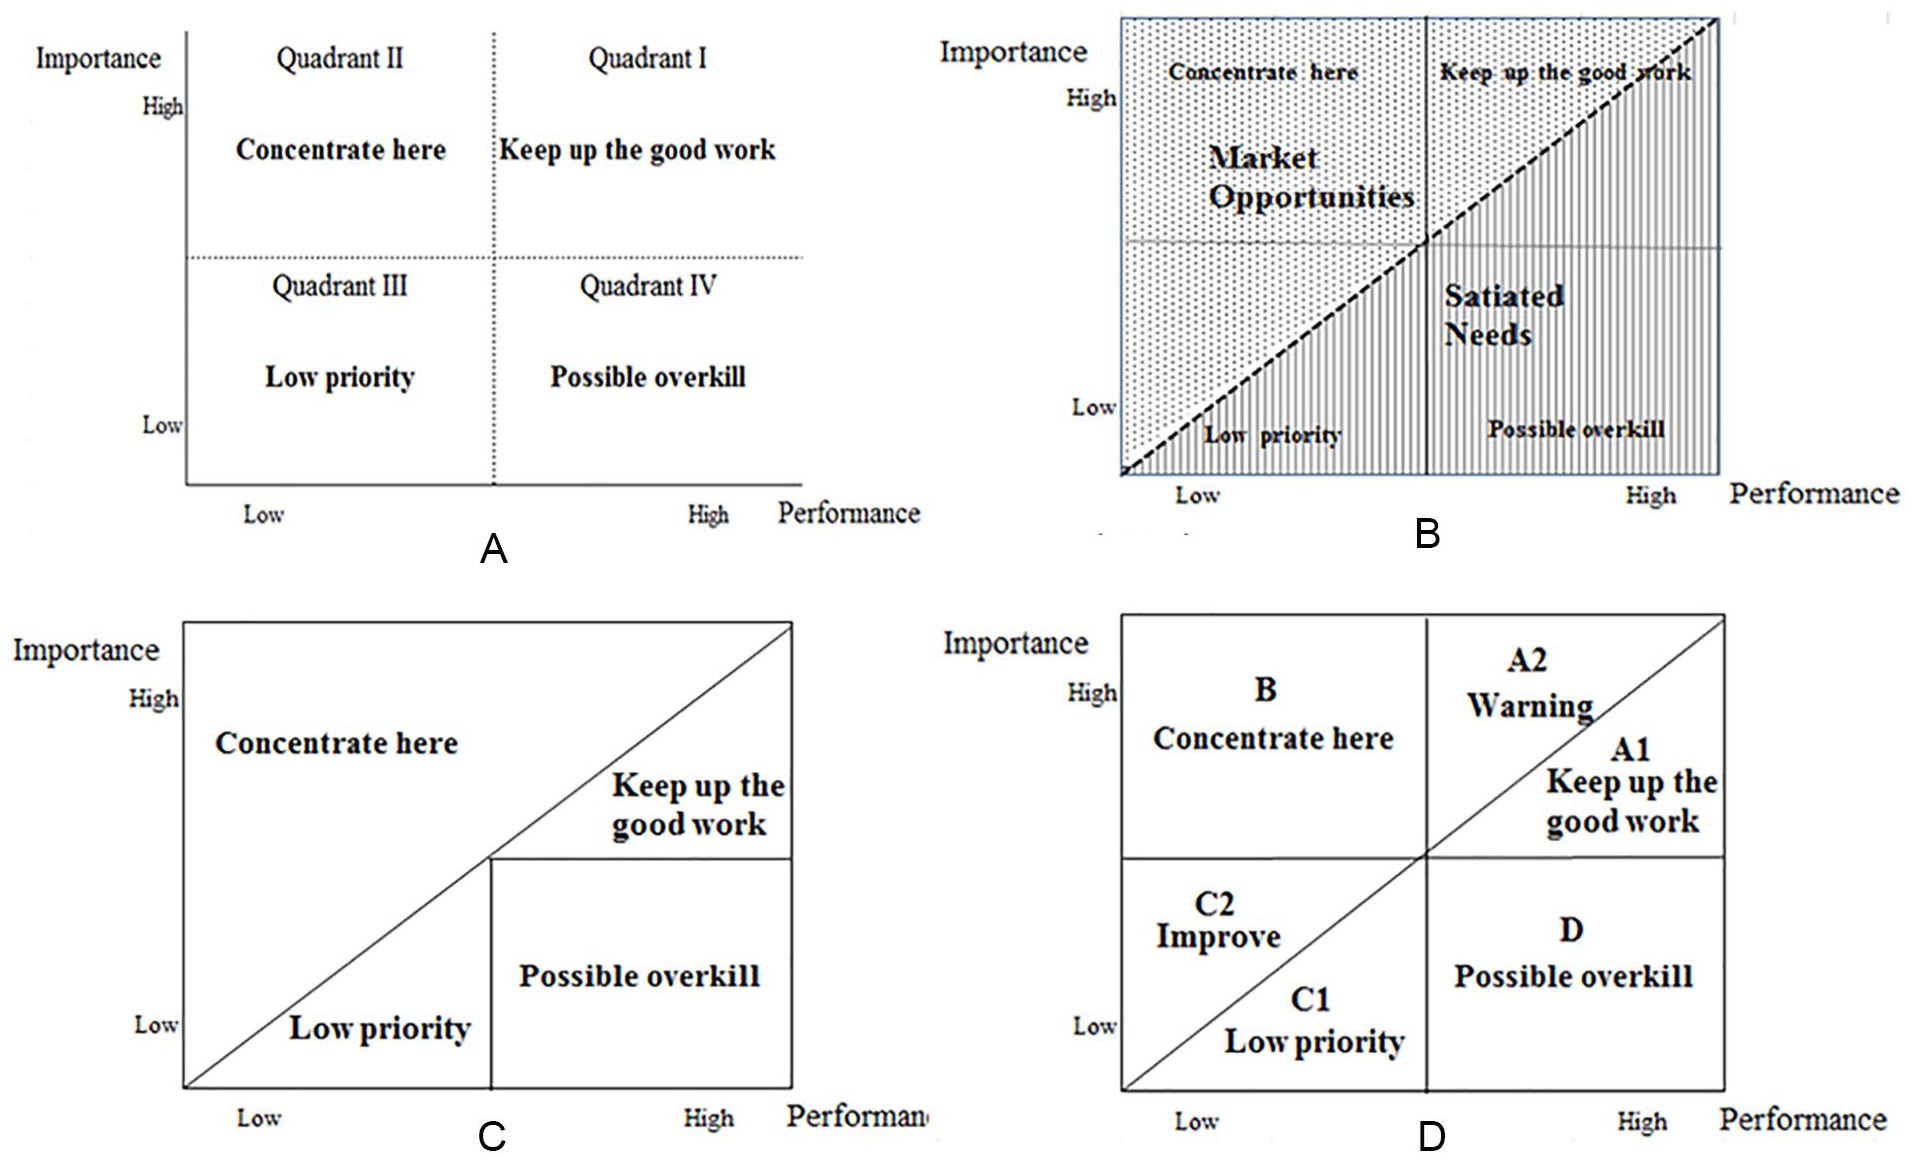
IPA matrix-gird of the original quadrant model and several diagonal line models: (A) original IPA matrix-grid, (B) matrix-grid of a two-field criterion of diagonal line model, (C) matrix-grid of a four-field criterion of diagonal line model, and (D) matrix-grid of a six-field criterion of diagonal line model.
Direct Measures or Indirect Measures of Importance in IPA
Most published studies use direct measures of importance, and some studies found that direct measures capture the importance of attributes better than indirect measures (e.g., Bacon, 2003; Heeler et al., 1979). Bacon (2003) pointed out that regression models assume interval measurement and linear relationships, but these conditions may not always hold. However, the author pointed out that statistically minded may make intuitive sense and closer examination, and emphasizes that direct measures of importance may be misleading because ratings are uniformly high.
Oh (2001) found that individual evaluation of the importance of attributes could lead to confusion among respondents, reducing the prediction ability of the IPA model. Matzler et al. (2004) pointed out that the original IPA model only uses the average of the importance of attributes, potentially reducing the accuracy of the results. Sever (2015) suggested that the concepts and methodology of the original IPA are poorly defined. Hence, indirect measures use linear regression coefficients as importance measures to represent the relationship between the overall performance of a product/service and its performance with respect to its individual attributes. The regression-base measure can reduce the demands on the interviewee’s attention (as only the performance scale is available, no importance), which may increase interviewee involvement.
Danaher (1997) pointed out that this method also can be limited by the possibilities of multicollinearity and nonlinearity. Hair et al. (1995) pointed out that partial correlation analysis is more suitable than regression analysis to quantify the influence of independent variables on dependent variables when there is multicollinearity, and it may be able to capture greater sensitivity for independent variables (Anderson & Sullivan, 1993). Hence, Matzler et al. (2003) utilized the partial correlation coefficient instead of the regression coefficient to avoid collinearity problems. In another approach, Deng (2007) proposed the natural logarithm conversion of the attributes score to resolve the potential nonlinearity between overall satisfaction and attributes. Therefore, the above concerns have been basically resolved.
Some studies reported negative coefficients for some attributes in multiple regression models of performance, especially when many attributes are studied simultaneously (e.g., Wittink & Bayer, 1994). These negative coefficients imply a negative importance, and clearly indicate a violation of assumptions because all the attributes for analyses are generally considered to be important. In practice, using a partial correlation coefficient instead of regression coefficient, and better care in conducting the questionnaire should help avoid this problem in most cases.
Other studies have used other objective measures method. Multicriteria decision-making (MCDM) method is the most popular method used to determine relative importance and has been used in studies such as Tsai et al. (2011) and Nurcahyo et al. (2019). Artificial Neural Network (ANN) methods have also been adopted for this purpose, such as works by Deng et al. (2008) and Mikulić and Prebežac (2012). Fuzzy theory has also been used to classify service attributes into quadrants and has been used in studies, including Chu and Guo (2015) and Tang et al. (2019). A ranking approach was used by Mersha and Adlakha (1992), Sampson and Showalter (1999), and Abalo et al. (2016). Although valid approaches, these techniques are more sophisticated, with complex data collection and calculation process that makes research participation difficult, leading to poor universality of these approaches (Azzopardi, 2013). Therefore, the goal of this study was to address some of the major issues in IPA studies in ways that are easier to apply. Indirect measures of importance are obtained by common logarithm conversion and partial correlation coefficient-base method instead of direct measures of importance, which can effectively improve the IPA utility.
The Slope of the Diagonal Line
Diagonal line models have been widely applied, but to the best of our knowledge, all of these studies used a 45-degree diagonal line. The importance and performance of the service attribute are separate concepts and can be regarded as different variables. While using IPA, we need to calculate the average of the importance and performance of each attribute from the collected questionnaire to determine the location on the matrix-grid for each attribute. The average of importance and the average of performance for each attribute are not necessary same. For instance, suppose a case, with average importance of all attributes of 3.8 and average performance of all attributes of 3.4. For a certain Attribute A with an importance score of 3.85 and performance score of 3.5, and another certain Attribute B with an importance score of 3.95 and a performance score of 3.6, Attribute A would be located in the “Warning” region (A2 region) and Attribute B would be located in the “Keep Up the Work” region (A1 region) in a six-field criterion of a diagonal line model. However, does this make sense? Why does Attribute B require action and Attribute A require only warning action if the performance of Attribute B is higher than the performance of Attribute A? Thus, it is debatable if this classification is reasonable.
Bacon (2003) proposed that the slope of a diagonal line can be computed from regression coefficients determined when regressing the priorities on importance and performance measures
Sum up the application of three kinds of diagonal line model proposed in the past, regarding the slop of diagonal line, a 45-degree diagonal line was used totally. As regard the measure methods of important, direct measure in two-field criterion; direct measure in four-field criterion as well, but Abalo et al. (2007) further using the rank analysis method; direct measure in six-field criterion too, but Wyród-Wróbel and Biesok (2017) further using single linear regression, and compare the differences between different models in the two-, four-, and six-field criterion. Hence, this study adopt indirect measure method that the natural logarithm conversion of overall satisfaction score first, then calculating the partial correlation coefficients of attributes corresponding to overall satisfaction as newt importance, to replace the direct importance of attributes used in the past. In addition, a new diagonal line was used that reflects the average of the slope formed by the impact of various attributes on overall satisfaction, rather than the 45-degree diagonal line used in previous diagonal line model. The detailed calculated steps were explanted in the following section.
Method
The new indirect measure of importance and new slope of diagonal line are calculated according to the following steps:
First, the overall satisfaction scores based on the collected valid questionnaires were subjected to common logarithm conversion (log). A multiple regression model was established with the converted scores of overall satisfaction and the scores of each service attribute. The multivariate regression model was then calculated using Equation 1:

where m represents the mth service attribute.
Next, after confirming the establishment of the regression model, the partial correlation coefficient of each service attribute was then calculated. This partial correlation coefficient is the new importance of each service attribute, calculated according to Equation 2:
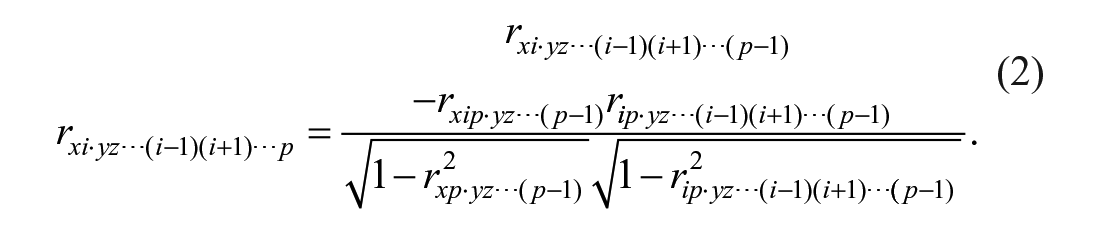
The location of each service attribute in the matrix-grid is determined by its average performance and new importance. The tangent

where Ii is the new importance of the ith service attribute, and
The new diagonal line composed of the average slopes of all service attributes is used, as calculated in Equation 4:

The above steps were used to calculate the new importance of each attribute, and the slope of the diagonal line was calculated from the average impacts of service attributes on overall satisfaction. These new importance values and new diagonal line were utilized with a six-field criterion and definitions to establish a new version of a diagonal line model of IPA.
Analysis
Selected Case
To test the model, a case study was used that focused on tourist satisfaction at the Xiamen International Convention and Exhibition Center (XICEC). XICEC is located in Xiamen City in Fujian Province of China. This is the main venue of the China International Investment and Trade Fair. XICEC is a large-scale modern exhibition place that integrates exhibitions, conferences, catering, hotels, tourism, warehousing, and advertising. The venue covers an area of 197,000 square meters, with indoor exhibition halls of 60,000 square meters, which can accommodate 3,500 international standard booths, over 20 meeting rooms, with a 4-star hotel and catering center. Since construction in September 2000, there have been many international exhibitions at this location, and exhibition tourism is a key development goal for this city.
The Designed Questionnaire
The designed questionnaire was comprised of three parts. The first part collected the basic information of the interviewees, including four questions of gender, age, educational level, and occupation. Many IPA studies have just used well-developed attributes derived from previous researches, and the second part included the 22 service attributes contained in five dimensions (refer to Parasuraman et al., 1988, 1991), integrated and modified from previous relevant research (e.g., Altin et al., 2018; Pnevmatikoudi & Stavrinoudis, 2016; Sainaghi et al., 2013; 2017, 2019), as listed in Table 1. Interviewees were asked to select their levels of satisfaction (performance) for each service attribute. The Likert type was used for responses, with five levels of very dissatisfied, dissatisfied, generally, satisfied, and very satisfied, corresponding to scores of 0.2, 0.4, 0.6, 0.8, and 1, respectively. To compare with the original six-field criterion model with direct measure of importance, interviewees were also required to select the importance of every attribute, also using a 5-point Likert-type scale, with responses of not very important, not important, generally, important, and very important, corresponding to scores of 0.2, 0.4, 0.6, 0.8, and 1, respectively. This use of the same scale allowed easy comparison of the results for the two methods. The third part assessed the overall satisfaction of the interviewees with XICEC and used a range of 0 to 100 points.
Service Attributes for This Case Study.

Valid Questionnaire and Demographic Profile of Respondents
In the second half of 2018 to the beginning of 2019, four exhibitions were selected randomly of the exhibitions held at this site, at which visitors could attend for free of charge. About 120 to 140 visitors per exhibition were randomly invited to fill out the questionnaire at the three exits at the south, west, and north of the venue. A total of 370 visitors completed the questionnaire. After removal of 46 incomplete questionnaires, there were 324 completed questionnaires, for an effective rate of 87.56%. The demographic profile of the survey respondents with valid questionnaires is shown in Table 2.
Demographic Profile of Respondents.

Reliability and Validity Analysis
The reliability and validity of the questionnaire were tested using SPSS 20.0 software. The results show that the Cronbach’s α values for the five dimensions were greater than .75, with an overall Cronbach’s α value of .914, indicating sufficient reliability of the questionnaire data. For validity analysis, Kaiser–Meyer–Olkin (KMO) measure of sampling adequacy and Bartlett’s test of sphericity were used. The KMO value was calculated as 0.913, with a significance probability value of .000, indicating suitability for further factor analysis.
Factor analysis showed a cumulative contribution rate of three principal components of 63.85%, and the extraction of these three principal components can better explain the information contained in the original attributes. The factor load value was then set to only show the factor load value if greater than 0.5 in the principal component analysis, so the smaller factor load value was not shown. The results of the rotation component matrix show that the factor load value of Q9 factor does not appear. Other service attributes are included in three principal components, but attributes Q23, Q16, Q11, and Q17 appear in Principal Components 1 and 2; hence, these attributes are not included in further analysis (as listed in Table 3). Three service attributes are included in Principal Component 2, and three service attributes are included in Principal Component 3. Hence, the five dimensions of the originally designed questionnaire were therefore modified to three dimensions containing 17 service attributes (as listed in Table 4). This analysis indicated sufficient validity of the questionnaire.
Principal Component Analysis.

New Dimensions and Attributes.

Establishment and Testing of Multiregression Model
The overall satisfaction scores were subjected to natural logarithm conversion, according to Equation 1, and then a regression model was established with the scores of each service attribute. Next, the multiple regression model was tested. The result shows the regression model is fit, due to the significance probability value of .000, much smaller than .05 (as listed in Table 5).
ANOVA Table.
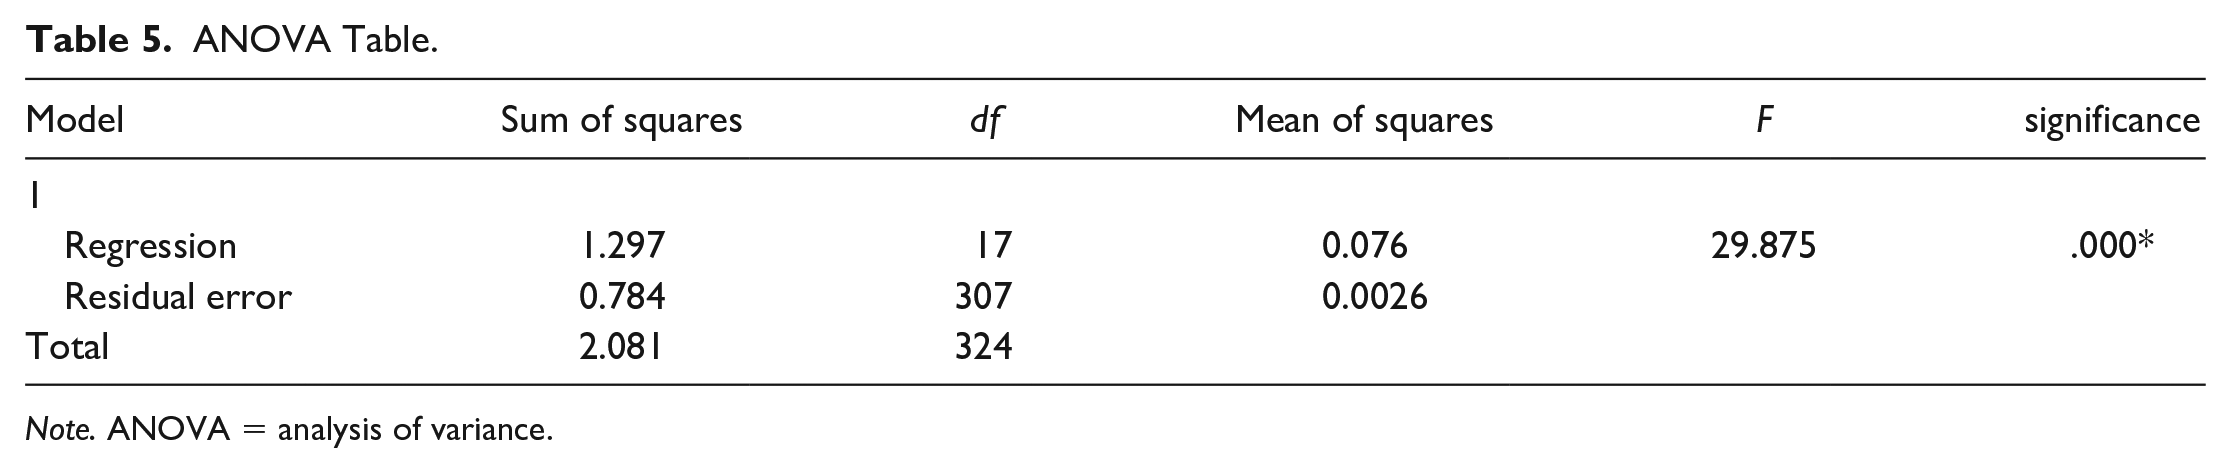
Note. ANOVA = analysis of variance.
Calculation of Partial Correlation Coefficients
The partial correlation coefficients were calculated for each service attribute according to Equation 2 to determine the new importance of each service attribute. The results are shown in Table 6.
The Slop of Diagonal Line and Related Parameters.

Calculation of the Slope of Oblique Line
After calculating the average performance of the individual service attributes, the new importance of each individual service attribute was divided by the average performance. The slope of each service attribute was then obtained by calculating its arctan value (based on Equation 3). Finally, Equation 4 was used to calculate the average slope as the angle of the diagonal line. The average slope of all attributes was 47.46 degrees, and the calculated related parameters are listed in Table 6.
Results
Based on the new approach with indirect measure of importance and new slope of diagonal line, performance on the X-axis represents individual satisfaction of service attribute and the new importance on the Y-axis represents indirect measure by partial correlation coefficient-base between overall satisfaction and each performance of service attribute. The slope of the new diagonal line is based on the average slope of each diagonal line, for a matrix-grid of a six-field region diagonal line model, as shown in Figure 2. Service attributes are positioned as follows:
The attributes falling in Quadrant I below the diagonal line (A1 region) have high importance and satisfaction, and satisfaction is higher than the importance. Q8, Q10, and Q20 are located in this region. The high performance of these attributes should be maintained.
The attributes in Quadrant I but above the diagonal line (A2 region) have high importance and satisfaction, with higher importance than satisfaction. Q12, Q14, and Q21 are located in this region. These attributes are fair, but if they become worse, immediate improvement will be required as these factors have significant importance.
The attributes in Quadrant II (B region) have high importance but low satisfaction. Q13, Q18, Q19, Q22, Q25, and Q26 are located in this region. These six attributes require immediate and concentrated improvement.
The attributes in Quadrant III below the diagonal line (C1 region) have low importance and satisfaction, and satisfaction is higher than the importance. Q6 and Q15 are located here. These attributes have low priority for improvement.
The attributes in Quadrant III but above the diagonal line (C2 region) have low importance and satisfaction, with satisfaction lower than the importance. Only Q24 is located here. This attribute is slightly less important than others but should be improved eventually.
The attributes in Quadrant IV (D region) have low importance and high satisfaction. Q7 and Q27 are located here. Previous management strategies may have placed too much emphasis on these attributes and should re-examine the appropriateness of resource use.

IPA matrix-grid of new approach.
Based on the original method with direct measure of importance and a 45-degree diagonal line, the performance on the X-axis represents individual satisfaction of service attribute, the Y-axis uses direct measure, and a 45-degree diagonal line was used to obtain the matrix-grid of a six-field region diagonal line model, as shown in Figure 3.

IPA matrix-grid of original method.
Discussion and Conclusion
According to the results of the new analysis approach, efforts should focus on the improvement of six service attributes, including Q13, Q18, Q19, Q22, Q25, and Q26. Efforts should also be made to maintain three high performance service attributes, including Q8, Q10, and Q20. When appropriate, efforts should be made to improve Q24. Attributes Q12, Q14, and Q21 should be addressed if there are any changes in tourist satisfaction. In addition, given limited resources, resources used to support Q7 and Q27 can be redirected to other service attributes that require more attention.
However, compared with the results of traditional methods, the results are largely overlapped but few different. The location of Q6, Q14, Q19, Q20, Q24, and Q26 is different, accounting for 6/17 = 35.3% of the total analytical service attributes, which can be said to be not small. Of course, the difference of meaning in A1 and A2, and in B and C2, is not large. However, wherein Q19 and Q20 are relatively large, accounting for 11.8% of total analytical service attributes. The summary of region of attribute located between two methods is shown in Table 7.
Summary of Region of Attribute Located Between Two Methods.

The research implication is that the new approach proposed by the study is able to improve the utility of IPA, because this new approach included two major changes relative to previous models. The importance is used by indirect measure (partial correlation coefficient-base) between overall satisfactions with individual satisfaction of service attribute. This kind of indirect measure of importance can effectively improve the problems existing in collinearity and nonlinear, and its application in diagonal line model can also improve the accuracy of IPA utility. The second significant improvement is the setting of the slope of the diagonal line. The original model simply uses the 45-degree diagonal line as the distinguishing line, but there is no evidence that this is appropriate. In this study, the influence of each service attribute was evaluated for overall satisfaction. The slope for each service attribute was calculated on the matrix-grid, and then the average slope of all service attributes was obtained as the diagonal line. In particular, the diagonal lines of the X-axis and Y-axis of the matrix-grid of the original IPA model are based on the average of performance and importance of service attributes. Therefore, it is more reasonable to use the average of the influence of service attributes on the overall satisfaction to obtain the appropriate slope of the diagonal line. In sum, the proposed method improves the results, and they remain quite stable; hence, it can be valuable to either academicians or practitioners.
The results showed that attention should be paid to six service attributes to immediately improve tourist satisfaction. Three service attributes should be monitored to determine whether tourist satisfaction is declining, and one service attribute should be improved at an appropriate time. Furthermore, according to the four service attributes that matter less to tourists, the organization can adjust its strategy or management to maximize resource utilization. In addition, the results confirm the rationality of application of this model and were viewed positively by management personnel at XICEC.
However, there are some limitations of this work. First, there is little previous study of service attributes for this center, so the data may not be sufficient for effective evaluation of the 22 service attributes. Second, the general applicability of these results to all exhibition centers should be investigated. Third, the accuracy of the analysis results may not be sufficient, given the limited number of visitors who completed the questionnaire. However, the main purpose of this study was not to necessarily identify the most effective strategy to improve visitor satisfaction at the exhibition center, but to use a real case to verify the availability of the new approach for a diagonal line model of IPA utility. Finally, calculation of the slope of the diagonal line will be affected by different scoring rules within the Likert-type questionnaire, and the use of a different range of overall satisfaction score may also have an impact. The general applicability of this method can be explored in future research.
Footnotes
Declaration of Conflicting Interests
The author(s) declared no potential conflicts of interest with respect to the research, authorship, and/or publication of this article.
Funding
The author(s) received no financial support for the research, authorship, and/or publication of this article.