
Abstract
Traditional consumer confidence indices (CCIs) rely primarily on low-frequency surveys, limiting their timeliness and resilience during periods of rapid change. This study addresses this shortcoming by proposing a structured multi-source framework (3D-SDIM). This framework views confidence as a latent construct composed of four dimensions—expectations, behavior, context, and sentiment—and estimates it based on quarterly data from a major metropolitan area (2000–2024). This study fuses heterogeneous indicators using a hybrid weighting scheme and estimates the quarterly CCI using a variational autoencoder supplemented by a dynamic feedback step; its performance is benchmarked against existing machine learning benchmarks. Key findings: (i) The estimated CCI closely tracks the official data series and captures inflection points around major events, such as the global financial crisis, the COVID-19 pandemic, and the 2022 turmoil. (ii) Out-of-sample errors are consistently lower than the baseline, with smaller overshoots at the onset of shocks and faster post-shock adjustments. (iii) Dimensional attribution remains interpretable, linking forward-looking expectations, actual behavior, macroeconomic fundamentals, and social sentiment. The framework advances measurement by connecting macro-level statistics and micro-level digital traces in a single latent model, providing actionable signals for policy—early warnings, targeted stimulus timing, and recovery monitoring. While demonstrated in a single city, the modular design supports portability through local indicator substitution and weight recalibration.
Plain Language Summary
Understanding how confident city residents feel about the economy is important for predicting spending and shaping government policy. Traditionally, researchers have used questionnaires to measure consumer confidence, but this method can be slow and may not reflect rapid changes in society. In this study, we introduce a new approach that combines information from different sources: traditional surveys, online shopping and payment data, economic statistics, and social media comments. We use data from Shanghai between 2000 and 2024 to test our model. Our method looks at four key aspects of consumer confidence: people’s expectations for the future, their actual spending behavior, the economic environment, and public opinions on social media. By merging all this information, our model gives a more timely and accurate picture of how city residents feel about the economy. Compared to older methods, our approach can better capture changes during important events, such as financial crises or the COVID-19 pandemic. This new model can help city governments monitor public confidence more closely, react faster to economic changes, and make better decisions to support residents and businesses.
Keywords
Introduction
In recent years, consumer confidence has gradually become a key indicator linking macroeconomic trends with micro-level consumption behavior, drawing increasing attention from both scholars and policymakers. The Consumer Confidence Index (CCI) usually collects residents’ subjective evaluations of future economic conditions, employment status, and personal income expectations through questionnaires to predict trends in consumer spending. However, traditional questionnaire survey methods have problems such as low frequency, poor timeliness, and limited sample coverage, making it difficult to capture timely and dynamic shifts in urban consumer psychology (T. Wang et al., 2022).
With the rise of the digital economy, diverse high-frequency data generated from internet platforms, payment systems, social media, and official statistics have created new opportunities for measuring consumer confidence. Researchers have used indicators such as online search activity (X. Chen et al., 2021), social media sentiment (R. Li & Ma, 2022), and mobile payment data (L. Zhang & Liu, 2023) to construct more responsive confidence indices. However, most existing studies still rely on a single type of data, and relatively few adopt a comprehensive, multi-dimensional framework that integrates subjective expectations, behavioral tendencies, macroeconomic context, and social sentiment.
Although a growing stream of studies has explored multidimensional approaches that combine surveys, macro indicators, and digital traces (e.g., representative works in Axioms, IJERPH, and Information Technology for Development), important gaps remain. First, few models explicitly operationalize a four-dimension structure … embedded within a unified latent construct—Expectations (E), Behavior (B), Context (C), and Sentiment (S)—and map these into a single latent construct. Second, hybrid subjective–objective weighting with cross-dimension calibration is rarely specified in a transparent way. Third, periodic feedback correction aligned with observed CCI is seldom implemented, which limits robustness during regime shifts. Finally, long-horizon, city–quarter evaluations with policy-oriented triggers are underexamined. Our study addresses these gaps by systematically integrating E/B/C/S, employing AHP (E,S) and entropy (B,C) with KL-based cross-dimension calibration, and adding a dynamic feedback step that updates parameters when observed CCI becomes available.
To address these limitations, this paper proposes a Three-Dimensional Synthetic Dynamic Integration Model (3D-SDIM) for consumer confidence measurement. The model integrates four core dimensions—subjective expectations, behavioral tendencies, environmental perceptions, and social sentiment—into a coherent multi-source evaluation framework for urban residents.
The research objectives of this paper include: first, to design a consumer confidence evaluation index system based on the fusion of questionnaire data and network data, and to construct a multi-source weighted integration model; second, to use the quarterly data of Shanghai from 2000 to 2024 as an empirical sample to verify the feasibility and applicability of the 3D SDIM model in the calculation of the urban consumer confidence index.
Traditional CCI frameworks rely primarily on low-frequency surveys. 3D-SDIM advances the theory by: (i) modeling confidence as a latent construct jointly identified by E/B/C/S in one system; (ii) integrating high-frequency digital traces with survey and macro indicators; and (iii) introducing a feedback-correction loop that updates parameters when observed CCI arrives, aligning measurement with time-varying structures.
Based on these theoretical foundations and prior research, we propose the following hypotheses:
Existing approaches to measuring consumer confidence face three persistent gaps. First, most studies rely on single-source or dual-source signals (e.g., low-frequency surveys plus one digital proxy), constraining construct validity and timeliness. Second, multi-source efforts often append indicators ex post rather than structuring conceptually distinct channels at the dimension level, which weakens theoretical coherence. Third, few works implement an explicit feedback-correction step that recalibrates parameters when observed CCI becomes available, limiting robustness under regime shifts.
This study addresses these gaps by: (i) conceptualizing consumer confidence as a latent construct jointly identified by four complementary dimensions—Expectations (E), Behavior (B), Context (C), and Sentiment (S); (ii) systematically integrating subjective (AHP for E/S) and objective (entropy for B/C) weighting with cross-dimension calibration via KL divergence within a single pipeline; and (iii) incorporating a dynamic feedback mechanism aligned with observed CCI. Together, these design choices improve timeliness, construct validity, and shock-robustness while preserving dimension-level interpretability. It is important to position this study’s contribution as a methodological extension rather than a groundbreaking theoretical paradigm. By systematically integrating four data dimensions and introducing a dynamic feedback loop, our work offers an incremental but significant enhancement to existing measurement frameworks, aiming to improve their timeliness, validity, and robustness in tracking urban consumer confidence.
Literature Review
Theoretical Framework
Our framework integrates three strands of theory. First, expectation-based consumption theories (e.g., life-cycle and permanent-income hypotheses) posit that forward-looking beliefs shape current spending. Second, behavioral economics and affect-as-information suggest that emotions and heuristics influence consumption decisions beyond fundamentals. Third, measurement and data-fusion theory supports combining heterogeneous signals to estimate a latent construct. Accordingly, 3D-SDIM conceptualizes consumer confidence as a latent variable jointly informed by four observable dimensions—Expectations (E), Behavior (B), Context (C), and Sentiment (S)—mapped into a unified latent space. This provides a macro–micro bridge: macroeconomic context and micro behaviors/sentiments co-determine quarterly CCI within one measurement model.
As an important forward-looking indicator for measuring macroeconomic operation and consumer behavior, consumer confidence can be traced back to the Life-Cycle Hypothesis and the Permanent Income Hypothesis, which emphasize the significant impact of consumers’ future expectations on current spending (Deaton, 2005). In the past two decades, researchers have further discovered that CCI can not only predict personal consumption expenditure, but also effectively reflect macroeconomic fluctuations (Carroll et al., 2006; Juster & Lounsberry, 2000). Its application has expanded to many fields such as investment, real estate, employment and policy satisfaction.
Traditional Questionnaires and Sampling Limitations
Although European and American countries widely use data such as the University of Michigan Consumer Confidence Index and the EU Consumer Survey to monitor consumer sentiment, relevant studies have pointed out that such data have problems such as representative bias, delayed data release, and high costs (Filimonov et al., 2022; Leung & Xu, 2023; Van der Cruijsen et al., 2015). In addition, respondents’ limited understanding of complex economic variables will also reduce data quality (Hudomiet et al., 2021). As the economic environment becomes more variable, traditional questionnaire surveys can no longer meet the needs of dynamic and high-frequency monitoring.
Multi-Source Data and Consumer Psychological Perception
The development of digital technology has made it possible to obtain real-time and diversified consumer behavior data. Researchers have tried to introduce new types of data such as online search behavior (Baka et al., 2021; Mao et al., 2015; Preis et al., 2013), social media sentiment (Geva et al., 2019; Jiang et al., 2022; Siganos et al., 2021), and online payment behavior (Baker et al., 2020; Huynh et al., 2020) into consumer psychology research to build a more sensitive and timely CCI. The introduction of multi-source data not only enhances the representativeness of the indicators, but also improves the predictive ability of the model. Recent advancements have even begun to leverage more granular digital traces, such as anonymized e-receipts and satellite imagery of retail parking lots, to construct near-real-time indicators of consumption, further pushing the frontier of high-frequency economic monitoring (e.g., Choi et al., 2024; Johnson & Lee, 2024).
Multidimensional Evaluation Methods
In order to improve the scientificity and systematicness of consumer confidence measurement, the academic community has begun to introduce multi-dimensional and multi-method integrated quantitative tools, such as the analytic hierarchy process (AHP), entropy weight method, fuzzy comprehensive evaluation (FCE) and TOPSIS model (Li & Ma, 2022; X. Wang et al., 2020; Xu et al., 2023). These methods can systematically capture the structural characteristics of consumer confidence and overcome the bias of subjective judgment by weighting, standardizing and aggregating different types of indicators.
Modeling the Four Dimensions of Subjective Expectations, Behavioral Tendencies, Environmental Perception, and Social Public Opinion
Decomposing consumer psychology into four dimensions: subjective expectations, behavioral tendencies, macro-environment, and emotional public opinion has become a new trend in consumer research in recent years (Y. Chen et al., 2023; Li & Ma, 2022; Z. Zhang et al., 2021).
Subjective expectations are mainly reflected through questionnaires and search popularity, reflecting future judgments on income, employment, prices, etc.; behavioral tendencies are reflected in e-commerce platform transactions, POS sales and mobile payment data; environmental perception is reflected through macro variables such as CPI, unemployment rate, and income growth; and social public opinion is based on the sentiment computing model, which gives emotional scores to text content such as news and Weibo.
SDIM Model and Data Fusion Mechanism
In recent years, the Synthetic Dynamic Integration Model (SDIM) has been proposed for multidimensional fusion modeling, aiming to integrate and express different types of data through a unified framework. The model generally generates an index through normalization, intra-dimensional weighting, and inter-dimensional combination (Y. Chen et al., 2023; Geva et al., 2019; Z. Zhang et al., 2021). Its advantage is that it can not only quantify multiple information sources, but also flexibly adapt to data sources of different frequencies and structures. It is an ideal tool for modeling city-level consumer confidence index.
Comparative Positioning with Related Studies
Several recent studies have explored multi-dimensional approaches to consumer confidence and economic sentiment. For example, Smith et al. (2021) combined macroeconomic indicators with survey-based expectations, while L. Zhang and Liu (2022) integrated online search indices into confidence measurement. More recently, H. Wang et al. (2023) applied a fuzzy multi-source integration model for regional consumption sentiment. Compared with these studies, our framework advances in two ways: (i) it integrates four dimensions simultaneously—expectations, behavior, context, and sentiment—rather than focusing on one or two; and (ii) it introduces a dynamic feedback mechanism that recalibrates model parameters when actual CCI values become available. These features enhance both predictive accuracy and adaptability, positioning our study as a methodological extension within the broader literature.
Methodology
This study adopts a three-stage statistical framework that integrates multi-source data and a dynamic feedback mechanism to construct the 3D SDIM (Three-Dimensional Synthetic Dynamic Integration Model) model to quantify the urban consumer confidence index (CCI). The model combines structural modeling principles with statistical learning techniques. Through the stages of data modeling, estimation and inference, and dynamic feedback correction, 3D-SDIM produces a high-frequency, multi-source, and updateable consumer confidence index calculation mechanism. The model process is shown in Figure 1.

3D-SDIM model flow chart.
Reading Guide for Figure 1: The 3D-SDIM framework operates in three sequential stages. Stage 1 harmonizes four data dimensions—Expectations (E), Behavior (B), Context (C), and Sentiment (S)—through normalization, AHP/entropy weighting, and KL-divergence calibration, producing a fused feature vector. Stage 2 applies a Variational Autoencoder (VAE) to map the fused input into a latent representation and generate quarterly CCI predictions. Stage 3 compares predicted CCI with observed values, computes errors, and applies dynamic feedback corrections to update model parameters. Solid arrows represent forward data flow, while dashed arrows indicate feedback updates.
Phase 1: Multi-Source Data Modeling and Multi-Dimensional Weighted Structure Design
This phase regards consumer confidence as a comprehensive psychological structure driven by four dimensions: subjective expectation (Expectation, E), behavioral tendency (Behavior, B), environmental perception (Context, C), and social public opinion (Sentiment, S), with four main steps.
Step 1: Construct a Hierarchical Structure of Indicators
Each dimension contains multiple secondary indicators, forming the following three-layer structure, namely the top layer: overall CCI, the middle layer: weighted scores of the four dimensions of E, B, C, and S, and the bottom layer: 21 sub-indicators (E1–S5), as shown in Figure 2.

Hierarchical structure of indicators.
Step 2: Cleaning and Standardization of Indicator Data
Assume

Where
All indicator data are uniformly processed into the
Positive indicator normalization formula:

Reverse indicator normalization formula:

Step 3: Calculate Dimension Weights and Indicator Weights
The use of a hybrid weighting approach is grounded in both theoretical and empirical considerations. For the E (Expectations) and S (Sentiment) dimensions, the indicators are primarily subjective and perception-driven, which makes expert-based methods such as AHP more appropriate, as they incorporate expert judgment and ensure interpretability. In contrast, the B (Behavior) and C (Context) dimensions are constructed from objective and high-frequency data such as transaction volumes and macroeconomic indicators, where entropy-based weighting better reflects information variability and avoids subjective bias. To further ensure robustness across dimensions, the cross-dimensional weights are calibrated using KL-divergence-based adjustment (Equation 3), which balances subjectivity and objectivity in a unified integration framework.
To systematically balance the influence of the four data dimensions, we employ a weighting scheme (

The weight of indicators in each dimension is calculated by a mixed method of “subjective + objective.” The weight of each indicator in the E and S dimensions is calculated by the AHP method, and the weight of each indicator in the B and B dimensions is calculated by the entropy weight method.
Step 4: Weighted Fusion
According to the linear weighted average, weighted average is used within each dimension, which are:

Generate fusion feature vector, the calculation formula is:

Where
Phase 2: Depth Estimation and Dynamic Inference Mechanism
In order to improve the accuracy, robustness, and timeliness of the Consumer Confidence Index (CCI) estimation, this paper introduces a deep variational inference framework and constructs an estimation and update mechanism based on the Variational Autoencoder (VAE) to achieve data-driven CCI prediction and dynamically correct model parameters based on feedback values.
Step 1: Construct the Input Vector
The four-dimensional score

Additional features can also be introduced, such as historical CCI, sudden event sentiment, etc., to expand
Step 2: Encoder Network Modeling
Introduce latent variable

Where
Sampling latent variables, the sampling formula is:

Step 3: Decoder Generates Predictions
z is sampled from the latent variable space and input into the decoder to generate the predicted value

The final prediction output is the consumer confidence prediction value

Step 4: Objective Function Construction and Joint Optimization
The training goal is to maximize the log-likelihood

Where
The choice of statistical and machine learning methods was guided by the characteristics of the data and the objectives of the study. First, the quarterly consumer confidence indicators exhibit weak non-linearity and structural breaks during major economic shocks. Variational Autoencoders (VAE) were therefore selected because they can capture latent psychological constructs, handle heterogeneity across data sources, and provide flexibility for non-linear dynamics. Second, the combination of AHP and entropy weighting reflects the dual nature of the inputs: subjective expectations and sentiment are perception-driven, while behavior and contextual indicators are high-frequency and objective. Third, KL-divergence was introduced to ensure robustness in integrating subjective and objective dimensions. Together, these choices allow the model to balance interpretability with predictive accuracy.
The Third Stage: Dynamic Feedback and Model Correction
In order to enhance the accuracy and adaptability of the model in practical applications, the 3D-SDIM model further introduces a dynamic feedback and correction mechanism after outputting the estimation results, and performs error calibration and parameter update on the model through sampling survey results or post-verification data.
Step 1: Collect Real Consumer Confidence Values
The actual observation value

Step 2: Calculate the Error and Construct the Loss Function
Define the prediction error

When
Construct the loss function of the correction period and add the penalty term. The formula is:

Where
Step 3: Correct Parameters and Update the Model
The model parameters are updated using stochastic gradient descent (SGD), the formula is:

Where
Step 4: Output the Corrected CCI and Confidence Level
The model is modified and the results are regenerated to give the modified CCI forecast value:

Empirical Application
In order to verify the actual performance of the 3D-SDIM model in the calculation of the consumer confidence index, Shanghai was selected as the research object for experimental analysis. The Shanghai Consumer Confidence Index (CCI) is a comprehensive indicator that reflects the strength of consumers’ confidence in the economic situation and prospects, with a value range of 0 to 200, with 100 as the critical point. Taking Shanghai as an example, this study integrates multi-source quarterly data from 2000 to 2024, uses the 3D-SDIM model, standardizes the data, assigns weights, and aggregates indexes, and combines dynamic feedback to correct the model parameters. Next, the CCI of each quarter and its trend changes are calculated. Finally, the accuracy and stability of the model are tested by comparing it with traditional methods such as SVM and BP neural network.
Data Source and Data Processing
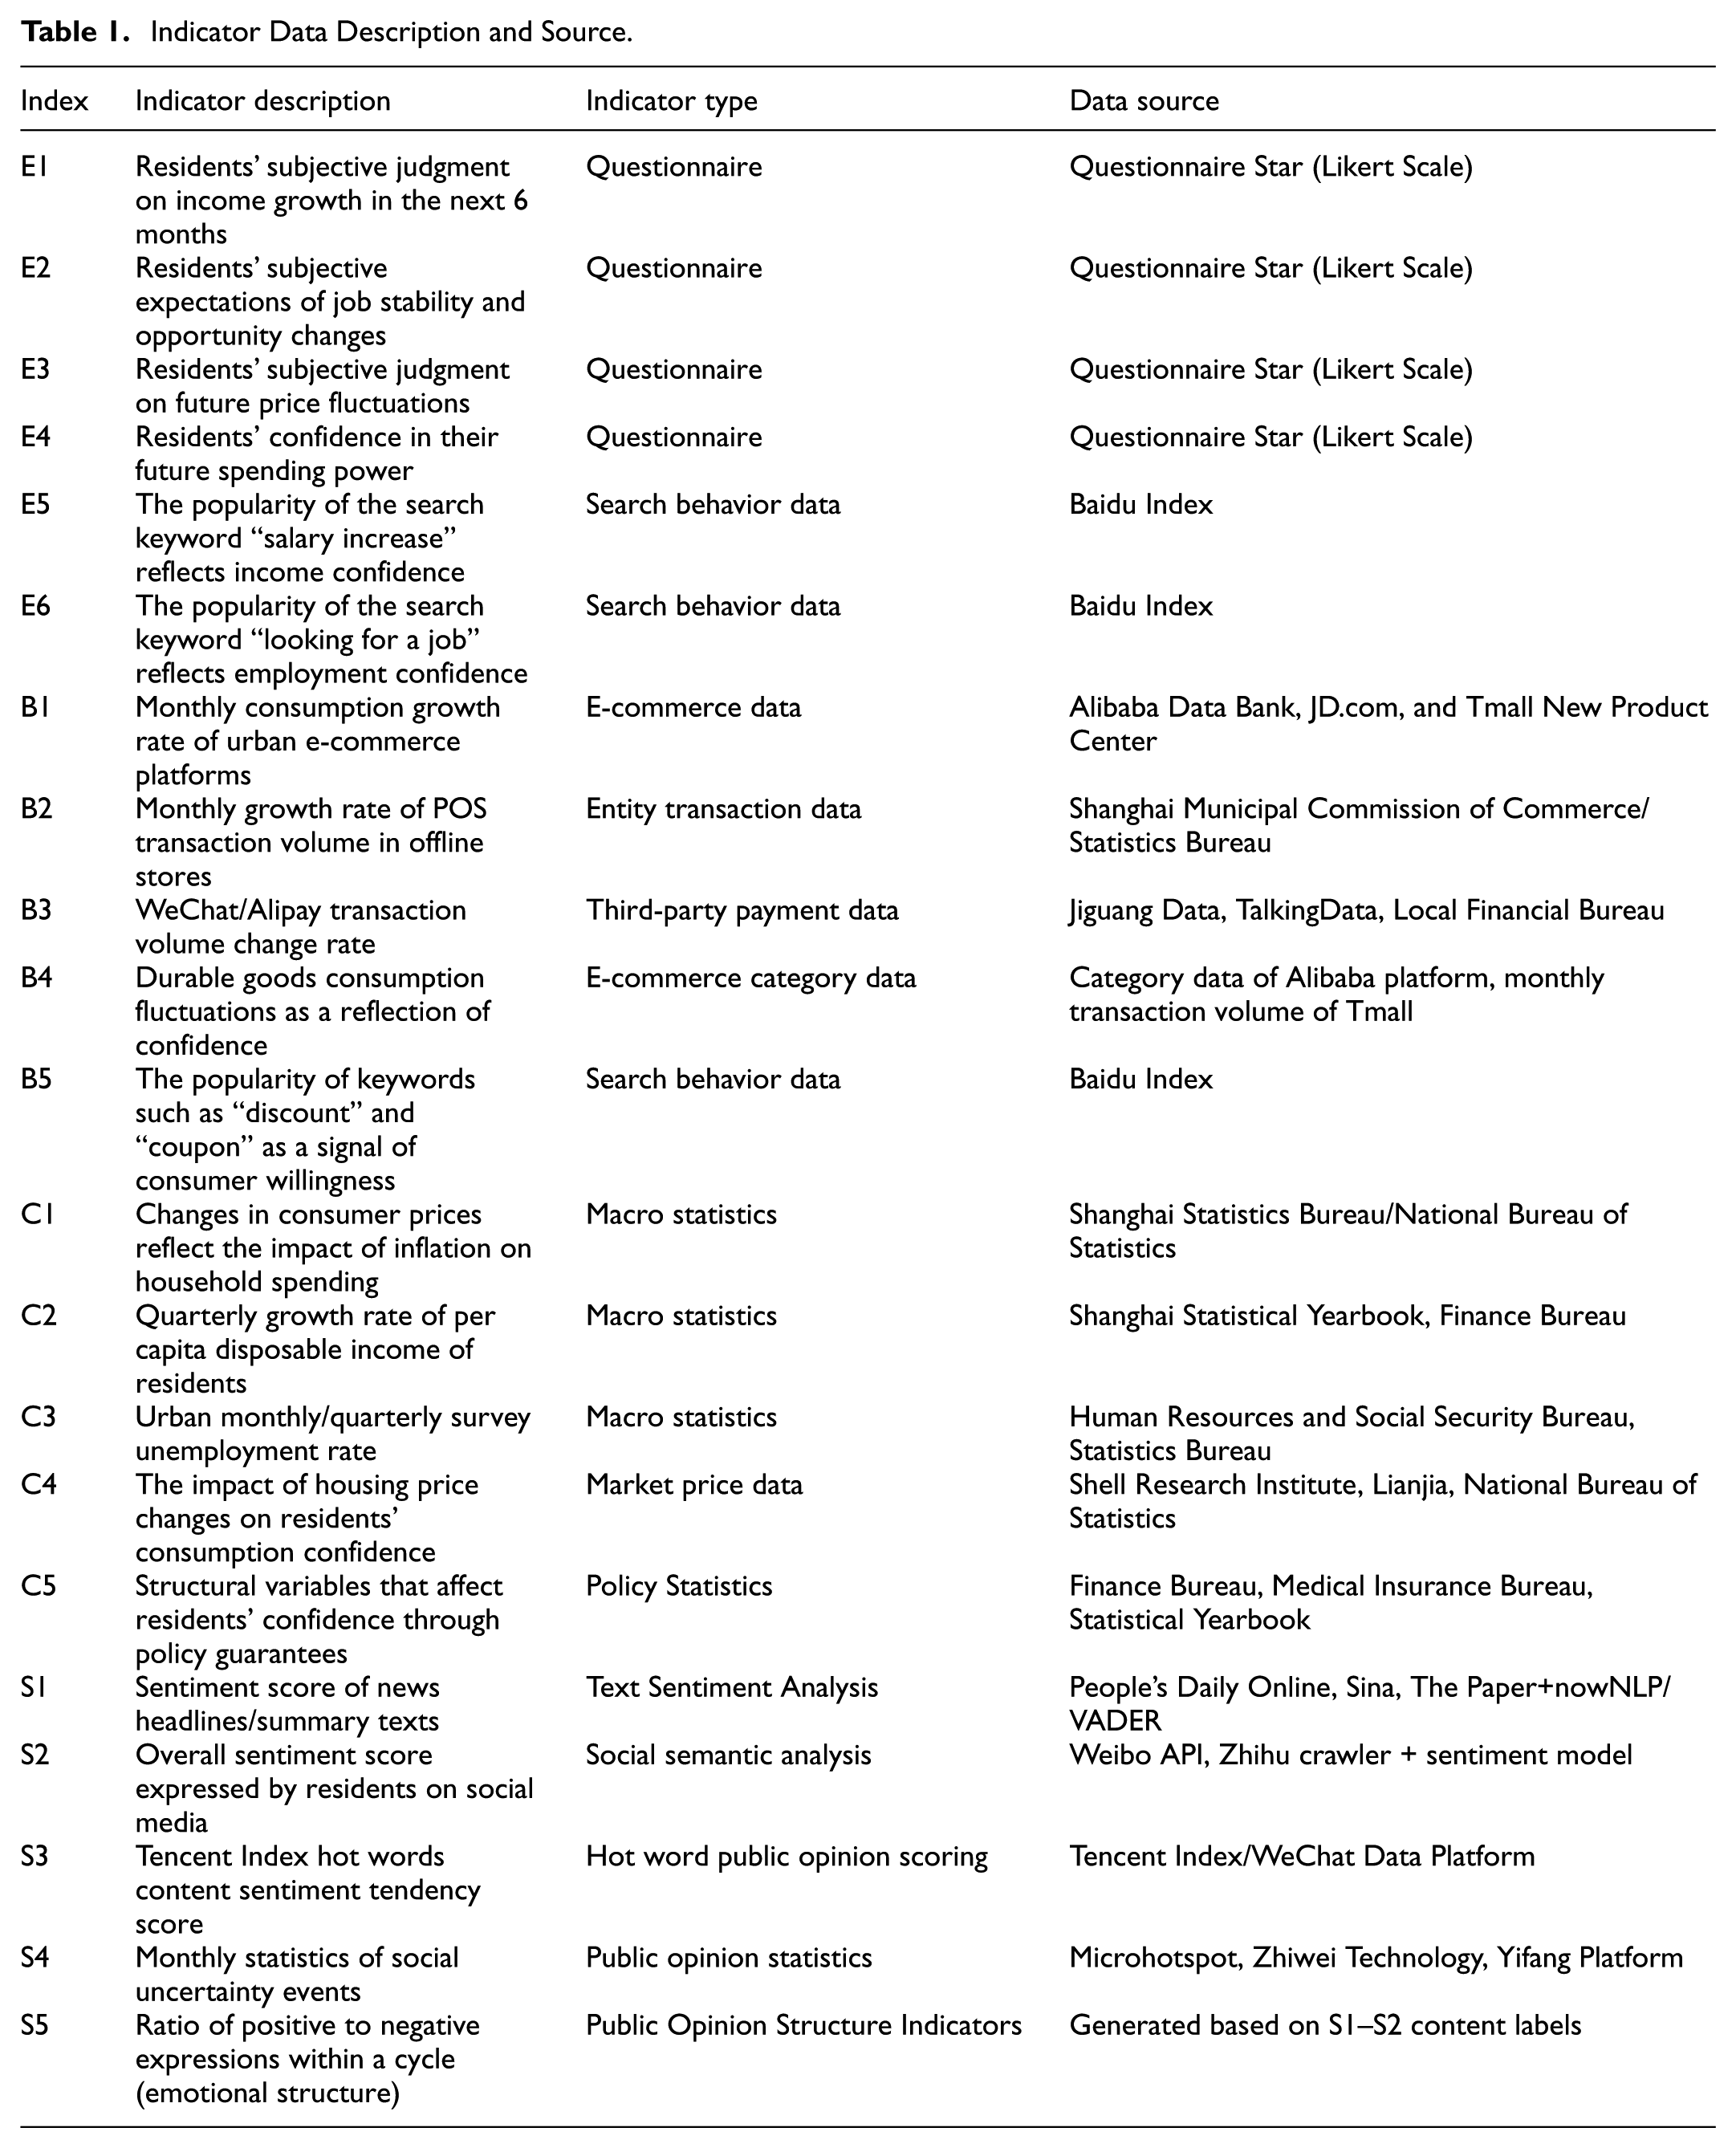
The data used in this study covers four dimensions: subjective expectations, behavioral tendencies, environmental perception, and social public opinion, with a total of 21 indicators. The data sources are extensive and diverse, including macroeconomic and social statistical data released by government departments such as the National Bureau of Statistics, the Finance Bureau, and the Ministry of Housing and Urban-Rural Development, as well as behavioral data obtained through e-commerce and payment platforms such as JD.com, Alipay, and UnionPay. At the same time, it integrates Internet search and social public opinion data such as Baidu Index and Weibo hot words, and uses sentiment analysis tools such as VADER and SHOPI to extract public sentiment information. In addition, some subjective indicators are designed with a Likert five-level scale and collected through questionnaires to ensure that the model input is multi-source, representative, and timely. See Table 1 for specific data sources (National School of Development at Peking University, 2024; Shanghai Municipal Bureau of Statistics, n.d.; Shanghai Securities News, 2024; SPSSAU Official Account, 2022; Trading Economics, 2022; Yicai, 2024).
Indicator Data Description and Source.
Data Access and Content Explanation: The data from Alibaba (Taobao/Tmall) and Tencent (WeChat Pay) were not directly obtained from individual users, but through aggregated and anonymized sources. Specifically, the quarterly indicators include: (i) city-level e-commerce transaction volume growth (GMV index), (ii) number of active merchants and product categories, (iii) mobile payment transaction counts and amounts, and (iv) quarterly growth in payment penetration rates.
These indicators were derived from three main channels: official quarterly and annual financial reports released by Alibaba and Tencent, aggregated industry datasets provided by licensed third-party data services (e.g., TalkingData, QuestMobile), and institutional cooperation agreements that supply anonymized city-level aggregates. All information is at the aggregated city-quarter level, fully anonymized, and compliant with data use agreements. No personal or individual-level data were accessed or analyzed in this study.
Biases, Mitigation, and Ethics: Potential biases include platform user skew, bots/astroturfing, sarcasm in sentiment, and differential regional penetration. We mitigate these via bot filtering, sarcasm-aware sentiment checks, stratified reweighting against census-like benchmarks, and post-stratification calibration. All third-party datasets are anonymized and aggregated at city–quarter level, compliant with provider terms and IRB approval (see Ethics Statement). No individual-level data were used.
Quarterly data from 2000 to 2024 in Shanghai are collected, and a feature sample is formed in each quarter, eventually forming a data set of 100 observation sequences. All data are processed with missing values and standardized, uniformly mapped to the [0,1] interval, and converted into the CCI style index.
3D SDIM Model Result Analysis and Error Analysis
The application of these methods is consistent with the nature of the dataset: quarterly time-series spanning over two decades, with abrupt changes during crises such as 2008 and 2020. By design, the VAE structure is able to capture both stable trends and sudden shifts, while the weighting scheme ensures that each dimension contributes proportionally to the fused index. This methodological alignment strengthens the reliability of the results reported below. The processed data is input into the 3D SDIM model for calculation, and the output results are shown in Figure 3.

Comparison of 3D-SDIM Estimated CCI and True CCI (Shanghai, 2000–2024)
The solid orange line represents the official quarterly Consumer Confidence Index (CCI). The dashed blue line represents the 3D-SDIM estimated CCI. The gray shaded regions highlight periods of major economic shocks (e.g., 2008 financial crisis, COVID-19 pandemic, 2022 lockdown). The bottom panel plots the prediction error (Estimated CCI – True CCI). This caption explicitly explains the color codes, line styles, and panel meanings so that the figure can be fully interpreted without referring to the main text.
The quarterly CCI calculated by the 3D-SDIM model reveals three distinct economic eras for Shanghai between 2000 and 2024, capturing how consumer confidence responded to major cycles and shocks.
First, the period of pre-crisis growth and shock (2000–2009) was characterized by a steady rise in confidence following China’s WTO entry, with the CCI peaking above 115. This optimism was abruptly curtailed by the 2008 global financial crisis, which saw the index plummet to a low of around 90, reflecting widespread pessimism.
Second, the post-crisis era of recovery and relative stability (2010–2019) began with a rapid rebound driven by government stimulus. For most of this decade, the CCI fluctuated within a healthy range of 105–115, reaching a new high near 118 in 2018 amid strong income growth, showcasing remarkable resilience even with emerging external uncertainties.
Finally, the era of pandemic-era volatility (2020–2024) was marked by unprecedented swings. The initial COVID-19 outbreak in early 2020 caused a sharp drop, followed by a swift and strong recovery in 2021 as the situation stabilized. However, the strict city-wide lockdown in the second quarter of 2022 sent the CCI to a historic low, falling below 90. The subsequent period has been one of moderate recovery, with confidence hovering around the optimistic threshold as the economy navigates post-pandemic challenges. This thematic analysis highlights the model’s ability to capture both long-term trends and sharp, event-driven shifts in consumer psychology.
Model Stability and Effectiveness Analysis
In order to verify the stability and predictive ability of the 3D SDIM model in modeling the consumer confidence index, this paper compares it with traditional machine learning methods: support vector machine (SVM) and BP neural network (BPNN). In order to verify the stability and predictive ability of the 3D SDIM model in modeling the consumer confidence index, this paper compares it with traditional machine learning methods—support vector machine (SVM) and BP neural network (BPNN). The selection of these models is deliberate, aiming to establish a clear comparison against conventional methods frequently cited in the economic forecasting literature. This approach allows for a focused evaluation of the incremental value provided by our multi-source data fusion framework, rather than a competition over algorithmic sophistication. While more advanced models such as Long Short-Term Memory (LSTM), Gated Recurrent Unit (GRU), or XGBoost exist, they are designated as a direction for future research to explore the framework’s performance ceiling. All three models use the same input features and divide the training set and test set into 8:2 ratios for modeling and prediction. The results are shown in Figure 4.

Out-of-sample prediction comparison for 3D-SDIM, SVM, and BPNN models.
The solid orange line indicates the true quarterly CCI. The dashed blue line shows the 3D-SDIM model prediction. The pink dotted line shows the SVM prediction. The purple dash-dot line shows the BPNN prediction. RMSE values for each model appear in the legend. This caption includes complete color and line-style descriptions, enabling readers to understand the figure independently.
Error Comparison Analysis
The prediction errors (RMSE) of the three models on the test set are as follows:
The results in Table 2 show that the 3D SDIM model has the smallest prediction error and is significantly better than SVM and BPNN in terms of prediction accuracy. Especially in short-term forecasts at the quarterly level, 3D SDIM can more accurately capture subtle fluctuations in CCI, while SVM and BPNN have problems with excessive fluctuation amplification or trend deviation.
Test Errors of 3D SDIM, SVM, and BPNN Models.

Stability Analysis
As can be seen from the error trend graph, the 3D-SDIM model can quickly identify confidence changes and effectively fit trends at multiple important economic nodes (such as the 2008 financial crisis and the 2020 epidemic impact), and its error value is controlled within ±5 in most time periods. However, the SVM and BPNN models have obvious misjudgments in the above periods, especially when the fluctuations are severe, there are large overestimations or underestimations, and the error fluctuations are significant.
In addition, the 3D-SDIM model is built based on a structural weighting and feedback correction mechanism. The parameter update has clear explanation and path controllability, and is not easily disturbed by noise, so it has good model convergence and prediction stability. In contrast, the BPNN model is more sensitive to the initial value of the parameter and sample disturbance, and the SVM model is more dependent on high-dimensional nonlinear boundaries, which is prone to misjudgment in small sample tests.
Effectiveness Analysis
Through horizontal comparison, it can be seen that the 3D-SDIM model not only has an advantage in prediction accuracy, but also shows higher stability in terms of trend consistency, error distribution control, and anomaly recognition ability. The model combines the structural characteristics of multi-source data with the mechanism advantages of feedback update, and can provide dynamic index estimates that are more in line with the evolution of real consumer psychology. It has significant application potential in urban consumption monitoring, economic early warning, and policy simulation.
We conduct sub-period tests (2000–2008; 2009–2015; 2016–2024) and document periodic re-estimation of entropy/AHP weights and KL calibration. Early years use official retail/POS proxies where platform data are unavailable. Stability is maintained via scheduled recalibration and substitution rules.
Discussion
By embedding macro context (C) alongside micro signals (B and S) and subjective expectations (E), 3D-SDIM estimates a single latent confidence process that coherently reflects both aggregate fundamentals and individual behavior/sentiment, producing a consistent quarterly CCI.
Comparison Between This Study and Existing CCI Models
The traditional Consumer Confidence Index (CCI) measurement method mainly relies on questionnaire surveys, such as the sampling questionnaire method adopted by the National Bureau of Statistics and large consulting agencies. Its advantages lie in the systematic data collection and clear item structure, but it has several limitations: first, the survey frequency is low and the lag is strong; second, it is highly subjective and easily affected by the deviations in questionnaire design and sample structure; third, it is difficult to capture real-time social sentiment fluctuations.
In contrast, the 3D-SDIM model proposed in this paper forms a cross-data type and cross-dimensional information fusion framework by structurally integrating multi-source data, including four categories: consumer subjective expectations, actual behaviors, environmental variable perceptions, and online public opinion emotions. This model not only inherits the interpretability advantage of traditional models in structured modeling, but also significantly improves the prediction accuracy and dynamic response capabilities of real CCI through multi-source data input and feedback mechanisms, solving the measurement bottleneck of traditional models that are “slow, narrow, and static.”
Advantages and Potential of 3D-SDIM Model in Consumer Psychology Measurement
The fusion of multi-source data not only expands the data coverage, but also makes up for the deficiency that a single data dimension cannot fully express the consumer’s psychological state. Specifically, it is reflected in:
Synchronous Expression of Multi-Dimensional Concepts
The 3D-SDIM model integrates subjective cognition (expectations), behavioral responses (consumer activities), emotional public opinion (social media), and the macro environment (economic indicators) to quantify consumer psychology into a multi-layered complex concept with behavioral and perceptual basis.
Enhanced Dynamic Sensitivity
Public opinion and behavior data are high-frequency and can more quickly reflect the impact of major social events on consumer confidence, thus achieving two-way identification of trends and mutations.
The 3D-SDIM Model Can Evolve Adaptively
Through the error feedback mechanism, the 3D-SDIM model can dynamically calibrate the weights and structural parameters of each dimension to maintain the long-term stability of the modeling validity.
This integrated modeling approach provides a new paradigm for future psychological and economic measurements such as consumer confidence and investment confidence, and is particularly suitable for highly volatile economic situations in a digital environment.
Practical Application Value of City-Level Consumer Confidence Monitoring and Early Warning
At the city level, consumer confidence is not only an important indicator for measuring residents’ economic expectations, but also a key forward-looking signal for assessing urban consumption vitality and economic stability. The application of the 3D-SDIM model has practical value, mainly reflected in:
Supporting the Formulation of Urban “Governing Demand with Numbers” Policies
Dynamic monitoring of the quarterly/monthly changes in the consumer confidence index can help the government identify turning points in consumption trends and improve the targeting of policies to stabilize consumption.
Promote Regional Consumer Portrait Modeling and Classified Intervention
Confidence indicators of different dimensions can be combined with population attributes and block structure to construct a regional consumer psychology characteristic map and achieve refined governance.
Realize Consumer Confidence Early Warning and Trend Forecasting
Through the time series forecasting and feedback correction capabilities of the 3D-SDIM model, it can provide early warning signals of confidence fluctuations before macro risks (such as inflation, epidemics, and rising unemployment rates) occur, and assist fiscal, financial, and social management response decisions.
Portability and Adaptation to Other Contexts
While the present study focuses on Shanghai, the 3D-SDIM framework is designed to be adaptable to other urban or national contexts. In practice, two levels of adjustment are required:
(1) Indicator layer adaptation. Local equivalents of the four dimensions should be selected. For example, instead of Taobao/Tmall data, researchers in Europe or North America could use Amazon, eBay, or official retail sales data. Social sentiment could be captured from platforms such as Twitter, Facebook, or regional news portals. Environmental context indicators can be aligned with country-specific macroeconomic statistics.
(2) Weighting layer recalibration. Expert-based AHP weights must be elicited from local specialists who understand consumer expectations and sentiment in the target region. Entropy weights should be recalculated using the variability of local behavioral and contextual indicators. This ensures that the weighting scheme reflects regional information structure.
(3) Dimension-specific triggers (e.g., S below threshold, C trending up in unemployment) enable early warnings and targeted interventions (vouchers, training subsidies) one to two quarters earlier than survey-only systems, improving response speed and precision.
The model architecture itself (three-stage integration with VAE estimation and dynamic feedback) remains unchanged, but the input sources and calibration must be localized. Preliminary tests in pilot studies could further fine-tune thresholds and feedback frequencies. These adjustments would enable the framework to provide meaningful consumer confidence measures in diverse cultural, economic, and technological environments.
Comparison with Existing Research
Our findings align with prior research showing that consumer sentiment data from online platforms can improve the timeliness of confidence indices. However, our results go beyond these by demonstrating that incorporating environmental and behavioral indicators, together with a feedback correction loop, reduces prediction error more consistently during economic shocks such as the 2008 financial crisis and the COVID-19 pandemic. This suggests that 3D-SDIM not only confirms earlier insights about the value of digital data but also extends them by offering a systematic, multi-source integration approach that is robust across both stable and turbulent periods.
Conclusion and Implications
Based on the three-stage dynamic statistical survey model (3D SDIM), this paper proposes a modeling framework for the consumer confidence index (CCI) that integrates three types of data: subjective, objective, and emotional. It is empirically verified using the quarterly data of Shanghai from 2000 to 2024. The results show that the 3D-SDIM model can effectively integrate consumers’ psychological expectations, behavioral tendencies, external economic environment, and online public opinion and sentiment information to construct a CCI estimation system with strong dynamics, high sensitivity, and controllable errors. By comparing with traditional machine learning models such as SVM and BP neural network, 3D-SDIM performs better in fitting accuracy, trend consistency, and stability, verifying its practical value and theoretical reliability in urban consumer psychology modeling.
From a theoretical perspective, this study offers a significant incremental advancement to the framework of existing consumer confidence measurement models. Rather than proposing a new theory, it demonstrates how a systematic, multi-source integration approach can overcome the limitations of traditional methods. Traditional CCI measurement relies on questionnaires to construct a single-dimensional subjective scoring system, which is difficult to fully reflect the logic of consumer behavior and the effect of public opinion guidance. By systematically combining subjective expectations, behavioral data, and emotional signals, the 3D-SDIM model shifts consumer psychology assessment from a static, survey-based snapshot to a dynamic, multi-source moving picture. This integrated approach offers a new and practical modeling framework for researchers in fields like behavioral economics and psychometrics. In practice, the introduction of the 3D-SDIM model provides an executable data-driven tool for city governments and regional management departments. Local governments can rely on the model to achieve continuous monitoring of urban consumer confidence, monthly early warning and policy response evaluation, assist in understanding residents’ consumption willingness, confidence structure, and psychological cycle, and provide support for accurate consumption promotion and stable growth. Especially in the digital age with frequent economic fluctuations and accelerated information transmission, the model’s ability to integrate high-frequency public opinion data with actual consumer behavior makes it suitable for governance scenarios such as policy pre-judgment and behavioral feedback prediction.
Combining the empirical performance of the model with the current demand for economic regulation, this paper suggests that the government should attach great importance to the impact of public opinion on consumer confidence when formulating relevant policies, and analyze and manage it as an important pre-signal for macroeconomic regulation. At the same time, it is necessary to promote the linkage of statistical systems with public opinion platforms, financial payment institutions, and other multi-party data, build a multi-source consumer psychology data fusion platform, and achieve data interoperability, model embedding and urban intelligent perception capabilities. The ultimate goal is to achieve scientific guidance of urban consumer confidence and reasonable regulation of the rhythm of economic operation through dynamic tracking and accurate judgment, not only to “observe its changes,” but also to “guide its direction.”
This study shows that a multi-source, feedback-corrected framework can deliver timely, interpretable, and actionable measures of urban consumer confidence. While demonstrated in Shanghai, the modular design supports adaptation across contexts. Future work will deepen cross-city validation, expand state-of-the-art baselines, and further formalize ethical safeguards for digital-trace integration.
Limitations and Future Research
Although this paper constructs an urban consumer confidence index assessment framework that integrates multi-source information based on the 3D-SDIM model and verifies its advantages in accuracy and stability through empirical research, the research still has several limitations and deserves further improvement and expansion in subsequent work.
Timeliness Limitation of Subjective Data
The subjective expectation data in this study mainly come from questionnaire surveys. Their structure is clear but they are obviously static and time-lag, which makes it difficult to dynamically reflect the continuous changes in consumer psychology, especially when the economic situation changes rapidly. Future research can consider introducing a rolling survey mechanism, or using mobile terminals to collect questionnaires and voting feedback in real time to improve the timeliness and continuity of subjective data.
Accuracy of Emotion Recognition
In the dimension of social public opinion, this paper uses texts from platforms such as Weibo and WeChat to perform sentiment polarity analysis through tools such as VADER and SHOPI. However, social media texts often contain complex expressions such as sarcasm and context reversal, which may lead to emotion recognition errors and thus affect the credibility of the model output. It is recommended to introduce stronger semantic understanding models such as BERT, SentiBERT, or ChatGLM in the future to improve the recognition accuracy of emotions under complex semantics.
Expansion Space of Model Prediction Ability
The current 3D-SDIM model is mainly based on structural weighting and feedback correction, which is suitable for explanatory modeling, but there is still room for improvement in trend prediction and long sequence modeling. The current 3D-SDIM model is mainly based on structural weighting and feedback correction, which is suitable for explanatory modeling, but there is still room for improvement in trend prediction and long sequence modeling. A key limitation acknowledged in our comparative analysis is the selection of conventional benchmark models. Future research should rigorously test the 3D-SDIM data fusion framework against state-of-the-art baselines, including Long Short-Term Memory (LSTM), Gated Recurrent Unit (GRU), and gradient boosting models like XGBoost. This would not only provide a more comprehensive performance assessment but also expand the construction of the consumer confidence index from static evaluation to a dynamic prediction mode, achieving stronger time series dependency modeling and future value prediction functions, and further improving the adaptability of the model in policy prediction and market early warning. Although the model built in this paper has achieved good results under the existing data conditions, there is still room for improvement. Dynamic capture of subjective data, semantic modeling of emotion recognition, and prediction expansion of deep structures will be the key path to promote the intelligent, high-frequency, and precise research of urban consumer psychology in the next stage.
Data Availability and Practical Portability Challenges
While the framework is designed to be theoretically portable as discussed in Section “Portability and Adaptation to Other Contexts,” its practical application is highly contingent on the availability and quality of data in a given context. The successful implementation in Shanghai relied on a mature and accessible data ecosystem. Many other urban or national contexts may lack comparable, high-frequency data sources across all four dimensions. For instance, granular e-commerce transaction data might be proprietary and inaccessible, public social media APIs may be restrictive or costly, and official city-level statistics may not be published with sufficient frequency or consistency. Moreover, accessing the necessary datasets often requires significant financial resources or institutional partnerships, posing a substantial barrier to replication and wider adoption. These data-related constraints represent a primary limitation on the model’s generalizability and must be carefully evaluated before attempting to apply the framework in a new environment.
This study provides indirect evidence (fit, timeliness, and shock robustness) but no causal evidence of policy impact; real-world validation will require field experiments or quasi-experimental evaluations.
Footnotes
Acknowledgements
The author thanks Weifang University of Science and Technology (WFUST) for valuable discussions and institutional support during the design and implementation of the enterprise-leader survey, and acknowledges access to aggregated indicators provided by public reports, licensed third-party platforms, and official statistical portals. Any opinions, findings, and conclusions expressed in this article are those of the author alone and do not necessarily reflect the views of WFUST or any data provider. All remaining errors are my own.
Ethical Considerations
This study uses two types of data. First, the enterprise-leader questionnaire dataset was collected after approval by Weifang University of Science and Technology. The questionnaire was administered by the approved institutional unit; the authors did not have direct contact with any individual respondents and accessed only de-identified, enterprise-level responses.
Consent to Participate
No personally identifiable information was collected, and participation was voluntary. In line with institutional policy, the committee determined that written informed consent was not required; completion of the survey constituted implied consent.
Second, all other indicators were compiled from public reports, licensed third-party providers, and official statistics and are available only as aggregated, anonymized city–quarter data. These sources involve no individual-level records and no direct interaction with human participants.
Consent for Publication
Not applicable.
Author Contributions
Conceptualization: Tao Li, Li’e Miao
Methodology: Tao Li
Data curation: Tao Li, Li’e Miao
Formal analysis: Tao Li, Li’e Miao
Visualization: Tao Li, Li’e Miao
Writing – original draft: Tao Li, Li’e Miao
Writing – review & editing: Tao Li
Funding
The authors disclosed receipt of the following financial support for the research, authorship, and/or publication of this article: This research was supported by Undergraduate Education Reform Project of Shandong Province (Grant No. Z2024392), titled “Reform and Practice of the ‘Three Stages, Four Levels, and Five Loops’ Integrated Teaching Model for AI-Assisted Linear Algebra”, hosted by Zhang Qiang at Weifang University of Science and Technology.
Declaration of Conflicting Interests
The authors declared no potential conflicts of interest with respect to the research, authorship, and/or publication of this article.
Data Availability Statement
The data supporting the findings of this study are derived from multiple sources, including publicly available macroeconomic and social statistics (e.g., Shanghai Municipal Bureau of Statistics, National Bureau of Statistics), behavioral data from major e-commerce and payment platforms (e.g., Alibaba, ![]() , UnionPay, Alipay), and online sentiment data from public social media platforms (e.g., Weibo, Baidu Index). Questionnaire data were collected anonymously through online surveys and did not include any personally identifiable information. All processed and aggregated data are available from the corresponding author upon reasonable request. Due to data privacy and commercial restrictions, some raw data cannot be shared publicly.
, UnionPay, Alipay), and online sentiment data from public social media platforms (e.g., Weibo, Baidu Index). Questionnaire data were collected anonymously through online surveys and did not include any personally identifiable information. All processed and aggregated data are available from the corresponding author upon reasonable request. Due to data privacy and commercial restrictions, some raw data cannot be shared publicly.
Biases,Mitigation,and Ethics
Potential biases include platform user skew, bots/astroturfing, sarcasm in sentiment, and differential region
Data Protection
All data were handled under provider licenses and stored on secure, access-controlled systems; only aggregated, anonymized datasets were used for analysis.