
Abstract
By using machine learning technique, this article presents sentiment and concept analyses on 48,043 articles published in The Economist from 1991 through 2016. The Economist is one of the world’s most influential political and economic magazines. The article analyzes and compares the magazine’s sentiment orientations toward the Group of Seven’s ingroup member countries (Canada, France, Germany, Italy, Japan, the United Kingdom, and the United States) and its outgroup member country China. The sentiment analyses are performed on and compared between different periods of Clinton’s, Bush’s, and Obama’s administrations in the United States; Major’s, Blair’s, Brown’s, and Cameron’s cabinets in the United Kingdom; and Kohl’s, Schröder’s, and Merkel’s in Germany. The relationship between China hosting the Olympic Games or its growing economic power and the magazine’s sentiment orientations toward the country is examined. The concept analysis on the articles with extreme positivity or negativity shows that there is no difference between the ingroup and outgroup members in the topics covered in The Economist.
Introduction
Sentiment, like human attitude or opinion, exists in discourse or texts (B. Liu, 2015; B. Liu et al., 2005). Van Dijk (2013) states that it is by text that people acquire, spread, and reproduce ideology, and texts can typically represent “our” positive properties and “their” negative properties. The polarized dichotomy of “our” versus “their” or ingroup versus outgroup exists not only in words but also in syntax of texts.
Van Dijk (1988, 2000, 2008, 2009) has presented some earlier studies of ideology in the media text. He emphasizes that social group members hold and share some basic belief or ideology about what is positive or negative, or what is right or wrong (Van Dijk, 2005). Language selection and use in texts carry ideological meanings (Fairclough, 1992, 1995, 1999; Fowler, 1991; Trew, 1979). Linguistic processes are associated with ideological processes (Van Dijk, 2013). In summarizing ideology, Van Dijk (2005) emphasizes that ideological differences should not be detected in how people say something, but be found in what are “our” emphasized good things and deemphasized bad things and what are “their” deemphasized good things and emphasized bad things in texts.
But other researchers demonstrate that the media content is predominantly negative and negative tone in news is pervasive all over the world, regardless of different cultures, geographical regions, social systems, or ideologies that the media belongs to, such as those of the United States, Russia, China, New Zealand, India, Brazil, France, Japan, the United Kingdom, Sweden, Chile, Canada, Ghana, Senegal, Denmark, or Israel (Soroka et al., 2019). There is a general and clear negativity bias in news in Canada, Sweden, and the United States, though there are differences in individuals’ responsiveness to it (Bachleda et al., 2019). The media covers negative contents about governments or political figures much more than positive ones in the United States, no matter the leaders are from Democratic Party or Republican Party (Niven, 2001).
According to the results of a survey on individuals’ attitudes toward issues in society, most people from the different cultures of the world are pessimistic (Ipsos MORI’s Survey, 2017). Another survey data indicate that the people in Europe tend to take more positive views of life of foreign citizens and believe that life in foreign countries is happier (Economist, 2016). The media has a general tendency to cover or highlight more “problems” or negative news rather than positive contents (Fridkin & Kenney, 2004; Soroka et al., 2018). On the basis of crowd coding for measurement and validation of sentiment analysis (SA), Haselmayer and Jenny (2017) find that the media coverage of all the parliamentary parties and their political candidates is negative and such negativity is distinct whenever a politician is mentioned in the media. There are no differences between “us” (ingroup) and “them” (outgroup) in coverage of good news or bad news, but there are significant differences between negative news and positive news in amount of coverage because psychologically, negative contents cause comparatively violent and more sustained reactions (Keene et al., 2017; V. H. Nguyen & Claus, 2013).
Dijk’s research conclusions present marked differences from those reached in recent years as shown above. One may be confused by such apparent discrepancies. The media is a very powerful communication tool to convey message to the public, it plays a key role in shaping or changing an individual’s understandings of and attitudes toward people and the world. Its sentiment orientations psychologically influence people’s feelings, behavior, and perspectives on various issues, such as political, economic, social, or ethnic ones. It is, therefore, crucial to analyze and clarify the meanings, purposes, or sentiments the media has in its messages.
It has drawn growing interest in industry, business, and the scientific community to use SA to capture and understand the sentiments of the public about political and marketing campaigns, political leaders, social events, critic reviews, products, service, and government responses to disasters or emergencies (B. Liu, 2015; Mandel et al., 2012; Na et al., 2010; Pang & Lee, 2008). In the past decade, SA has been pervasively used in a variety of social sciences, including politics and the media (Ceron, 2015; Driscoll, 2015; Murthy, 2015; Papacharissi, 2016; Schwartz & Ungar, 2015; Von Nordheim et al., 2018; Wojcieszak & Azrout, 2016).
SA has been used for analyzing the relationship between the sentiments toward a travel destination that are expressed in social media and the actual tourist arrivals of the destination (Starosta, Budz, & Krutwig, 2019). Using SA, researchers present an interesting quantitative analysis on the differences and similarities in the perceptions of popular tourist destinations between the English and German media (Starosta, Onete, et al., 2019).
Cambria (2016) divides current approaches to SA into three categories: knowledge-based techniques, statistical methods, and hybrid approaches. Knowledge-based methods depend on searching and recognizing unambiguous affect lexicons or expressions in texts to determine their positive or negative polarities. The dictionaries that contain affect words are used for sentiment detection. Statistical methods classify texts into different polarities by machine learning a large amount of training data of emotively annotated texts. The learning algorithm learns not only features of affect words but also word co-occurrence frequencies. Hybrid approaches use knowledge-based and statistical methods to detect sentiment polarity from texts. No matter what approaches are employed, the basic aims in SA are to study subjectivity and objectivity, differentiate opinions from facts, and analyze people’s sentiments or attitudes expressed in written texts (B. Liu, 2015).
Traditionally, two machine learning algorithms have been used for SA (Ain et al., 2017). One is feature-based technique that consists of parts of speech, n-grams, or bag-of-words, including Naive Bayes, maximum entropy, or support vector machines (SVMs). The second is corpus-based algorithm that uses decision trees for sentiment classification, such as k-nearest neighbors, conditional random field, hidden Markov model, or sequential minimal optimization. It is reported that comparatively, SVM classifiers have better performance in the traditional SA algorithms (Pradhan et al., 2016; Xia et al., 2011).
Compared with the traditional machine learning algorithms, new types of machine learning for SA that are based on neural networks have been tested and reported, such as those based on convolutional neural network (Akhtar et al., 2016; Rani & Kumar, 2019), long short-term memory (LSTM) networks (D. Nguyen et al., 2017; Xu, Chen et al., 2016), attention mechanism (Baziotis et al., 2017; W. Wang et al., 2018), disconnected recurrent neural networks (B. Wang, 2018), or ensemble SA models that combine several similar neural networks (Xu, Liang et al., 2016). Word embeddings are being used for word representations. More semantics can be captured by using Word2Vec, Glove embeddings, and one-hot character vectors (Pham & Le, 2018).
Among the three levels of SA—document, sentence, and aspect—aspect-based SA (AbSA) is currently gaining much more attention because an aspect goes beyond simple judgment; studies thoughts, perspectives, or social influence on an event; and offers an excellent opportunity for SA over time across different contents on media (Nazir et al., 2020; J. Wang et al., 2015). Aspect representation and extraction in SA have achieved remarkable performance by using attention and neural memory mechanism (He et al., 2017; X. Liu et al., 2020). Using LSTM, researchers have extracted aspect and sentiment words in a multitask system (Li & Lam, 2017). It is reported that in aspect extraction for SA of social media text, convolutional neural network is more effective than recurrent neural network (Schmitt et al., 2018). Different from the previous sentimental lexicons used for SA, new lexicons based on context-dependent part-of-speech (POS) chunks have been successfully constructed and the algorithm using the lexicons achieves better sentiment classifications, which determines the sentiment of a word by taking into account the POS of its previous words and following words (Yin et al., 2020). The knowledge-based method using models of preferences and topics has shown a remarkable improvement in word sense disambiguation for SA (Choi et al., 2017).
SA focuses on polarity detection in natural language processing (NLP), text analysis, or computational linguistics (Daily et al., 2017). The subtask of polarity detection is affective computing or emotion recognition that focuses on extracting a set of emotion labels from physiological signals, such as facial expression, posture, gesture, skin temperature, or hand tension (Cambria, 2016). For example, researchers have used new methods of dynamical graph convolutional neural networks for electroencephalogram (EEG) emotion recognition (Song et al., 2018). The first database has been built to connect personality traits and emotions through physiological information of EEG, electrocardiogram (ECG), galvanic skin response (GSR), or facial activity data (Subramanian et al., 2016). Using ECG and least squares support vector machine (LS-SVM) recognizers, researchers have detected human emotion in listening music (Hsu et al., 2020). New methods of combined analyses of paralinguistic, head pose, and eye gaze have been used to detect human depression (Alghowinem et al., 2016). The trend of affective computing is changing from unimodal analysis to multimodal fusion, including not only the analyses of audio signals but also those of visual, textual, or body signals (Poria et al., 2017).
SA includes three central components: sentiment (positive or negative), sentiment holder, and sentiment target (Jurafsky, 2015). Sentiment target is an entity or person that receives sentiment (Jurafsky, 2015; B. Liu, 2015). In history, whether in wartime or peace time, there are groups that connect states, parties, persons, or entities to achieve common goals. Groups can be political, social, military, commercial, or technological like the Allies and the Axis in World War II, the Eastern Bloc, the European Union, the North Atlantic Treaty Organization, or World Trade Organization. Ingroup member nations will mutually share more benefits than outgroup countries. Both ingroup members and outgroup members can be seen as sentiment targets.
The Group of Seven (G7) is a group of the world’s most developed economies consisting of the United States, the United Kingdom, Canada (CAN), France (FR), Germany (GER), Italy (ITA), and Japan (JP). The G7 member countries constitute more than 46% of the world’s global gross domestic product (GDP; nominal values; Sullivan, 2018) and can be called the rich man’s club. The group was formed in 1975, and the political leaders of the G7 member states annually have meetings discussing the solutions to the issues or problems in the ingroup members and the world.
The Economist (TE) is a magazine of news and opinion, providing coverage of international news, focusing on international political events and the world’s economy. It is used for SA in this work for these reasons: (a) It is one of the influential magazines with wide-ranging topics covering the stories of all countries, with a large print and digital circulation of 1.4 million all over the world (Audit Bureau of Circulations Report, 2018). Standage (2016), the deputy editor of TE, states that all the U.S. presidents since John F. Kennedy, Bill Gates, Angela Merkel, and other powerful Chief Executive Officers read or listen to its paper or audio edition. (b) One of the magazine’s characteristics is that TE’s writers are anonymous. According to its Editor’s note (2013), TE’s anonymity has its tradition and the major reason is that they hold a long-standing belief that “what is written is more important than who writes it” and TE speaks with “a collective voice.” Such “collective voice” may serve as a significant indicator for detecting TE’s unified and unambiguous attitudes or ideologies. (c) TE has historically continuous and clear geography-based columns or sections that report stories about the corresponding countries or continents. Such section structure or layout helps identify, classify, and perform SA and ideology analysis on the articles about different countries. (d) Our institution can access to the digital resource of TE.
This work intends to present a historical and quantitative SA on some countries in TE over a long period of time. To observe possible differences between the G7 ingroup members and between the ingroup and outgroup members in sentiment orientations in TE, we include China, an outgroup member of the G7, into our country list for comparison. The sentiment target countries in this study are the G7 ingroup members and China. We try to address specifically these questions:
What is TE’s overall sentiment score based on SA on the articles about the eight countries (the G7’s member countries and China) over a long period of time? What are the differences between the G7’s ingroup and outgroup member countries in the sentiment orientations?
What are the differences in the sentiment scores between different political leaders that take office during different periods of time?
In the case of China’s economic rise, does the change in China’s economic strength lead to a shift in TE’s ideology toward this country or a change in TE’s sentiment orientations toward the country? Does China hosting the Olympic Games change TE’s sentiment orientations toward the host?
What are the topics or concepts that exhibit the G7’s ingroup and outgroup members’ positive polarity and negative polarity?
Data and Methods
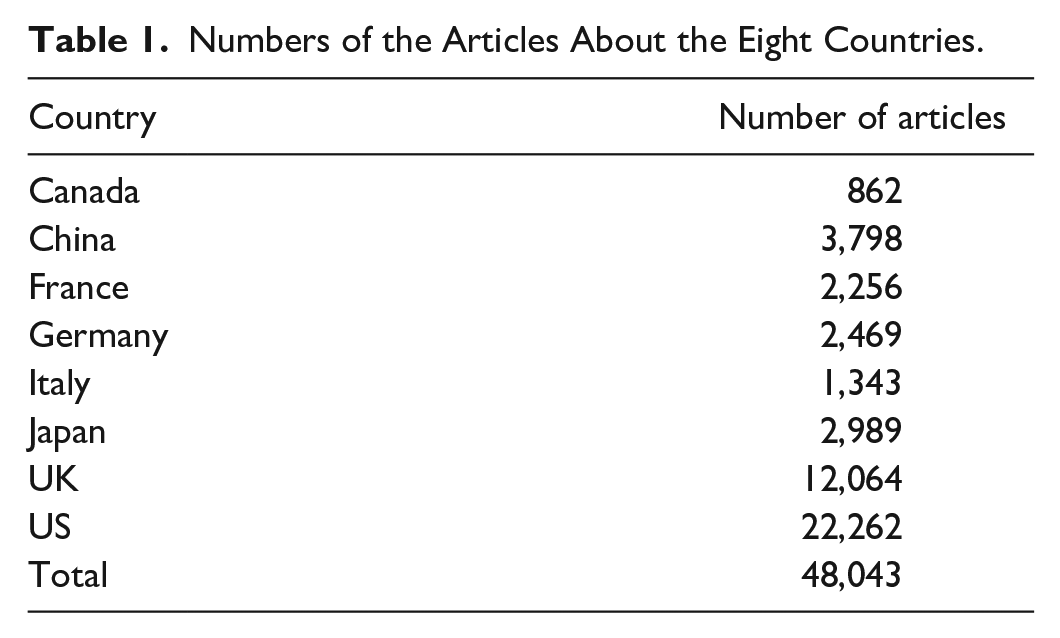
The data for SA should be machine-readable texts that can facilitate large-scale text parsing by NLP tools. Although the publishing company Gale provides TE Historical Archive covering a long TE publication history, each TE page in this Archive is displayed in image format. It would be a very difficult task to recognize and convert accurately the printed TE images of the archive into texts, considering that the data for this analysis are large and each image has several columns with different structures and embedded pictures. We used the database Proquest Business Premium Collection (2018) for data collection. This database records the texts of TE starting from 1991. For each licensed request, users are allowed to download a maximal number of 100 articles. We manually downloaded all available TE articles about the eight countries from 1991 through 2016 by filtering geography and publication date information provided at the database website. We built a program to remove all Proquest copyright texts, specifications, and internet links embedded in all downloaded documents and kept “clean” TE texts. The downloaded documents were divided into eight data sets, and all the articles’ filenames in one data set were changed to the articles’ publication years. The numbers of the downloaded articles about these eight countries are as follows (Table 1):
Numbers of the Articles About the Eight Countries.
Currently, SA research and development is very active and extensive. There are quite a number of available SA tools. For example, at the largest repository of web APIs, ProgrammableWeb (https://www.programmableweb.com), there are more than 200 sentiment APIs published by the world’s large corporations in 2018, including those by the internet giants such as Google, Microsoft, and IBM. The data scientists at KDnuggets focused on big data have tested and compared nine API capabilities that contain SA and entity recognition. The nine APIs include Amazon Comprehend/Translate, IBM Watson Natural Language Understanding (Watson NLU)/Translator, Microsoft Azure Text analytics/Linguistic Analysis/Translator Text, and Google Cloud Natural Language/Translate (ActiveWizards, 2018). Their test conclusion is that the SA from Watson NLU is “perfect” and “very fast” in terms of “results quality” and “speed.”
B. Liu (2015) emphasizes that SA is actually a study field of classification and the classes in SA are those of sentiment polarities or orientations. The evaluation measures like precision and recall in classification and information retrieval can be used for testing the performance of SA. To evaluate the SA quality of Watson NLU, the sentiment test data were used from the Center for Machine Learning and Intelligent Systems (CMLIS) at the University of California (Kotzias et al., 2015), NLP at Cornell University (Pang et al., 2002), and TripAdvisor data (Roshchina et al., 2015). The requests were sent to Watson NLU API to evaluate the sentiment output metrics of these test data. The true positive test results are below (Table 2):
Measures of Watson NLU Sentiment Model on Test Data Sets.

Note. NLU = Natural Language Understanding; CMLIS = Center for Machine Learning and Intelligent Systems; NLP = natural language processing.
In terms of classification performance in machine learning, F1 scores between the well-known classifier models are broad in range, and an F1 score higher than 0.7 is quite good (Valstar et al., 2012). Taking into account the speed that our computer connected to the sentiment API, simplicity of interface language for implementing API, cost, and the classification performance F1 score, we used Watson NLU to perform SA on all the downloaded TE data. We built programs for locally parsing and extracting the returned sentiment fields and scores for analysis.
Results and Discussion
The range of Watson NLU sentiment score is [−1.0, 1.0]. Negative values indicate negative sentiment, and positive values denote positive sentiment. The neutral point is 0.0. It is rather unexpected that for the total 48,043 articles about the eight countries by TE in 1991 to 2016, the mean and median sentiment scores are both negative, being −0.21 and −0.24, respectively. TE has a continuous and long publication history of more than 100 years. Although TE also publishes news about medicine and science, the coverage on such topics is very limited. Given the amount of sample data and the long time span in this investigation, the above negative values may represent a general picture of TE’s sentiment orientations in 1991 to 2016. Considering that it is largely a magazine reporting politics and economy of different countries, we propose that at least from the point of view of language selection and use in TE from 1991 through 2016, TE’s overall attitudes toward countries, events, the world, leaders, and masses are slightly negative or near politically or ideologically neutral.
A closer look at the sentiment scores of the eight countries shows that all the medians are below 0.0 and range from −0.20 to about −0.29 (Figure 1). The upper quartiles for them are all below 0, indicating that more than three fourths of the values for each data set are negative. It seems that they are all right skewed.

Sentiment scores of eight countries.
We performed Kolmogorov–Smirnov tests on all the eight data sets, confirming that they all do not follow normal distributions (Table 3).
Kolmogorov–Smirnov Normality Test Results of Sentiment Scores of Eight Countries.
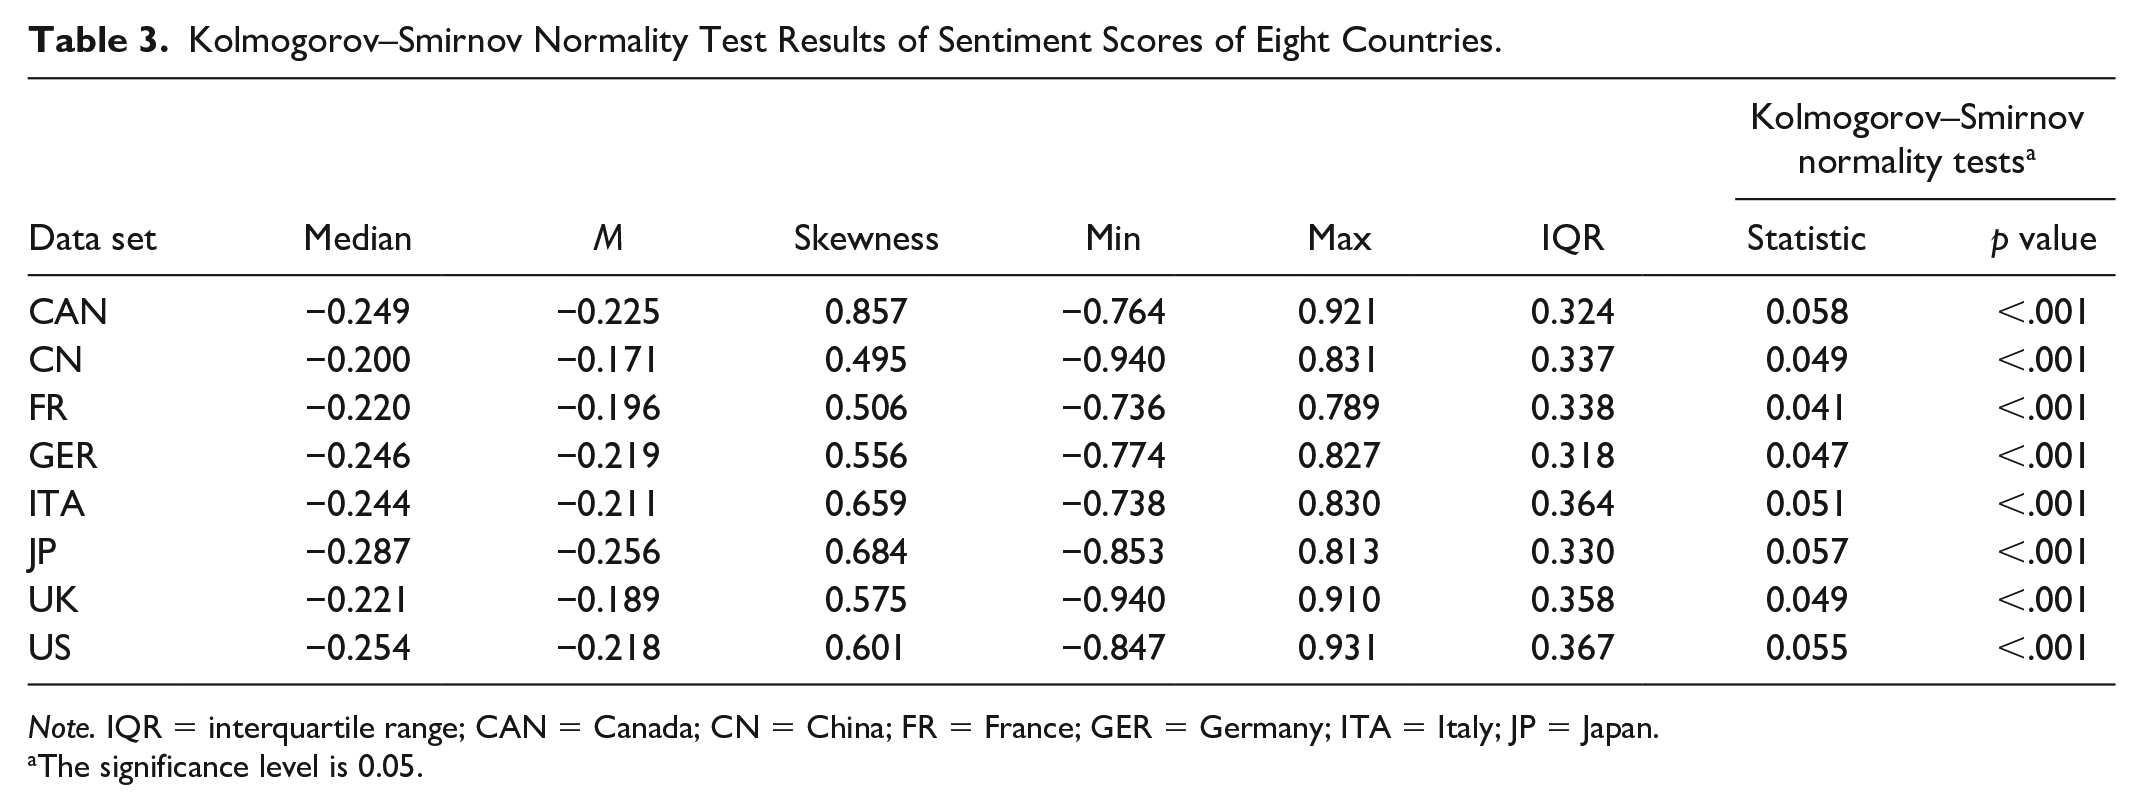
Note. IQR = interquartile range; CAN = Canada; CN = China; FR = France; GER = Germany; ITA = Italy; JP = Japan.
The significance level is 0.05.
Table 3 indicates that all the distributions of the eight data sets are moderately skewed. The results suggest that TE is not incidental but highly systematic in a strong tendency toward or clear preference for reflecting negative sentiment. This is not only true for the G7’s outgroup member China but also true for all the G7’s ingroup members. Therefore, it may be concluded that on the whole, the verbal expression of negative sentiment from 1991 through 2016 represents adequately TE’s general attitude, and TE’s marked tendency toward negative sentiment does not change with a country’s ideology or political system.
The results confirm the research findings of pervasive negative tone in the news contents (Bachleda et al., 2019; Haselmayer & Jenny, 2017; Soroka et al., 2018; Soroka et al., 2019). And the results seem different from the conclusions by Van Dijk (2005, 2013) in that the ingroup members and outgroup member both receive negative median and mean values. The G7 outgroup country or “them” seems not very “bad” and the G7 ingroup countries or “us” seem not so “good.” Overall, TE expresses substantially similar and generally negative sentiment in the articles about the ingroup and outgroup countries. “Their” things in the stories reported in TE are not as bad as “our” things. “They” are similar to or better than “us” in terms of sentiment scores.
It is not known which one is larger on this planet, the number of positive English texts or the number of negative English texts. Perhaps there are more negative English words than positive ones in the world. Two well-known (positive and negative) word lists (Hu & Liu, 2004; B. Liu et al., 2005) are highly cited and widely used in SA, which are compiled from sources on the internet. In the lists, the total number of negative English words is 2.38 times as large as that of positive English words. It is not known if English language users have inherently a general tendency toward using more negative than positive words, though their opinions are not negative. We computed the word occurrence frequencies of all the 48,043 articles and compared them with the two sentiment word lists. The top 20 most frequent positive and negative words in TE are listed in Table 4. Apparently, the articles concerned with free markets and political, social, or economic reforms are TE’s major topics, and economic debt, crisis, and recession are also TE’s central themes. It seems that totally, more positive words have been used in the top 20 sentiment words though the overall sentiment of the total 48,043 articles is negative.
Rank Order of the 20 Most Frequent Positive and Negative Words in TE.

Note. TE = The Economist.
Van Dijk (2013) states that choice of topics in a discourse clearly reflects underlying ideologies and attitudes. The chosen topics can be seen as global meanings or overall concepts of the discourse. In addition to SA, Watson NLU provides an advanced level of concept analysis on texts. Behind the technique of concept analysis is formal concept analysis (FCA; Ganter & Wille, 1999), which can enable knowledge discovery and derive implicit relationships between attributes and objects (Cimiano et al., 2005). It is a conceptual clustering technique (Poelmans et al., 2009) and is widely used in data mining, information retrieval, and knowledge representation (Cimiano et al., 2004; Stumme, 2002). The cores of FCA are formal contexts and concept lattices. In concept analysis, concepts can be derived from a text even though in the text there are no explicit terms mentioning the concepts. We parsed the returned concept analysis data of the 48,043 articles. Table 5 shows the concepts of the eight articles with extreme positive and negative sentiment scores for each country.
Concepts of the Articles With Extreme Positive and Negative Sentiment Scores.

Note. CAN = Canada; CN = China; FR = France; GER = Germany; ITA = Italy; JP = Japan.
Watson NLU can generate both explicit and implicit relations of concepts based on the content of article. For example, in the article with extreme positivity about the world’s tallest tree (coast redwood) in the United States, the term “Humboldt County” does not appear in the original text. The concept analysis creates a concept relation by connecting its species of genus, plant name, and exact geographic location (Table 5). Apparently, the central concepts contained in the articles with high negativity are similar or the same, no matter whether these articles are about the G7 ingroup member or outgroup member. The articles with extreme negativity are largely focused on political, economic, social issues and disasters, such as political leaders’ policy, partisanship, genocide, terrorism, unemployment, inflation, debt crisis, racism, devastating epidemic, crime, religion-related issues, civil rights, equality, man-made environmental disasters, and natural disasters. Similarly, the core concepts of articles with extreme positivity are primarily concentrated on arts, humanities, and technology, regardless of whether the articles are about the G7 ingroup member or outgroup member, the Asian country, or the European country. The concepts with extreme positivity include literature, painting, drawing, design, photography, sculpture, music, dance, filmmaking, natural or cultural landscapes, cooking, and wonderful technological inventions.
If the concepts with extreme negativity are considered as “bad” things and the concepts with extreme positivity as “good” things, it seems that TE treats the ingroup and outgroup members in a roughly similar way. From a long-term perspective, TE’s topics or concepts may not reveal what is “theirs” and what is “ours.” There is no distinct and broad difference between “them” and “us” in terms of the concepts. TE tends to equally emphasize both “their” and “our” most negative concepts or topics, and accentuate both “their” and “our” most positive endeavor and contrivances. TE takes similar attitudes or ideologies toward the G7’s ingroup and outgroup members, which can be reflected at least in the point of view of the articles about the eight countries with extreme positivity or negativity. Interestingly, the articles that report J. K. Rowling’s books are bestsellers in Canada, Germany, and the United Kingdom receive extreme positive scores.
As mentioned in Figure 1 and Table 3 above, generally, both the G7’s ingroup and outgroup members have negative sentiment scores. We performed Kruskal–Wallis pairwise comparisons to examine their differences (Table 6).
Kruskal–Wallis Pairwise Comparisons a .

CAN = Canada; CN = China; FR = France; GER = Germany; ITA = Italy; JP = Japan.
The tests are two sided, and the significance level is 0.05.
In Table 6, the United Kingdom is different from China, Germany, the United States, Canada, and Italy which belong to the G7’s ingroup members and outgroup state. Of the eight countries, China receives comparatively the highest sentiment values in terms of mean and median. Its scores are also significantly different from those of the G7 ingroup members. Japan is different from other countries. TE is a U.K.-based magazine. TE’s attitudes toward “us” (the United Kingdom and other ingroup members) and “them” (outgroup member) are contrary to the conjecture that “us” is “good” and “them” is “bad.” The test results seem to show that in TE’s opinion and in comparison with the ingroup members, the outgroup member does not seem to be that “bad” but seem to be “good” in the sentiment negativity order, and is most proximate to the neutral or positive point.
In the G7, the United States, Canada, and the United Kingdom share the English language and they should display very close and special affinity. The United Kingdom, a historically long-standing political and military ally of the United States, is different from Canada and the United States in sentiment scores. Figure 2 gives a vivid and intuitive picture of the sentiment differences between the eight countries. The line in dark color denotes no difference between the two connected countries. The two nodes that are connected by gray line indicate significant difference between them in sentiment scores. Each node in Figure 2 also displays its average rank in the group.

G7’s ingroup and outgroup members and their differences in sentiment scores.
Numerous historical and political events occurred in the world from 1991 through 2016. Several Presidents or Prime Ministers led their countries during this period of time. We made a longitudinal study of TE’s sentiment scores for different political leaders to observe if different leaders from the same country received different sentiment orientations. At the same time, we studied if the most important event such as hosting the world’s biggest sporting event would change TE’s sentiment on a country. Holding the Olympic Games can be seen as a definite sign of the host’s (especially the first time host’s) political stability, economic strength, and worldwide positive recognition. In July 2001, it was announced that Beijing would host the 2008 Summer Olympics. In this work, the different periods of time for comparing China are the 1990s (1991–2000), Pre-Olympic (2001–2007), and Post-Olympic (2008–2016). Data partitions and comparisons are made based on the following time frames (Table 7):
Data Partitions for Political Leaders and Time Frames.

Table 8 shows TE’s sentiment means and medians for the presidencies or cabinets during their respective time frames.
Sentiment Means and Medians for Political Leaders.

It seems that for the United States and the United Kingdom, TE’s sentiment scores for the two leaders within each pair are different except the pair of Major–Blair (Table 9). Clinton, Bush, and Obama served two full terms in office each but their scores are different in terms of their medians, the largest being on Clinton’s two terms (−0.237). It would be very difficult to judge a president or his administration because the critical characteristics of evaluating presidential performance are complex and change over time, which include policy, leadership skills, crisis management, or character (Stadelmann, 2011). According to presidential historian Smith (2009), there is no single rule to assess if a president or his administration is “good” or “bad” as people’s judgment is subject to change over time. Based on this SA on TE’s articles, the three presidents’ administrations are all not so “good”; Clinton’s is comparatively the “best” in comparison with the other two presidents’, and Clinton’s and Obama’s are not as “bad” as Bush’s. It seems that in the United Kingdom, there is no difference between Major’s and Blair’s cabinets in TE’s sentiment scores. Cameron’s cabinet receives the largest value in this group and is closest to the neutral point. It seems that Cameron’s, Blair’s, and Major’s are not as “bad” as Brown’s. It should be noted that Brown served the shortest period of time in the U.K. group.
Kruskal–Wallis Pairwise Comparisons a .
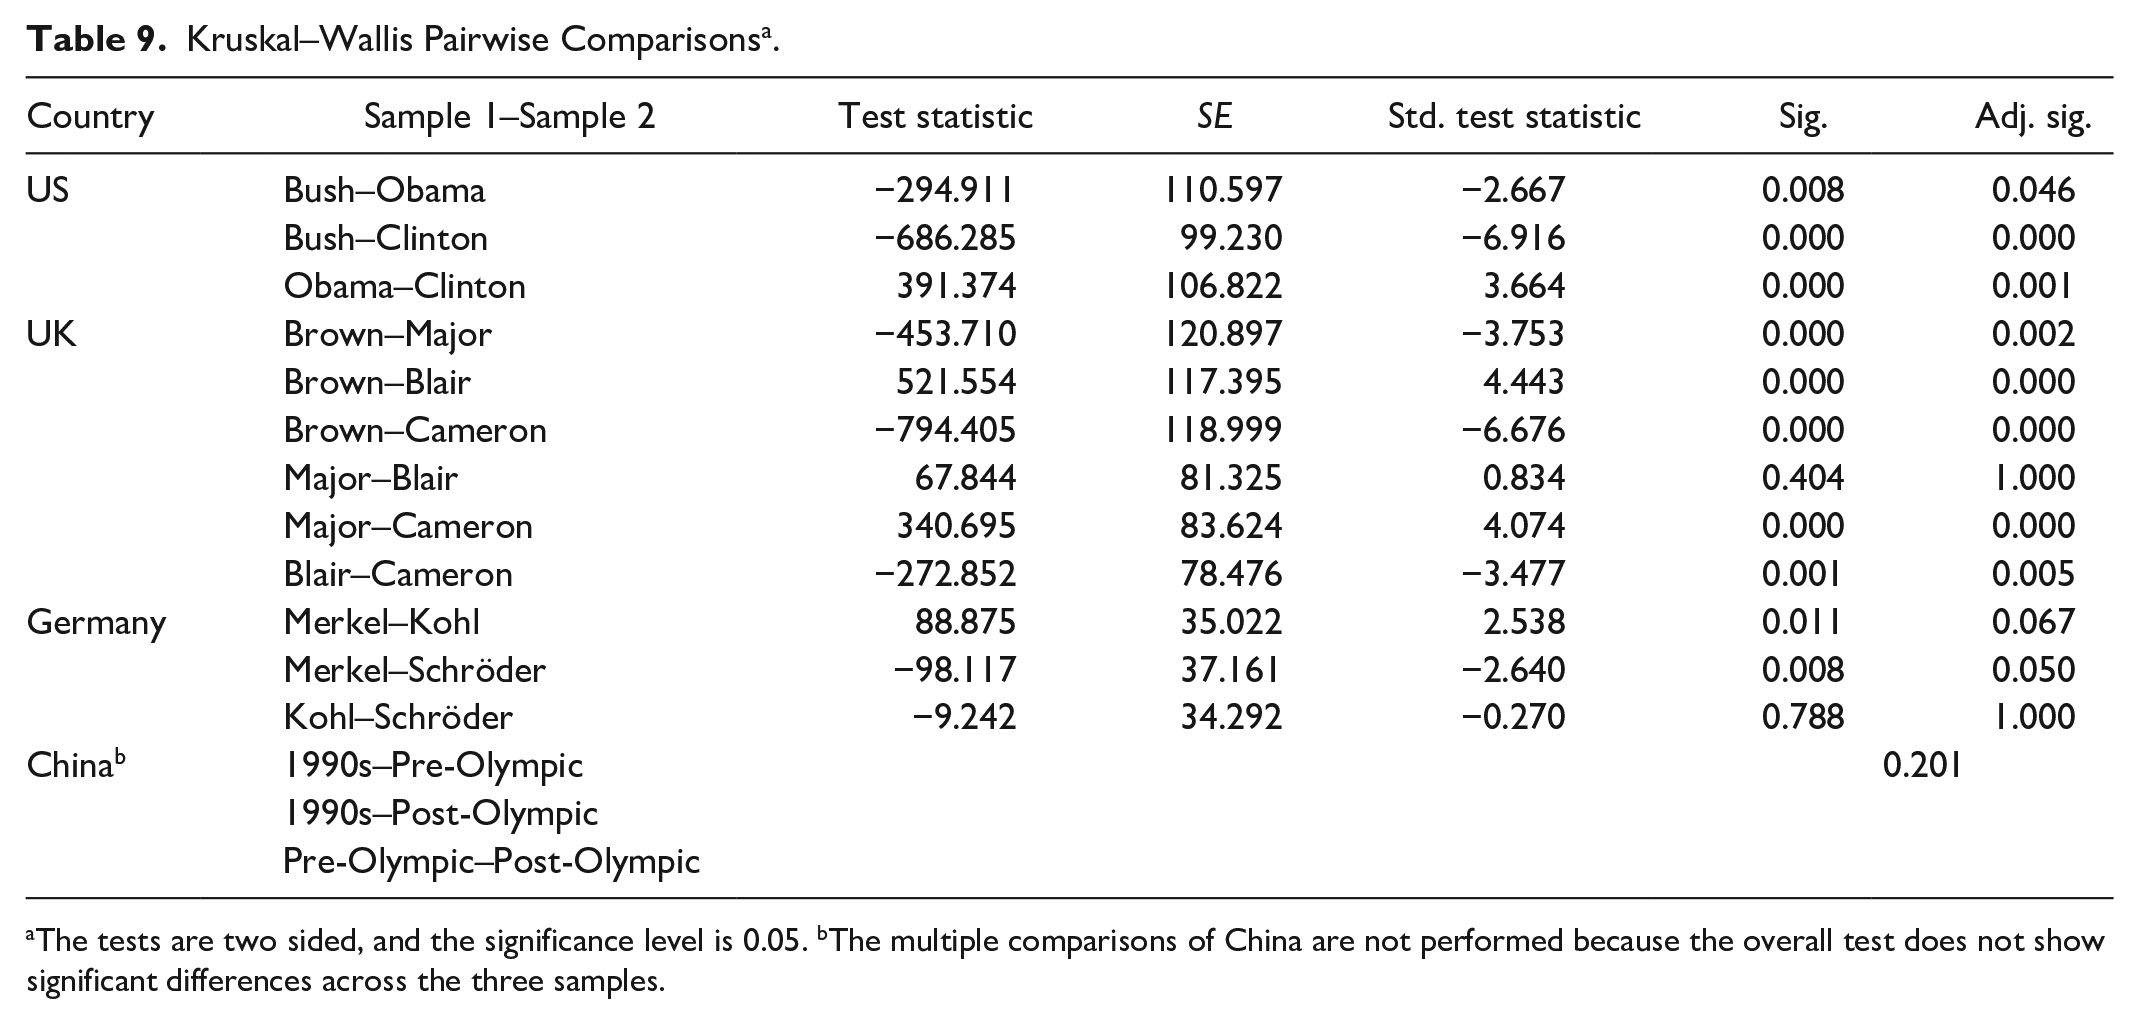
The tests are two sided, and the significance level is 0.05. bThe multiple comparisons of China are not performed because the overall test does not show significant differences across the three samples.
In Table 9, it seems that there are no differences between the three German political leaders. In comparison with the other two, Merkel is the longest serving chancellor in Germany. The sentiment medians for China’s three periods are not different from each other. It seems that hosting the summer Olympic Games has not changed TE’s attitudes toward China.
China has been experiencing rapid economic growth for about 40 years and has become the world’s second largest economy (World Bank, 2018). In 1990, China was ranked after 10 in terms of average values of nominal GDP (Wikipedia, 2018). We compared China’s GDP per capita (current US$) from 1991 through 2016 (World Bank National Accounts Data, 2017) with TE’s mean sentiment scores on the articles about China published during that period of time (Figure 3).
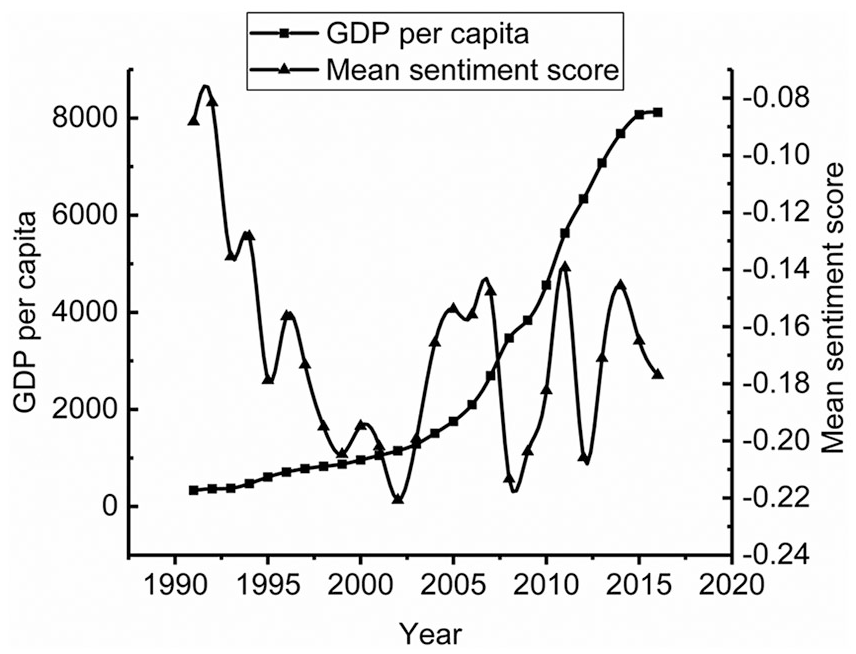
China’s GDP per capita (US$) and TE’s mean sentiment scores on China.
TE’s mean sentiment scores on China fluctuate in a small range in 1991 to 2016. After 1995, they vary very slightly. In contrast, China’s GDPs per capita show consistent and strong upward trend throughout the whole period of time. We performed correlation tests on China’s GDPs and TE’s mean sentiment scores on China (Table 10). There is no correlation between them. On the basis of the amount of available data we downloaded for this work, it seems that the numbers of articles on China published by years in TE are strongly related with China’s GDPs per capita for the corresponding years. China’s growing economic power plays an important role in increasing the number or gaining the prominence of stories about China in TE.
Matrix of Spearman Correlation Coefficients a (N = 26).

Note. CN = China; GDP = gross domestic product.
The significance level is 0.05.
Conclusion
This work has performed SA and ideology analysis on the 48,043 articles published in TE between 1991 and 2016, using Watson NLU. Overall, TE’s sentiment orientations reflected in the articles about the eight countries are slightly negative, being −0.21 and −0.24 in terms of mean and median, respectively. Three quarters of the sentiment scores for all the countries fall below the neutral point.
Our results confirm the research by Soroka et al. (2019) and other scholars that the media contents are mainly negative and negativity bias generally exists in the media contents about all the ingroup and outgroup countries. Our test results are different from Van Dijk’s conclusions.
TE’s general attitudes toward the G7’s ingroup members are not different from those toward the G7’s outgroup member though the ingroup and outgroup members pursue or promote different political systems or ideologies. Based on the observation on the top 20 sentiment words, comparatively more positive words have appeared in TE though TE’s overall sentiment is negative. The concept analysis on the articles with extreme positivity or negativity confirms that there is no difference between the G7’s ingroup and outgroup members. “Bad” things with extreme negativity are focused on political, economic, social, environmental issues and natural disasters. “Good” things with extreme positivity are concerned mainly with humanities, arts, wonderful human inventions, or technologies. There is no clear difference between the G7’s ingroup and outgroup members in the concepts or topics covered in TE. There is no marked difference between “us” and “them” in covering or emphasizing negative/positive topics in TE. In terms of the articles with extreme positivity/negativity, TE’s attitudes toward “us” and “them” are roughly similar.
Although all the eight countries receive negative scores in terms of their means and medians, there are some differences between them. In TE, China is significantly different from the other countries. Japan is also different from the rest. The United Kingdom is different from Canada, Italy, China, Germany, and the United States.
A closer look at TE’s articles published during the different periods of presidencies or cabinets shows that there is no difference between Major’s and Blair’s cabinets in sentiment, and there are differences between Brown’s and Major’s, Brown’s and Blair’s, Brown’s and Cameron’s, Major’s and Cameron’s, and Blair’s and Cameron’s cabinets. The highest goes to Cameron’s, the lowest to Brown’s. In the United States, Clinton’s, Bush’s, and Obama’s are different from each other in receiving sentiment. Clinton’s obtains the highest, and Bush’s, the lowest in the sentiment scores. In Germany, there are no differences between the three chancellors. Hosting the Olympic Games for the first time does not change TE’s attitudes toward the host. China’s economic strength is related not with TE’s sentiment scores on China but with the number of articles on this country published in TE.
This work is limited in a lack of comparisons between TE and other influential magazines or newspapers in sentiment orientations. The SA and concept analysis are exclusively based on this single magazine. If different magazines or media from different countries were used, we could compare between the sentiment results from these different sources and acquire a better understanding of TE and its sentiment orientations toward different countries. And we could gain a broader or more complete understanding of human feelings and behavior.
Footnotes
Acknowledgements
We sincerely thank the anonymous reviewers for their helpful comments.
Declaration of Conflicting Interests
The author(s) declared no potential conflicts of interest with respect to the research, authorship, and/or publication of this article.
Funding
The author(s) disclosed receipt of the following financial support for the research, authorship, and/or publication of this article: This work was supported by the National Social Science Fund of China (Grant No: 17BYY014).