
Abstract
This study initially employs the Integrated Evaluation Method to assess financial inclusion and the sustainable development index from 2005 to 2021. Subsequently, the study uses fsQCA to examine how a combination of variables, including financial inclusion, technological innovation, foreign direct investment, household consumption levels, industrial structure, and urbanization, affects sustainable development at various levels. The findings indicate that financial inclusion, technological innovation, foreign investment, consumption, and urbanization are core conditions for High-SDI. In addition, the causal configurations associated with Low-SDI indicate that the absence of financial inclusion, technical innovation, and foreign investment are correlated with reduced sustainable development. Based on the results of panel data fsQCA, the sample is divided into three regions eastern, central, and western for empirical analysis. The empirical findings are notably consistent with the fsQCA configuration outcomes. This study provides policymakers with theoretical references on how to improve the level of sustainability in various regions of China.
Keywords
Introduction
Three world summits, namely Stockholm (1972), Rio de Janeiro (1992), and Johannesburg (2002), focused on environmental and sustainable development issues. These summits underscored the imperative of achieving sustainability in the 21st century (Shah, 2008). In 2015, the United Nations General Assembly adopted the 2030 Agenda for Sustainable Development, comprising seventeen Sustainable Development Goals (SDGs). These goals aim to provide an image with a higher resolution than those of the weak, strong, and integrated sustainability perspectives which include three pillars of social, economic, and environmental, guiding nations toward sustainable growth. Sustainable development is a global priority, and China has been actively implementing its sustainable development strategy. In terms of economic sustainability, China is committed to fostering high-quality economic development. In terms of environmental sustainability, it aims to reach a carbon peak by 2030 and carbon neutrality by 2060. By 2020, China successfully achieved its goal of comprehensively constructing a prosperous society, a significant milestone in its social sustainability agenda, which aims at promoting common prosperity and enhancing living standards. Although China has made notable progress in the field of sustainable development, it continues to face multiple practical challenges and bottleneck constraints. Since 2016, China has been the world’s largest carbon emitter, with high intensity of resource consumption and substantial total pollutant emissions (IEA, 2024). And structural imbalances in regional development remain unresolved, further complicating the sustainability progress. The complexity and protracted nature of these challenges underscore that China still has a long way to go in achieving sustainable development goals.
As a vital component of economic development, finance is a key driver of environmental, social, and economic development (Fungáčová & Weill, 2015; Y. Hu et al., 2021), and financial inclusion is one of the crucial tools for achieving the SDGs (Klapper, 2016). Financial inclusion affects environmental sustainability both positively and negatively (Dou & Li, 2022). On the one hand, financial inclusion funds the market, promotes technological innovation, enhances social well-being, saves energy, drives the growth of the renewable energy sector, and promotes environmental sustainability by reducing energy poverty and lowering carbon emissions. Overall, it can offer multidimensional guarantees for sustainable development (Akram et al., 2020; H. Chen et al., 2022; Li et al., 2021; Renzhi & Baek, 2020). On the other hand, it can increase the demand for energy and financial products, leading to further greenhouse gas emissions and a greater threat to environmental sustainability (Chaudhry et al., 2021; Le et al., 2020). From an economic viewpoint, financial inclusion plays a crucial role in fostering sustainable economic development through the enhancement of household incomes, facilitation of inclusive economic growth, and optimization of industrial structures (Doumbia, 2018; Xie et al., 2017). From a social aspect, it can improve sustainable social development by lowering rates of unemployment and poverty (Bruhn & Love, 2014; X. Zhang et al., 2019). In light of China’s combination of notable accomplishments and persistent structural challenges in sustainable development, financial inclusiveness serves as a crucial support mechanism for advancing its related practices (Patwardhan, 2018).
The design and variable selection of assessment systems for financial inclusion and sustainability indicators involve both qualitative and quantitative attributes, leading to inconsistent use of estimation methods, study objects, and study durations (Gök, 2020). As a result, there are significant differences in the study of causal relations between financial inclusion and sustainable development. Many studies employ a symmetrical quantitative analysis method, revealing a symmetric link between the dependent and independent variables (Woodside, 2013). However, Westfall and Yarkoni (2016) stated that controlling variables can sometimes obscure rather than clarify relationships in regression models. As not all data samples consistently support negative or positive connections between the independent and dependent variables, net impacts observed from reality are often contrary to the conclusions drawn by the measurement model. To address this issue, studies can consider a range of conditions that indicate the positive or negative effects of X on Y, rather than solely focusing on demonstrating X’s net positive or negative influence on Y (Woodside, 2013). Accordingly, this study utilizes the Fuzzy Set Qualitative Comparative Analysis (fsQCA) method to systematically identify the configurations of conditions that either facilitate or hinder sustainable development. This approach thereby provides a theoretical foundation and practical insights for enhancing China’s sustainable development performance.
Existing literature primarily uses Peking University’s digital inclusion finance index as a key indicator for assessing financial inclusion. However, due to the “digital divide” in China (Z. Song et al., 2020), this index may inaccurately reflect the true extent of financial inclusion across different regions. This limitation presents a significant challenge in precisely assessing China’s overall degree of financial inclusion. Therefore, this study evaluates China’s level of financial inclusion development based on coverage, utilization, and stable development, in line with the definition of financial inclusion. It considers economic, social, and ecological factors, and selects indicators based on both qualitative and quantitative characteristics. To analyze the data, it employs a comprehensive assessment method to evaluate financial inclusion and sustainable development across 30 provinces in China. In addition, it uses fsQCA, an asymmetrical analysis method (Woodside, 2019), to combine quantitative and qualitative indicators. This approach aims to identify an optimal combination of financial inclusion, technological innovation, foreign direct investment, household consumption levels, industrial structure, and urbanization to enhance sustainable development.
This study has the following contributions. Firstly, it utilizes non-symmetrical analysis methods, blending qualitative and quantitative perspectives, to examine how financial inclusion and other conditional variables interact to impact sustainable development. Secondly, it can offer insights into variable selection and model design for future research. In practice, fsQCA combines causal and consequential configurations at different levels of sustainable development. The results of this approach can help policymakers understand the actual state of sustainable development in different provinces and analyze the specific factors contributing to regional disparities in sustainability. Therefore, it can provide valuable theoretical insights for the formulation of sustainability policies tailored to different regions.
The rest of the study has the following structure. Section “Literature review” briefly reviews the existing literature, while Section “Methodology and data” introduces the evaluation method and the use of fsQCA. Then, Section “Results and analysis of FII and SDI” analyzes the temporal and spatial evolution of financial inclusion and sustainable development indices, and discusses the results of the fsQCA model. Finally, Section “Conclusions and policy implications” concludes the research.
Literature Review
Financial Inclusion
Financial inclusion, formally introduced by the United Nations in 2005, is defined as the sustainable provision of a broad spectrum of financial services and products to all segments of society (Consultative Group to Assist the Poor). Previous studies on financial inclusion have primarily focused on the methodologies for its measurement and the influencing factors. Studies on measurement can be broadly classified into three distinct categories. The first category emphasizes dimension selection for indicator systems, which are constructed using dimensions such as financial service availability, their usage, service quality, and stability (Ahamed & Mallick, 2017; Beck et al., 2007; Sarma, 2008; T. Zhang, 2016). The second strand of literature concentrates on selection of indicators within dimensions, where both international organizations and scholars frequently employ micro-level indicators. For instance, the Global Findex Database presents data disaggregated by demographic categories (e.g., gender, age) to accurately represent actual financial service utilization. Additionally, some scholars incorporate financial institution types into indicator frameworks (Cui & Liu, 2017; Mialou, 2017). The third category examines measurement techniques, including Euclidean distance, principal component analysis (PCA), and comprehensive evaluation methods, each presenting distinct advantages and limitations. Euclidean distance is noted for its computational efficiency and adherence to mathematical axioms (Sarma, 2008); however, its results are highly sensitive to indicator weights, with deviations in these weights potentially leading to systematic bias (Yu et al., 2016). Principal Component Analysis (PCA) is an effective method for extracting key information from variables (Avom et al., 2021). The principal components derived through PCA are mutually orthogonal, thereby eliminating multicollinearity. Avom et al. (2021, 2023) applied PCA to construct Africa’s financial inclusion index (FII). Factor analysis (FA), on the other hand, assigns indicators to latent dimensions through factor loadings. While FA reduces errors associated with subjective dimension-setting, it may yield factor structures inconsistent with economic theory (Huang et al., 2017). It is worth noting that both PCA and FA assume linear correlation and normality of variables. PCA emphasizes second-order moments, specifically the covariance structure (Sarma, 2015), whereas FA prioritizes first-order moments, such as mean levels, which potentially introduce systematic bias. Conversely, comprehensive evaluation methods, such as coefficient of variation approach, are widely utilized in measurement of financial inclusion in China. These methods effectively eliminate dimensional differences and objectively capture relative contributions of original indicators (Gong & Zhang, 2020).
In examining the determinants of financial inclusion, scholars consistently affirm that enhanced financial literacy contributes to strengthening financial inclusion (Uddin, 2020). An increase in financial literacy improves individuals’ financial cognition (Mahdzan & Tabiani, 2013), thereby influencing residents’ financial behaviors, including investment and savings decisions (Dogra et al., 2023; Sulthana et al., 2022), and optimizing their financial planning. Furthermore, income levels, demographic characteristics, and institutional environments significantly influence financial inclusion. Individuals within high-income groups demonstrate a greater capacity for payment, exhibit lower sensitivity to the costs associated with financial services, and have higher access rates to formal financial services. Empirical evidence supports, indicating that account ownership rates at formal financial institutions are markedly higher in high-income economies (Demirgüç-Kunt & Klapper, 2012). At the institutional level, the implementation of relaxed entry policies for financial institutions, along with reduced disclosure requirements, promote financial inclusion (Allen et al., 2016). Innovation in financial and technological innovation profoundly affects financial inclusion by primarily lowering transaction costs and broadening service coverage. For instance, Banco Azteca in Mexico established branches within department stores, leveraging customer purchase histories to mitigate information asymmetry and enhance credit accessibility (Bruhn & Love, 2014). Agarwal et al. (2018) and De Janvry et al. (2019) illustrate that collaboration between microfinance institutions and credit bureaus expands loan scaling. Technological innovation influences financial inclusion through the development of financial infrastructure and scale effects. For instance, the adoption of mobile payment adoption has significantly increased account ownership in developing countries, thereby narrowing the gap with developed nations (Demirgüç-Kunt et al., 2021). Furthermore, advancements in big data and algorithmic processes have optimized credit assessment mechanisms for small and micro enterprises, effectively lowering entry barriers to credit services (Beck et al., 2022).
Based on the existing literature, this study aims to evaluate the current state of financial inclusion development in China. To this end, an evaluation system for Financial Inclusion Index (FII) is constructed, incorporating dimensions such as the coverage, utilization, and stability of financial services. The coefficient of variation method is employed to calculate these indicators.
Sustainable Development
The concept of sustainable development originates within the field of ecology, where it emphasizes the importance of synergistic coordination and dynamic equilibrium among economic, social, and environmental systems to optimize intergenerational well-being (Silva et al., 2020). Current research primarily centers on the methodologies for measuring and factors influencing sustainable development. Studies on the measurement of a sustainable development index (SDI) can be generally categorized into two categories. The first concerns the construction of indicator system, including the selection of both dimensions and individual indicators. The selection of dimensions informed by the United Nations’ 17 Sustainable Development Goals (SDGs) framework or natural-socio-economic tripartite framework (Hu et al., 2021; United Nations publication issued by the Department of Economic and Social Affairs, 2019; Zhao et al., 2019). Despite the SDGs providing systematic references for dimension and indicator, their indicator system is complex, and data availability is limited (D. Zhang et al., 2022). Overall, selected indicators align rigorously with sustainable development strategies, satisfying dimensional information requirements while capturing critical process and outcome metrics (Silva et al., 2020). The second stream addresses measurement methodologies. Internationally commonly used methods include energy value analysis, dynamic analysis and ecological footprint analysis (Kharrazi et al., 2014; Pata & Isik, 2021). However, these approaches prioritize resource sustainability assessment without adequately integrating inter-systemic linkages (Kharrazi et al., 2014). In contrast, the entropy weight method is widely utilized in constructing SDI due to its objective weighting based on indicator dispersion (L. Xu et al., 2023), with weights reflecting dynamic changes in indicator significance within the system (W. Zhang, 2004).
Research on influencing factors of sustainable development primarily examines key policy interventions and structural transitions in economic development. For instance, studies have investigated the impact of transformation in energy structure on the advancement of sustainable development objectives. Hertwich et al. (2015) conducted a comprehensive comparison between clean and fossil fuel-based power generation technologies, assessing their impacts on greenhouse gas emissions, pollutant output, and metal resource consumption. The results demonstrate that global energy transition from fossil fuels to renewable sources substantially enhances environmental sustainability outcomes. Some scholars focus on the role of foreign direct investment (FDI) in sustainable development. Zaman et al. (2021) demonstrated that FDI contributes positively to economic sustainability in countries involved in the Belt and Road Initiative, with regional integration serving as a beneficial moderating factor. In contrast, Gyamfi et al. (2022) revealed that FDI exerts an inhibitory effect on environmental sustainability in E7 countries.
This study develops a China-specific SDI system based on a three-dimensional framework encompassing economic, social, and ecological aspects, utilizing the entropy weight method for computation. The indicator framework is aligned with the SDGs. For instance, within the dimension of social sustainable development, the framework assesses China’s progress toward SDG 3 (Good Health and Well-Being) by incorporating criteria representing the level of medical and health services. Specifically, the number of enrollees in basic medical insurance is employed as a proxy indicator, reflecting China’s tangible progress toward achieving this particular goal.
Financial Inclusion Impact on Sustainable Development
Extensive studies have been conducted on the relationship between financial inclusion and ecological sustainability, yielding inconsistent results. Some researchers have found that the progress of financial inclusion is crucial for promoting ecological sustainability. This progress is expected to have multifaceted promotional impacts, such as stimulating market financing, technological innovation, and environmental protection industry. Furthermore, financial inclusion supports environmental sustainability by encouraging clean energy production, mitigating energy poverty, and reducing carbon emissions (Acheampong et al., 2020; H. Chen et al., 2022; Renzhi & Baek, 2020; Saud & Chen, 2018; Zafar et al., 2019). Financial inclusion impedes the progress of ecological sustainability by providing consumers and businesses with more funding and conveniences. This provision stimulates the demand for commodities such as automobiles and household appliances, leading to increased energy consumption and environmental pollution (Acheampong, 2019). Ulusoy and Demiralay (2017), Nasir et al. (2019), and Le et al. (2020) collectively demonstrated that advancements in financial inclusion heighten energy consumption and greenhouse gas emissions (Chaudhry et al., 2021).
Many empirical studies have demonstrated a positive correlation between financial inclusion and sustainable economic development. These studies have highlighted various ways in which financial inclusion can support economic sustainability. For instance, financial inclusion can enhance the income level of the population, facilitate the upgrading of industrial structures, benefit the use of renewable energies, and foster inclusive economic growth (Doumbia, 2018; X. Wang et al., 2022; X. Zhang et al., 2019). Doumbia (2018) showed that in nations and regions with greater financial credit scales and enhanced levels of financial intermediary development, the income growth rate of low-income groups surpassed the average income growth rate. Xie et al. (2017) and Meng and Ren (2020) discovered that financial inclusion improved the allocation of financial resources by providing a broader range of financial services, which in turn facilitated the upgrading of industrial structures. X. Zhang et al. (2019) showed that financial inclusion in China equalized entrepreneurial opportunities, improved fair income distribution, reduced poverty, and consequently, promoted inclusive economic growth (Li & Han, 2019).
Furthermore, some studies have indicated that financial inclusion plays a significant role in fostering sustainable social development by reducing poverty and promoting employment. For example, Burgess and Pande (2005) found a negative correlation between the number of households with a bank account and the poverty rate. Specifically, they showed that a 1% increase in the number of households with at least one bank account in rural areas was associated with a 0.34% drop in the poverty rate. Bruhn and Love (2014) found that the implementation of local financial institutions in Mexico resulted in a 1.4% decrease in local unemployment. This association can be attributed to improved accessibility to financial resources, which facilitated the enhancement of operations for informal business proprietors. According to Ma and Du (2017) and Zhu and Wang (2017), financial inclusion can potentially provide an indirect impact on poverty reduction through the facilitation of economic growth and the enhancement of income distribution, contributing to sustainable social and economic development.
In summary, research on the influence of financial inclusion on sustainable development is characterized by several key features. Firstly, the studies rely mainly on symmetrical quantitative approaches. Secondly, they focus mostly on examining the effects of financial inclusion on ecological, economic, and social sustainability individually, with limited attention given to the overall influence on sustainability as a whole. To bridge this gap, this study focuses on identifying five adjustment variables, namely technological innovation, foreign direct investment, population consumption level, industrial structure, and urbanization, to investigate the various combinations of conditions that can potentially facilitate sustainable development across different levels.
Methodology and Data
This study utilizes annual data from 30 Chinese provincial administrative units from 2005 to 2021. The study excludes the Macao and Hong Kong special administration region, Taiwan province, and Tibetan autonomous region due to data limitations. The United Nations originally introduced financial inclusion in 2005 when it promoted microcredit. Due to database limitations, the FII calculation began in 2005 and is concluded in 2021. The FII and SDI are calculated using the coefficient of variation method and entropy method respectively, and subsequently analyze the characteristics of these two indices. Furthermore, this study integrates qualitative and quantitative views to investigate the combination of factors contributing to sustainable development by adopting the fsQCA methodology. The fsQCA as an asymmetric analysis method in social science has garnered increasing attention (Roig-Tierno et al., 2016; Schneider & Wagemann, 2012). It can identify causal relationships between variables (Pappas, 2018; Pappas et al., 2020), determine core independent variables for empirical research, and analyze the combination of conditions that arise from the high value of variables based on the outcome of the causal configuration of fsQCA.
The Coefficient of Variation Method and Entropy Method
The FII of China is calculated using the coefficient of variation method (X. Wang et al., 2016). The initial step computes the weights of the indicators within each dimension. The next step measures FII under each dimension, and the final step combines all dimensions to obtain the complete FII, according to the following equation.


where
This study chooses the entropy method to calculate the SDI (L. Xu et al., 2023). This method determines the relative significance of indicators based on variations in each indicator. Firstly, it establishes a standardized framework for measuring indicators of sustainable development, utilizing the same formula employed in the calculation of the FII. Secondly, it calculates the fraction of each indicator under every dimension. Indicators with a calculated value of 0 are assigned a value of 0.0001 to prevent meaningless counterparts when calculating entropy. Thirdly, it determines the entropy of the indicator under each dimension, followed by the calculation of the indicators’ redundancy and the weight of the indicators. Finally, it obtains a specific score and an aggregated score for the corresponding dimensions of sustainable development, according to the following equation.


where
FsQCA
In the Qualitative Comparative Analysis (QCA), samples are referred to be “cases” (Ragin, 2000). Case studies are primarily concerned with providing descriptions, explanations, and predictions regarding the individual and combined circumstances that lead to the occurrence of outcomes (Pappas & Woodside, 2021). The fsQCA methodology integrates both qualitative and quantitative evaluations. It divides samples into various subsets and applies combinatorial logic, fuzzy-set theory, and Boolean minimization to identify the combinations of case conditions that are either sufficient or necessary for the occurrence of the outcome (Kent & Olsen, 2008). Necessary and sufficient conditions can be conceptualized as core and peripheral elements, respectively. Core elements signify a robust causal association with the outcome, while peripheral elements indicate comparatively weaker causal relationships (Fiss, 2011). The use of fsQCA is free from sample size limitations, in contrast with conventional econometric models such as ordinary least squares regression. Moreover, when analyzing whether financial inclusion is a core element of sustainable development, fsQCA considers both the causal relationship between these two factors (Ragin, 2008) and the causal configurations at different levels of sustainability.
Ragin (2008) outlined that the operation of fsQCA primarily involves four steps. The first one is calibration, which transforms the outcome and variables into sets whose values range between 0 and 1. Calibration paves the way for the qualitative interpretation of relevant and irrelevant information, as well as for the precise location of relative positions between cases (Ragin, 2008; Vis, 2012). The second step builds the truth table using the fuzzy-set algorithm, which computes all possible configurations (or conditional combinations) that may cause the outcome. The third step establishes the consistency and Proportional Reduction in Inconsistency (PRI) cutoff for distinguishing causal combinations that are part of the outcome. Finally, solutions are generated in terms of logical truth, namely complex solutions, parsimonious solutions, and intermediate solutions. The “solution” refers to a combination of configurations that is supported by a high number of cases that make the outcome occur. The key is to examine the causal configurations presented by various solutions to identify the core elements.
Studies adopting the fsQCA approach use cross-sectional data (Guedes et al., 2016). Innovatively, this study utilizes panel data, which requires the examination of temporal effects. This study employs the GCA model, as introduced by Garcia-Castro and Ariño (2016) and Guedes et al. (2016), to analyze how stable the consistencies and coverage are across cases (within consistency and within coverage) and over time (between consistency and between coverage). This approach includes between consistency (BECONS), within consistency (WICONS), pooled consistency (POCONS), the (pooled) coverage (POCOV), between coverage (BECOV), and within coverage (WICOV). BECONS assesses how stable the cross-sectional consistencies and coverage are for each year in the panel. WICONS measures how consistent the consistencies and coverage are across time for each case. POCONS includes all observations and corresponds to the presented consistency values associated with each causal configuration. Usually, panel data contains T different BECONS, N different WICONS, and a POCONS. To examine the presence of a structure in the panel data and identify the relationships between the conditions and the outcome, this study follows Guedes et al. (2016) to calculate the Euclidean distance between BECONS and POCONS, where the smaller the distance, the more stable the consistency over time is. In addition, it calculates the Euclidean distance between WICONS and POCONS to analyze how the WICONS vary across cases, where a big distance confirms the heterogeneity of samples in panel data. Hence, the calculation results are BECOV, WICOV, and POCOV. According to Garcia-Castro and Ariño (2016), the smaller the Euclidean distance between BECONS, WICONS, and POCONS, the greater the ability of POCONS to measure the overall consistency of panel data.
Data
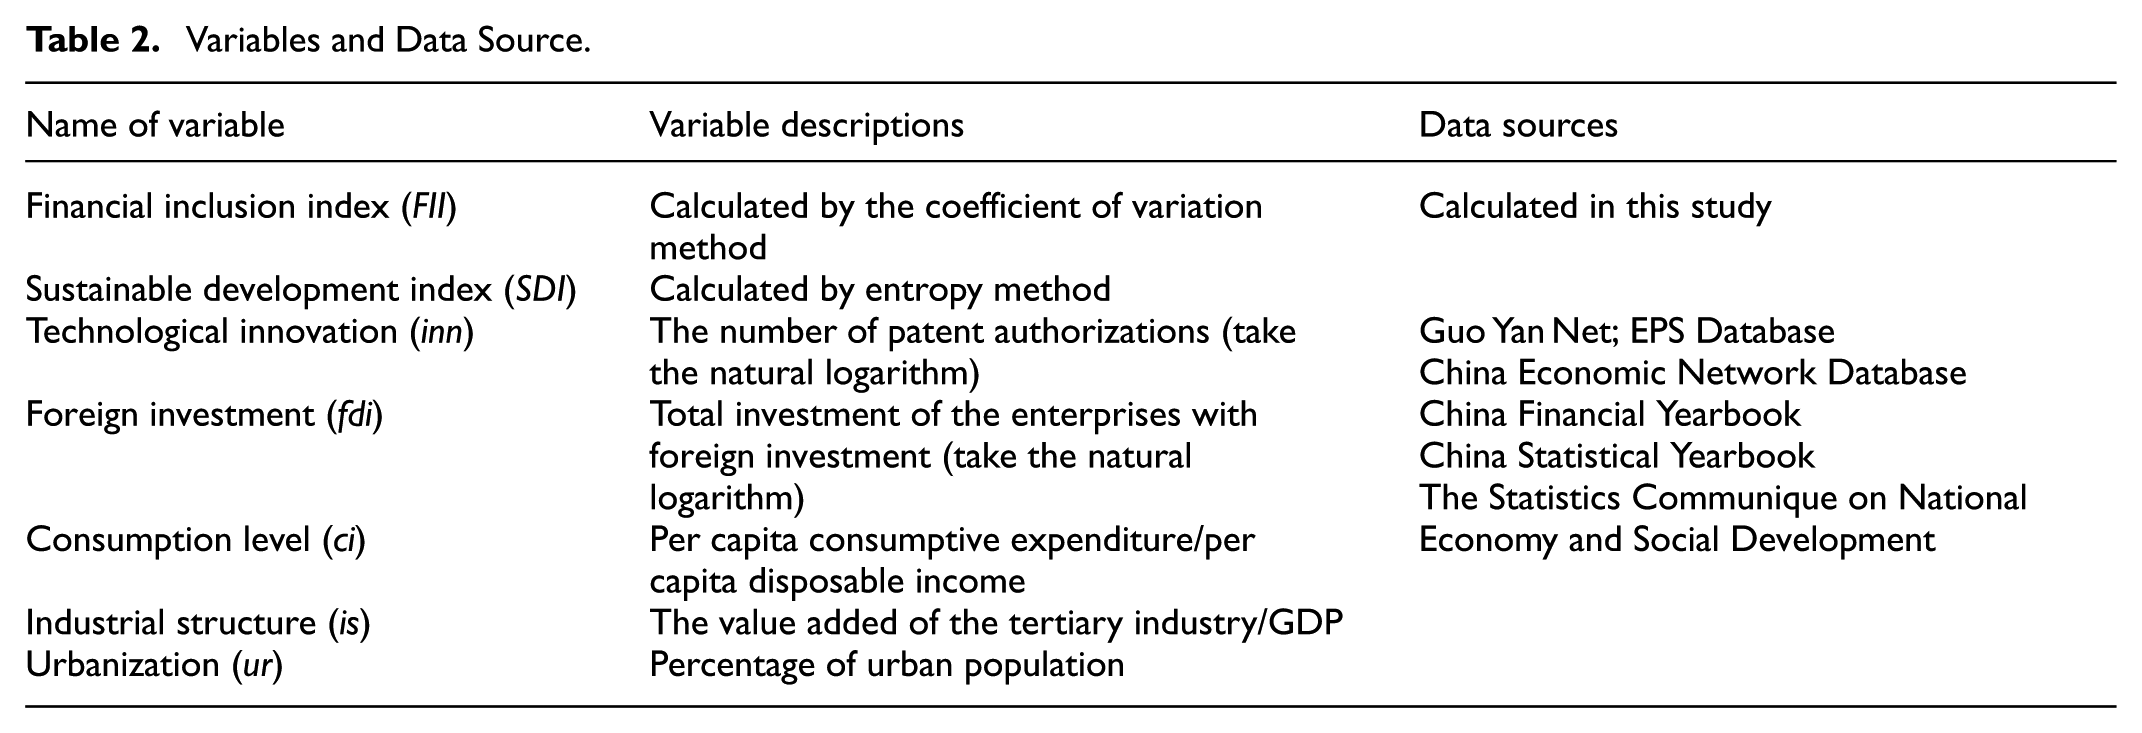
In this research, the evaluation framework construction of FII includes coverage, utilization, and stable development of financial services, following Beck et al. (2007), Cui and Liu (2017), and Wan et al. (2020). This study develops an evaluation system for SDI based on the three dimensions of economic, ecological, and social, according to Wu and Zhao (2016), H. Hu et al. (2021), and W. Li et al. (2023). Table 1 outlines the selection and criteria of specific indicators. The indicators chosen in this study are more pertinent to the seventeen SDGs when compared to previous research. For example, this study considers the medical level of SDG 3, choosing the indicator of the number of people insured by basic health insurance in the social sustainable development dimension.
The Evaluation Framework of FII and SDI.

In this study, the conditional variables include financial inclusion, technological innovation, foreign investment, industrial structure, level of consumption, and urbanization (Ji & Zhang, 2019; Ouyang & Li, 2018; X. Xu et al., 2021), whereas the outcome is the SDI. Technological innovation is regarded as an important strategy for promoting sustainable development (Rani et al., 2025), and it is represented by the number of patent authorizations in this study. In light of the contrasting findings presented by Zaman et al. (2021) and Gyamfi et al. (2022) concerning the impact of FDI on sustainable development, this study also includes FDI as a control variable and measures it through the total investment of foreign-invested enterprises. The industrial structure is defined as the percentage of the value added of the tertiary industry in the Gross Domestic Product (GDP) for the year. The tertiary industry, primarily consisting of the service sector, is distinguished by “cleaner” service components in contrast to the physical manufacturing elements, thereby presenting potential environmental advantages (Tang et al., 2022). The service sector is pivotal in driving economic growth, as it comprises value-added contributions from key subsectors such as transportation, trade, finance, healthcare, tourism, and education (Lee & McKibbin, 2018; Matuka & Asafo, 2021). Similarly, the Environmental Kuznets Curve hypothesis suggests that environmental degradation initially intensifies as economies transition from pre-industrial (agricultural) to industrial (manufacturing) stages. However, it subsequently improves as these economies progress toward post-industrial (service-based) development (Ehigiamusoe et al., 2025).
Arguably, the level of consumption has a significant impact on sustainable development, as it influences residents’ low-carbon behavior and adoption of energy-efficient household appliances, new energy vehicles, and other environmentally friendly practices. And prior research has demonstrated that excessive consumption contributes to environmental degradation by escalating the utilization of natural resources (Akenji, 2014; Jankiewicz, 2021). Therefore, this study chooses the indicator of consumption level, which is measured by the per capita consumptive expenditure and the per capita disposable income ratio. Rapid urbanization heightens resource intensity and pollution emissions, thereby presenting challenges to environmental sustainability (Rani et al., 2025). This study, therefore, examines urbanization rate to assess its impacts sustainable development processes. Table 2 shows a detailed description of the variables.
Variables and Data Source.
Results and Analysis of FII and SDI
Descriptive Statistics
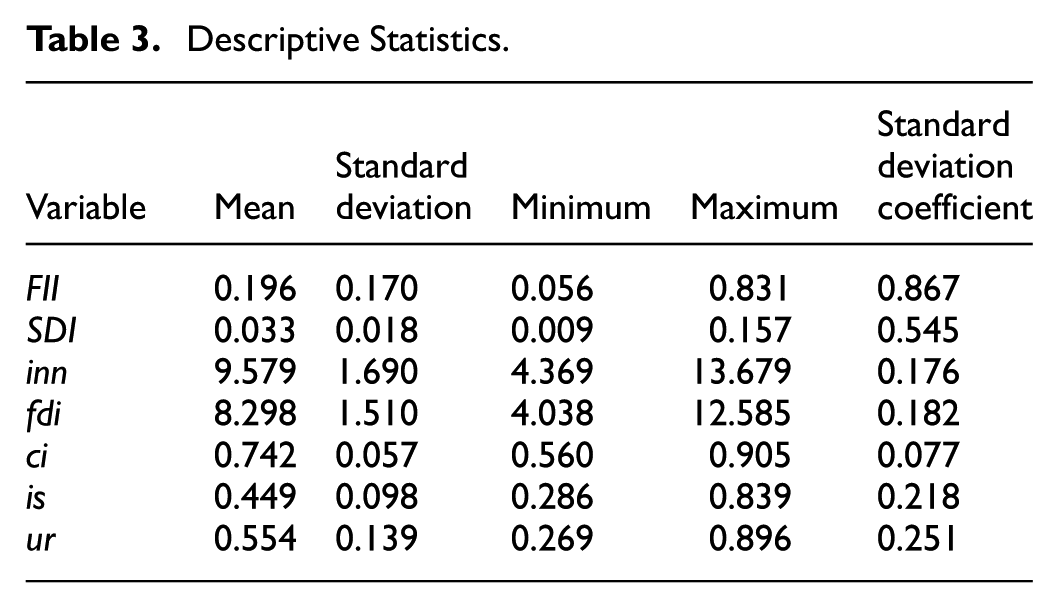
Table 3 displays the descriptive statistical analysis of the variables utilized in this study. According to this table, the FII and SDI for 30 Chinese cities are concentrated at 0.196 and 0.033, respectively. The standard deviations for both the FII and SDI exceed 0.5, significantly higher than for other variables in the analysis, indicating a high degree of dispersion in their data distributions. This reflects significant regional disparities in financial inclusion and sustainable development levels across the study sample.
Descriptive Statistics.
Spatiotemporal Evolution of FII and SDI
This study calculated the FII and SDI within 2005 to 2021 for 30 provinces of China, utilizing the described methodology. Then, it drew a national index heat map, using the calculation results of 2005, 2010, 2015, and 2021, as depicted in Figure 1. Figure 1(a) illustrates an overall enhancement in the level of financial inclusion within the country. From a regional standpoint, Beijing, Tianjin, and Shanghai are the top three regions in terms of financial inclusive development. Both Beijing and Shanghai exhibit high levels of financial inclusivity, with Beijing’s FII consistently exceeding 0.71 and Shanghai’s FII remaining above 0.66 throughout the observed period. Conversely, Yunnan, Guizhou, and Guangxi have demonstrated low levels of financial inclusivity, with their indices not exceeding 0.1 during the sample period. In terms of temporal fluctuations, Shandong, Shanxi, and Chongqing show more noticeable changes in FII. Specifically, there have been two changes in layer color across all three regions. Notably, Shandong and Chongqing exhibited an increase in 2021 compared to 2015, whereas Shanxi has experienced a decrease. The coastal FII has maintained stability due to their sustained high degree of economic development and the consistent progress in the financial sector. In general, coastal regions have a greater degree of FII compared to inland regions, while the latter are gradually improving.

Time-spatial evolution of the FII and SDI: (a) time-spatial evolution of the FII and (b) time-spatial evolution of the SDI.
With regard to Figure 1(b), the SDI exhibited minor fluctuations across different regions from 2005 to 2021. Guangdong shows a substantial increase in SDI due to its great GDP under the economic sustainability dimension, as well as its considerable education funding and participation in urban basic pension insurance under the social sustainability dimension. From a spatial perspective, SDI indicates a high level, above a threshold of 0.035, in coastal regions, including Shanghai, Jiangsu, Zhejiang, Shandong, Fujian, and Guangdong. However, it exhibits a low degree of below 0.019 in Shanxi, Guizhou, Gansu, and Ningxia due to their unfavorable geographical location, hampering foreign export trade. Therefore, these provinces demonstrate comparatively smaller values in terms of export trade indicators compared to other regions. Moreover, Shanxi has abundant natural resources, including coal. However, the extraction of these resources can pollute the environment and destroy ecosystems. Additionally, it produces high industrial solid waste and wastewater, which threatens its ecological sustainability.
FsQCA Analysis of Sustainable Development Factors
Calibration
The calibration approach follows established protocols for small-to-medium sample sizes, as recommended by Woodside (2013). Given the sample size in this study is 510, the calibration follows Woodside’s (2013) empirically grounded protocol using sample distribution anchors. This approach is consistent with best practices in qualitative comparative analysis, as it balances empirical distribution with theoretical meaningfulness (Ragin, 2008). Following Woodside (2013), the calibration utilizes threshold values of 0.95, 0.5, and 0.05. These values correspond to different relationships: 0.95 for full membership, 0.5 for crossover point (neither in nor out), and 0.05 for full non-membership. By calculating the percentages of the variables based on these three values and using the Calibrate function of the software, we transform the data into the log-odds metric with all values between 0 and 1. We proceed to the data calibration in fsQCA software (version 4.1). Table 4 presents the calibration and fuzzy values for each condition and outcome.
Calibration Values.

Necessity Analysis
In the analysis of necessary conditions, fsQCA checks whether (one or more) conditions are necessary or mostly necessary for the outcome to occur based on the consistency value of the conditions. If a condition (or combination of conditions) is present in all instances of an outcome, it is a necessary condition (or combination of conditions); a condition is necessary if the outcome occurs whenever that condition also exists (Ragin, 2008). Given the asymmetry of fsQCA (Ragin, 2008), Table 5 provides two results including High- and Low-SDI. It presents consistency and coverage of each condition, which have different meanings. The consistency index is analogous to a correlation and the coverage index is analogous to the “coefficient of determination” (i.e., r2). Increased coverage signifies a more prevalent path within the sample, indicating that the actual explanatory scope of the combination is more extensive. Coverage of 0.6 indicates that that this particular condition or combination of conditions accounts for 60% of the outcomes in most instances, thereby serving as a primary determinant of result. Low coverage (e.g. 0.3) even with high consistency (e.g. 0.9), it is only applicable to a few cases and may be a driving factor in specific contexts, but not a universal pattern. As indicated by Young and Park (2013), for the consistency threshold of 0.9, Table 5 revealed that no single condition, whether in relation to High-SDI or Low-SDI outcomes, is necessary. However, the coverage of high FII and high fdi is relatively substantial (>0.8), indicating that they frequently co-occur with high- SDI, although their presence is not logically “necessary.” Similarly, the low inn and low fdi within the Low-SDI group demonstrate substantial coverage, suggesting that the low technological innovation (inn) and foreign investment (fdi) level are a prevalent characteristic of low SDI. Low-SDI regions are more likely to be influenced by low fdi, low ur, and low FII, as their consistency exceed 0.8. Table 5 demonstrates the necessity of a single condition; however, further analysis is required to establish sufficiency.
Analysis of Necessity for SDI (High- and Low-SDI).

Sufficiency Analysis
The sufficiency analysis investigates the role of subsets of conditions in understanding High-SDI or Low-SDI (Ragin, 2008). Fundamental to this analysis is the truth table, which lists all logically possible combinations of conditions, termed configurations, and the outcomes (both High-SDI and Low-SDI). For panel data, the association of a condition’s membership score to either 0 or 1 is based on strong membership (depending on whether it is less than or equal to 0.5 or greater than 0.5 in calibrated value). Moreover, the truth table needs to be sorted by frequency and consistency of conditions (Ragin, 2008). The consistency threshold serves to filter logically valid configurations, while the frequency threshold excludes rare configurations. Together, these thresholds are utilized to evaluate the causal explanatory power and empirical robustness of configurations. Since frequency describes the number of cases associated with a configuration, the investigation of the relationships requires a threshold to ensure obtaining a minimum number of cases. A higher frequency value means that each configuration involves more cases in the sample, but it will reduce the percentage (coverage) of the sample. For samples larger than 150 cases in this study, the frequency threshold is set at 3 (Fiss, 2011; Ragin, 2008). Then, the truth table is sorted by “raw consistency,” while setting a consistency threshold. Consistency is the minimum consistency level for further consideration of the configuration (Ragin, 2008), mainly set to 0.75 (Rihoux & Ragin, 2009). This study examines the effect of varying consistency thresholds (0.8, 0.9, and 0.93) on the stability of results, with the aim of mitigating subjective arbitrariness. In accordance with Ragin (2008), a threshold of 0.9 or higher is advised for necessity analysis to minimize the occurrence of counterexamples. The findings of this study indicate that the consistency threshold of 0.93 is appropriately set. And following Ragin (2008), a threshold of 0.9 or higher is advised for necessity analysis to minimize the occurrence if counterexamples. The findings of this study indicate that the consistency threshold set is 0.93 is appropriately set. Furthermore, this study uses the PRI consistency to avoid simultaneous subset relations of configurations in both the High-SDI and Low-SDI. PRI consistency should be close to raw consistency, while configurations with PRI below 0.5 indicate significant inconsistency (Greckhamer et al., 2018). Thus, the PRI threshold is set to 0.7. Since the PRI exhibits a value below 0.7, the outcome is considered as 0, eliminating contradictory configurations that support both the appearance and non-appearance of the outcome and ensures that the solution has a clear causal interpretation.
This study presents the results of a sufficiency analysis of complex solutions and parsimonious solutions, following Schneide and Wagemmann (2012) and Beynon et al. (2020). Solution refers to a combination of configurations supported by a large number of cases, with each combination termed a causal configuration, associating configurations with specific outcomes. Considering these two forms of solutions has two reasons. First, Schneide and Wagemmann (2012), advocating for the consideration of these solutions, suggest that prioritizing complex solutions may be safer when existing theories cannot support the inclusion of logical remainders. Since the complex solution includes all possible combinations of conditions, it provides a comprehensive view of the potential causal configurations. In contrast, the parsimonious solution is a simplified version of the complex solution, based on simplifying assumptions. It highlights the most important conditions that cannot be omitted from any solution. These critical conditions are called “core conditions” (Fiss, 2011), identified automatically by fsQCA. Furthermore, the complex solution excludes counterfactual cases, whereas the parsimonious solution incorporates logical reminders. These are counterfactual combinations that, while logically possible, are not observed empirically, thereby minimizing the reliance on the limited diversity in the data (Ragin, 2008). These reminders enable the algorithm to simplify configurations by assuming that certain conditions would not alter the outcome if they were observed, thereby generating more generalizable solutions. This includes any counterfactual combination that can contribute to a logically simpler solution. A thorough analysis of both parsimonious and complex solutions is essential to ensure the robustness of the configurations. This complementarity between the two types of solutions is valuable for understanding the causal configurations under different levels of sustainable development.
This study chooses the circle notation adapted from Ragin and Fiss (2008), where • and ⊗ stand for presence and absence of a condition, respectively. In addition, the large and small circles indicate core and peripheral conditions, respectively. A blank space indicates the inapplicability of the condition in a certain configuration, irrespective of the presence or absence of the outcome (Pappas & Woodside, 2021). Given the asymmetry of fsQCA, Tables 6 and 7 show the causal configurations of the High-SDI and Low-SDI, respectively, to accurately analyze the conditions for the improvement of sustainable development.
The Complex Solution and Parsimonious Solution of High-SDI.

The Complex Solution and Parsimonious Solution of Low-SDI.

Note. The a in Tables 6 and 7 denotes the consistency and coverage values are over the whole data set of cases.
Tables 6 identified the High-SDI, three (CHS1-CHS3), and three (PHS1–PHS3) causal recipes under the complex solutions and parsimonious solutions, respectively. Tables 7 showed that the Low-SDI indicated seven (CLS1-CLS7) and four (PHS1–PHS4) causal recipes identified under the complex solutions and parsimonious solutions, respectively. Tables 6 and 7 show that the solutions were informative with their consistency and coverage values under High-SDI and Low-SDI, respectively. The minimum values of consistency and coverage are 0.74 and 0.25, respectively, which are higher than the minimum acceptable for an informative solution, according to Ragin (2008) and Woodside (2013).
The causal recipes in Table 6 illustrate that financial inclusion, technical innovation, foreign investment, consumption, and urbanization are the core elements contributing to a high level of sustainable development. The causal recipes of CHS1 and PHS1 reveal that a region with a combination of high financial inclusion, technological innovation, and foreign investment will experience an advancement in sustainable development even without appropriate industrial structure This suggests that in regions with suboptimal industrial structures, advancing financial inclusion can be an effective strategy to lower financing barriers, support enterprises innovation (Acheampong et al., 2020), and attract foreign investment into green technology research and development, thereby promoting regional sustainability. The CHS2 and PHS3 indicate that the combination of high levels of financial inclusion, technical innovation, foreign investment, and consumption constitutes the primary determinant of high-SDI. Groups with high consumption levels are more likely to participate in environmentally protective activities and adopt sustainable consumer behaviors, thereby improving consumption quality through certain behavioral guidance (White et al., 2019), which aligns private consumption with sustainability objectives. The findings from CHS3 and PHS2 indicate that a region can achieve a higher degree of sustainable development with significant technological innovation, the ability to attract foreign investment and high urbanization, even with relatively low levels of consumption and unreasonable industrial structure. This has profound real-world implications: urban centers can serve as hubs of innovation and absorption of foreign capital, utilizing agglomeration economies to promote sustainable outcomes. From an economic perspective, this model offers a feasible development alternative, especially for regions that are neither resource-based nor industrial. Specifically, strategic urbanization, open investment policies and innovation ecosystems (UN-Habitat, 2022), can compensate for shortcomings in other dimensions. Overall, financial inclusion, technological innovation, foreign investment, consumption and urbanization are the most important conditions for high-SDI. Even when industrial structures conditions are lacking, high-SDI can still be achieved through targeted enhancements in these core areas.
The solutions in Table 7 suggest that areas experience low-SDI in the absence of financial inclusivity, technical innovation, and foreign investment. The findings from CLS1, CLS2, CLS4, CLS5, CLS7, and PLS1 reinforce that regions lacking in technological innovation and the capacity to attract foreign investment are particularly prone to low SDI. Technological innovation serves as a critical driver of economic growth by enhancing corporate competitiveness, facilitating the reduction of pollutants (Najid et al., 2023), and promoting more efficient resource use, all of which are essential for long-term sustainability (Rani et al., 2025). The CLS3 and PLS4 highlight that the absence of financial inclusivity, foreign investment and proper industrial structure are closely linked with low levels of sustainable development. Meanwhile, the CLS2 and PLS2 configurations show that, although financial inclusivity is present, it may not adequately compensate for the absence of foreign investment and balanced urbanization, ultimately leading to low SDI. These findings highlight the complementary roles of financial inclusivity, technical innovation, and foreign investment in driving sustainable development. Furthermore, the results also imply that policymakers seeking to improve sustainable development should adopt integrated strategies that simultaneously enhance financial inclusion, foster innovation ecosystems, and improve the investment climate (Khan et al., 2021).
Parsimonious solutions simplify complex ones by removing redundant conditions through counterfactual analysis. For instance, within the high-SDI group, a comparison between CHS1-CHS3 and PHS1-PHS3 reveals that certain conditions, such as industrial structure, are excluded in the parsimonious solution. The comparison of findings between high-SDI and low-SDI indicates that the configurations of conditions explaining high-SDI are not simply the inverse of those explaining its negation. This observation aligns with the principle of causal asymmetry (Pappas et al., 2020). The comparison of the findings between high-SDI and low-SDI shows that configurations of conditions that explain high-SDI are no mirror opposites of configurations for its negation, in line with the principle of causal asymmetry (Pappas et al., 2020). For instance, a low urbanization in Table 7 is not the primary factor contributing to low-SDI, thereby demonstrating the asymmetry of the fsQCA. Although urbanization rate (ur) does not emerge as a primary condition in the comprehensive sufficiency analysis of the Low-SDI group, it still contributes synergistically in specific sufficient pathways, namely CLS1, CLS2, CLS3, CLS7, and PLS2. This implies that the presence of low-SDI relies on multiple substitutable pathways. This asymmetry highlights the necessity for policy involvement to address distinct barriers at various developmental phases. The notably greater simplification observed in Low-SDI settings, with a reduction of 42.9% in paths, compared to no reduction in High-SDI settings, suggests that contextual factors in High-SDI environments may hinder the process of oversimplification. While this enhances interpretability, the stability of core conditions across both solutions confirms their robustness. The FII, inn and fdi are present in both the High-SDI group and Low-SDI group solutions.
The fsQCA Results of Panel Data
Table 8 presents the consistency and coverage values for POCONS and BECONS in the fsQCA, along with the Euclidean distance between BECONS and POCONS as well as between WICONS and POPONS. According to Table 8, the consistency values of POCONS and BECONS exceed the threshold of 0.75 (Ragin, 2008), indicating that their values are significant and meaningful. The POCOV is 0.324 suggesting that the sets of conditions effectively account for different states of sustainability.
The fsQCA Results of Panel Data.
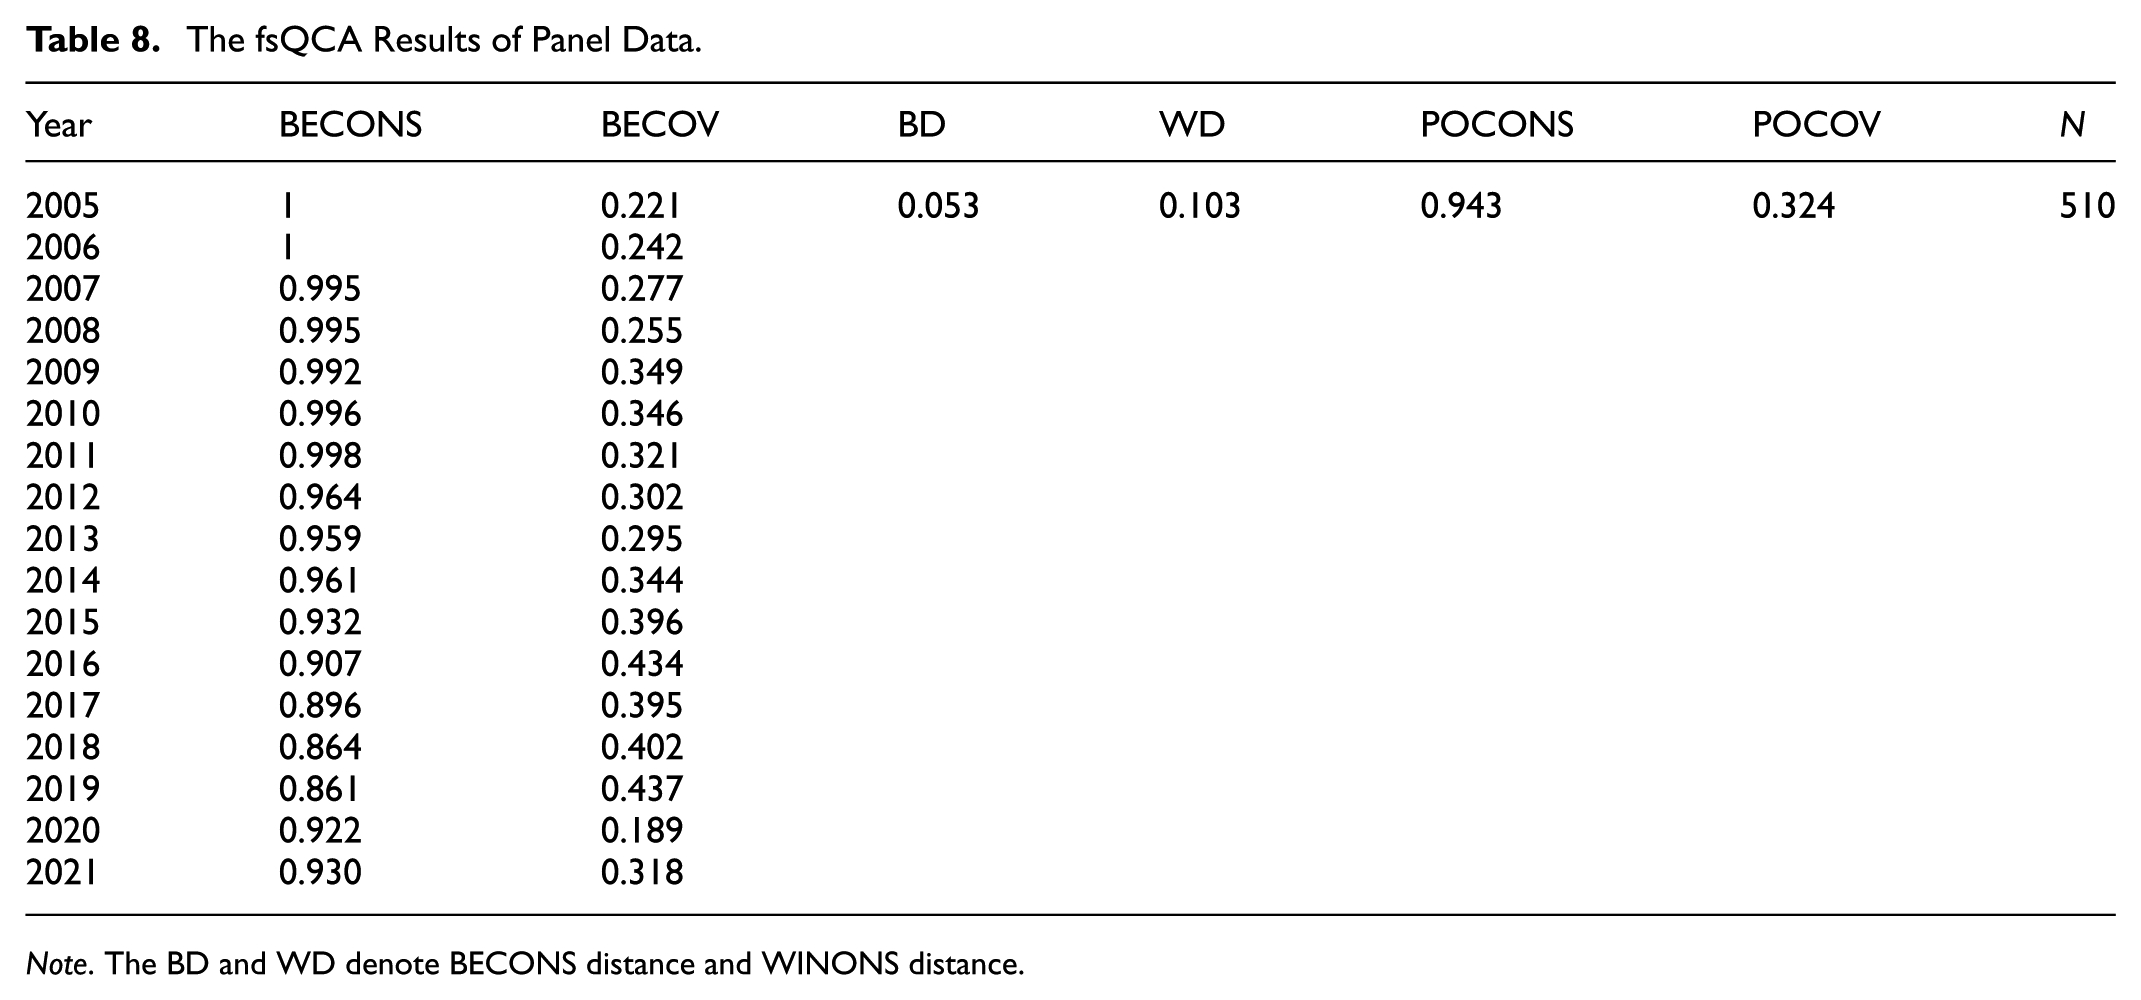
Note. The BD and WD denote BECONS distance and WINONS distance.
The BECOV exhibits an overall upward trend from 2005 to 2021, with a notable decline in 2020 attributable to the profound and detrimental effects of the COVID-19 pandemic on China’s economic, social, environmental, and institutional development (UN-Habitat, 2022). Overall, the coverages indicate that the configurations have a high explanatory power for the SDI. The WINCONS distance (0.103) exceeds the BECONS distance (0.053), implying that cross-sectional effects dominate over time effects. The disparities in sustainable development levels among provinces in China are more pronounced than the temporal improvements observed within individual provinces. This suggests that the issue of regional imbalance warrants greater attention than the overall temporal trend. However, it does not diminish the significance of temporal factors; rather, it highlights the prominent impact of regional disparities. Policymakers should monitor temporal trends over an extended period while prioritizing the mitigation of regional disparities in the immediate term. This result suggests that empirical analysis should pay attention to the impact of cross-sectional effects, such as heterogeneity analysis or threshold analysis. The BECONS and WINCONS distances both surpass the baselines of 0.049 and 0.009, confirming significant structural effects of the panel data (Garcia Castro & Ariño, 2016).
Figure 2 illustrates the fluctuations of the BECONS value from 2005 to 2021, along with a comparative analysis of BECONS and POCONS. Over time, the BECONS values have varied relatively smoothly, from 1 in 2005 to 0.93 in 2021, due to the small distance value of BECONS. Compared with POCONS, BECONS showed higher values before 2014, indicating that financial inclusion, technical innovation, foreign investment, consumption, and urbanization played a significant role in promoting sustainable development across Chinese provinces by 2014. These findings can be further validated through the application of phased analysis methods in subsequent empirical research. Nevertheless, the BECONS demonstrated a declining trend from 2015 to 2019. This phenomenon may be attributed to China’s transition into a period of “New Normal,” characterized by a reduction in the country’s economic growth rate from approximately 10% to 6%–7% post-2015 (A. Chen & Groenewold, 2019). Concurrently, environmental regulations have become more stringent, and previously implicit environmental costs are now being explicitly recognized.

The value of BECONS.
Table 8 has limited capacity to show the distribution of WICONS due to the large sample size (510). Instead, Figure 3 shows its values relative to POCONS. Regarding Figure 3, the WICONS are highly polarized with a large subgroup of regions displaying low consistencies—that is, conditions are not sufficient for high-SDI in this group, and another subgroup of regions with very high lones (=1)—that is, conditions are sufficient for high-SDI in this group (Garcia-Castro & Ariño, 2016). The results raise the question of why such substantial differences exist. While there might be several multiple factors contributing to polarization of consistencies into different groups, a detailed examination of the data reveals that regions with a consistency of 1 are mainly located in the eastern regions such as Shanghai, Beijing, Zhejiang, and Jiangsu, where the FII is generally higher. Had the research focused on these regions, for example, the overall POCONS would have consequently been significantly higher, indicating that FII demonstrates greater statistical sufficiency in the eastern regions compared to other regions (Garcia-Castro & Ariño, 2016). These findings require further statistical analysis for validation, or at the very least, regional testing through empirical analysis.

The value of WICONS.
Robust Test
To ensure the robustness of the fsQCA configuration results, this study employs empirical regression analyses by dividing the sample into three regions: eastern, central, and western. The detailed linear regression results are presented in Table 9. This regional stratification is motivated by the fsQCA findings derived from panel data, which reveal that cross-sectional effects prevail over temporal effects. This highlights the necessity of examining cross-sectional heterogeneity through cluster or subgroup analysis. Before conducting empirical regression analysis, this study first performs a multicollinearity test. The results indicate that, except for the urbanization rate in the eastern region, which exhibits a variance inflation factor exceeding 5, no variables show significant multicollinearity. Consequently, this variable in the eastern region is excluded from subsequent empirical regression. Furthermore, the appropriate panel model specification is determined via the Hausman test, which supports the use of fixed effects models for the eastern region and random effects models for the central and western regions.
Empirical Results.
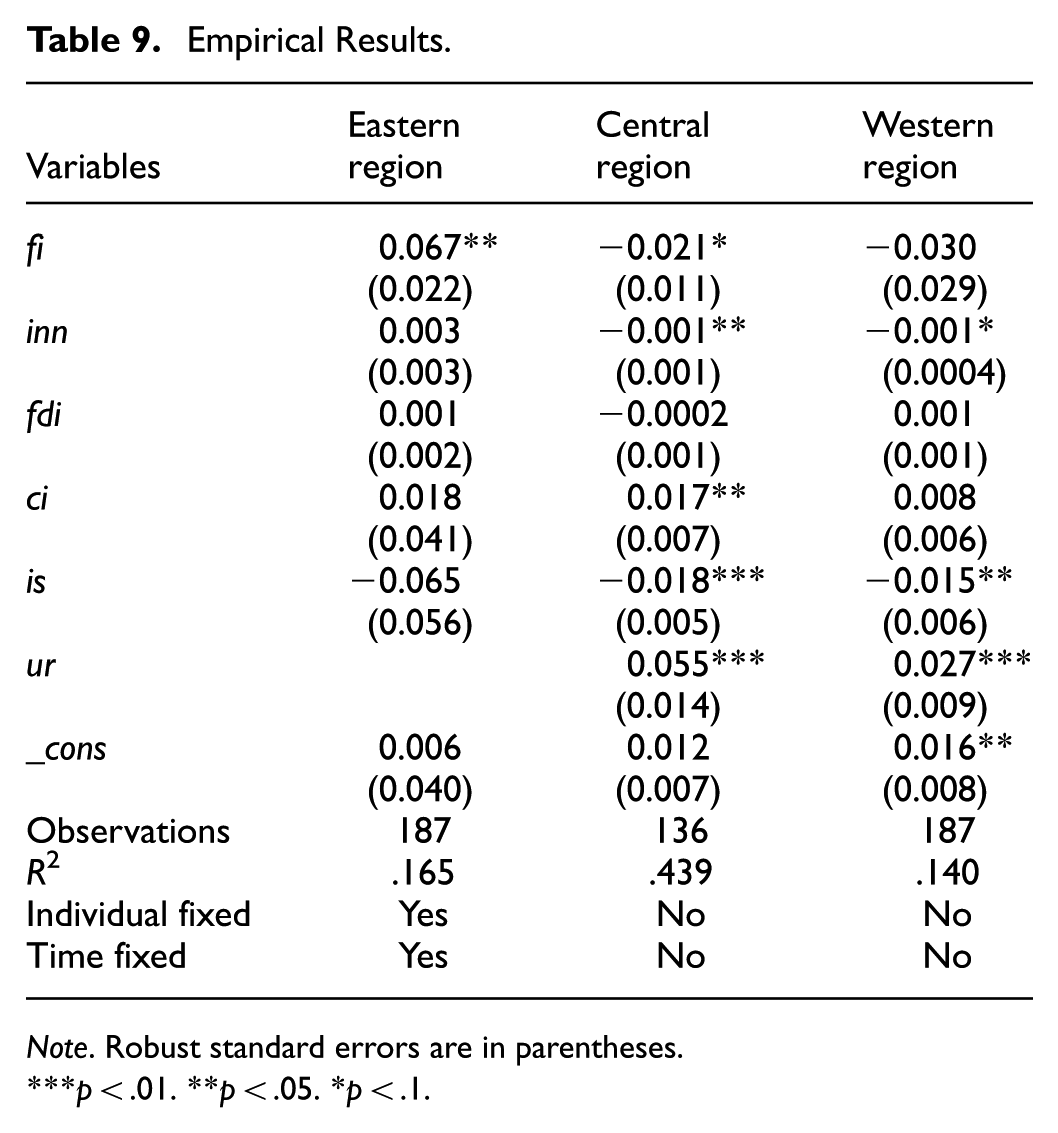
Note. Robust standard errors are in parentheses.
**p < .01. **p < .05. *p < .1.
The regression results presented in Table 9 reveal distinct regional patterns in the determinants of sustainable development. In the eastern region, financial inclusion demonstrate statistically significant positive coefficients, suggesting FII makes substantive contributions to enhancing sustainable development levels. This align well with the CHS1, CHS2, PHS1, and PHS3 configurations identified in the High-SDI group’s solutions, where the FII emerges as a critical determinant to achieving high-SDI. For the central region, financial inclusion shows a significant negative coefficient, and the coefficients of technological innovation and industrial structure are both significantly negative, while resident consumption level and urbanization level exhibit significantly positive effects. This pattern corresponds with the CLS4, PLS2, PLS3, and PLS4 configurations observed in Low-SDI group. The FII in the central region exerts a significant negative impact on sustainable development, which can be attributed to several interrelated factors. First, weak financial infrastructure and regulatory frameworks facilitate credit misallocation toward carbon-intensive industries and low-productivity firms rather than green innovation sectors. While this may boost short-term growth, it reinforces a carbon-intensive development path, intensifying resource depletion and environmental pressures, thereby hindering sustainability. Second, if expanded financial inclusion relies heavily on informal channels or high-cost credit (Muhammed & Musa, 2025), it may elevate debt burdens for households and firms, curbing long-term investment and sustainable consumption, further undermining sustainable development. Third, the region has not yet crossed critical thresholds for financial deepening, institutional quality, and human capital development required to transform FII into a sustainability driver (Q. Wang et al., 2020).
Additionally, the significantly negative coefficients for technological innovation and industrial structure in the central region suggest that low conversion rates of innovation outputs may be resulting in redundant R&D efforts and low-value patents (K. Chen & Guan, 2012), increasing resource use without generating high-value-added production. Moreover, uncoordinated expansion of the tertiary industry without parallel upgrading of traditional industries may further reduce resource allocation efficiency (Y. Song et al., 2023). In contrast, consumption level and urbanization rate exhibit positive effects, likely by stimulating demand-side growth, promoting infrastructure modernization, facilitating industrial upgrading, and enhancing resource aggregation efficiency (W. Liang & Yang, 2019), all contributing to sustainable development. A similar pattern is observed in the western region, where financial inclusion shows an insignificant negative effect, while technological innovation, industrial structure, and urbanization emerge as significant determinants, consistent with the mechanisms identified in the central region. The results mirror the PLS3 and PLS4 configuration identified in Low-SDI group. Collectively, these empirical results demonstrate strong consistency with the fsQCA configurations identified in this study, thereby validating the analytical framework’s robustness and accuracy in capturing the complex, context-dependent pathways to sustainable development across different regional contexts.
Conclusions and Policy Implications
This study explores the impact of various combinations of financial inclusion, technological innovation, foreign investment, consumption, industrial structure, and urbanization on different levels of sustainable development. To this end, it employs a combination of qualitative and quantitative analysis methods as well as the asymmetrical analysis method of fsQCA. The causal configurations associated with High-SDI indicate that financial inclusion, technological innovation, foreign investment, consumption and urbanization constitute the most critical factors for achieving elevated levels of sustainable development. In contrast, the causal configurations associated with Low-SDI suggest that the absence of financial inclusivity, technical innovation, and foreign investment are linked to diminished sustainable development. The fsQCA results from panel data indicate that cross-sectional effects dominate over time effects, emphasizing the importance of analyzing cross-sectional impacts and conducting cluster or heterogeneity analysis in future research. The findings highlight that regional imbalances present a more urgent issue than the overall temporal trend. Nonetheless, this does not undermine the importance of temporal factors; rather, it emphasizes the significant influence of regional disparities. For effective policy implementation, while long-term monitoring of temporal trends remains crucial essential, short-term efforts should prioritize addressing regional disparities. We divide the sample into three regions based on the results of panel fsQCA and conduct empirical analysis separately. These empirical results demonstrate strong consistency with the fsQCA configurations identified in this study.
The findings propose the following policy recommendations. Firstly, for regions with high levels of sustainable development, sustained progress requires prioritizing financial inclusion, technological innovation, foreign investment, consumption, and urbanization. Policies should be formulated to promote these factors, with a particular focus on advancing financial inclusion due to its strong diffusion effect, which can catalyze the development of other core conditions. This inference is drawn from the configuration results associated with High-SDI. Particularly in the eastern region, where empirical analysis reveals a statistically significant positive relationship between FII and SDI. Therefore, it is recommended that this region further promote financial inclusion across the three dimensions constituting the FII. For instance, provinces such as Fujian, Jiangsu, and Hebei need to improve their scores in usage dimension by increasing the frequency of financial service utilization. These regions might consider stimulating product innovation among financial institutions or promoting customized and personalized financial services to further expand consumer engagement. Meanwhile, Tianjin and Zhejiang, should focus on improving their performance in the stability dimension of financial services. This could be achieved by utilizing fintech to reduce the cost of financial services, and thereby increasing the efficiency and competitiveness of financial systems and enhancing financial inclusion (Zhou et al., 2024).
Secondly, for areas with low levels of sustainable development, it is crucial to prioritize the promotion of financial inclusivity, technological innovation, and foreign investment according to the causal configurations in the Low-SDI group. Such as in the central and western regions, where both financial inclusion and sustainable development are at relatively low levels, empirical evidence reveals that the FII fails to significantly advance sustainable development. A potential explanation for insignificance is that financial inclusion has not yet crossed the critical threshold to exert a positive impact. Specifically, its current development level remains insufficient to address underlying challenges such as fragmented infrastructure, limited service depth, and constrained human capital. Policymakers should prioritize strengthening financial infrastructure, integrating financial literacy programs with transportation and digital connectivity upgrades, and breaking the cycle of financial exclusion to elevate inclusion levels. Lastly, enhancing regional cooperation between areas with varying degrees of sustainable development through collaborative exchanges and sharing of experiences is imperative to achieve mutual development and improve the overall level of sustainable development in China. Specifically, establishing regional coordination mechanisms and cross-regional cooperation platforms can enhance communication and knowledge exchange among eastern, central, and western regions. This strategy would amplify the demonstration and spillover effects of financial inclusion from eastern regions while simultaneously promoting infrastructure and policy coordination among neighboring regions, thereby collectively advancing sustainable development.
While fsQCA effectively identifies successful outcomes, its capacity to unpack micro-level mechanisms is inherently limited. We recommend for future research to integrate fsQCA with process-tracing case studies or econometric methods to explore the mechanisms of linkages. In the future, we intend to examine the relationship between China’s financial inclusiveness and sustainable development level, and clearly distinguish the different paths of economic, social, and environmental dimensions.
Footnotes
Ethical Considerations
These considerations were not relevant for this study type.
Consent to Participate
This study did not involve human participants performed by any of the authors.
Author Contributions
All authors contributed to the study conception and design. Meina Zhou has made substantial contributions to conception and design, acquisition of data, analysis and interpretation of data, writing original draft preparation. Yiqun Sun has been involved in revising the manuscript and formal analysis. Hao Ji has also been involved in revising the manuscript, supervision, project administration and funding acquisition. All authors have read the published version of the manuscript and agreed to be accountable for all aspects of the work.
Funding
The authors disclosed receipt of the following financial support for the research, authorship, and/or publication of this article: Thank you for the financial support provided by the Social Science Foundation of Shaanxi Province (grant number: 2022D040); Fundamental Research Funds for the Central Universities (grant number: 2452024311); Natural Science Foundation of Shaanxi Province (2025JC-YBMS-818); Foundation of Shaanxi Federation of Social Sciences Associations (2025YB0363). And the authors would like to express their gratitude to EditSprings (![]() ) for the expert linguistic services provided.
) for the expert linguistic services provided.
Declaration of Conflicting Interests
The authors declared no potential conflicts of interest with respect to the research, authorship, and/or publication of this article.
Data Availability Statement
The data that support the findings of this study are available from the corresponding author Dr. Hao Ji upon reasonable request.