
Abstract
With the escalating global emphasis on sustainable development, Green Supply Chain Finance (GSCF) has emerged as a critical area of interest for academic researchers, industry practitioners, and policy makers alike. However, logistics companies, as significant contributors to greenhouse gas emissions within supply chains, have been underrepresented in credit risk assessment research. This paper bridges this research gap by constructing a comprehensive credit risk evaluation framework encompassing four critical dimensions: financial status, asset status, green development, and supply chain status. The system is evaluated using a sample of 131 listed logistics enterprises from 2016 to 2021. After applying principal component analysis for dimension reduction, both a Logistic regression model and a BP neural network model are trained. The BP neural network model possesses exceptional nonlinear mapping capabilities, effectively capturing complex interactions among variables and overcoming the limitations of traditional linear regression models. The empirical results demonstrate that green development and supply chain sustainability indicators significantly predict enterprise compliance rates across both modeling approaches. Furthermore, key metrics demonstrate that the BP neural network model exhibits superior predictive accuracy and reduced Type II error propensity relative to the Logistic regression model, thereby presenting a more robust analytical tool for financial institutions. This paper contributes to the advancement of GSCF by providing actionable insights for logistics enterprises, financial institutions, and policy makers to develop a more supportive and robust GSCF system.
Plain Language Summary
As global attention to sustainability grows, Green Supply Chain Finance (GSCF) is becoming more important to businesses, researchers, and policymakers. However, logistics companies—key players in supply chains and major sources of emissions—haven’t been studied enough when it comes to credit risk. This paper helps close that gap by analyzing data from 131 listed logistics companies between 2016 and 2021. It builds a credit risk evaluation system based on four areas: financial health, asset condition, green development, and supply chain performance. After simplifying the data, this paper tests two models to predict company risk: a traditional statistical model and an advanced machine learning model. The results show that green development and supply chain sustainability are important factors in predicting how reliable a company is. The advanced machine learning model performed better in identifying risky companies. These findings offer helpful guidance for logistics companies trying to improve, and for banks and policymakers working to build stronger green finance systems.
Keywords
Introduction
Supply chain finance (SCF) has emerged as a pivotal solution for alleviating financing constraints, particularly for small and medium-sized enterprises (SMEs) within a supply chain. Traditional SCF models primarily mitigate credit risk by leveraging the creditworthiness of core enterprises, the liquidity of collateral assets (e.g., accounts receivable, inventory), and the overall stability of the supply chain ecosystem (H. Song et al., 2021; Mou et al., 2018). Numerous studies have developed sophisticated risk assessment models in these traditional contexts, widely employing methods such as Logistic regression (H. Wang & Liu, 2025; S. Chen et al., 2022) and BP neural networks (J. Zhao & Li, 2022; Sang, 2021) to predict default probabilities using financial and operational indicators.
However, traditional SCF frameworks often overlook a critical dimension: environmental performance. This omission creates a significant blind spot, as it fails to account for the growing financial risks and opportunities associated with environmental regulations, consumer preferences, and the global sustainability transition.
In response to escalating environmental concerns and the push for sustainable development, Green supply chain finance (GSCF) has evolved as a strategic extension of traditional SCF. GSCF integrates environmental criteria into financial decision-making processes, aiming to allocate capital toward enterprises with strong environmental performance and incentivize green transformation across the supply chain (Liu et al., 2024c).
The advantages of GSCF are multifaceted. Firstly, it helps internalize environmental externalities. Companies committed to green practices often exhibit superior long-term viability, as they are less likely to face fines, reputational damage, or operational disruptions from environmental incidents (Atif & Ali, 2021). Secondly, GSCF can reduce financing costs for green enterprises. Financial institutions, recognizing their lower environmental risk profile, may offer them preferential lending rates (H. Sun et al., 2025). Thus, GSCF transcends its traditional role by not only improving capital allocation efficiency but also actively promoting environmental sustainability.
Three key research gaps are identified in existing studies. Firstly, while supply chain finance has garnered considerable research attention, risk assessment in green supply chain finance remains underexplored. Traditional credit evaluation systems typically focus solely on financial capability dimensions, such as the financing enterprise itself, core enterprises, the supply chain, and assets, without incorporating green development dimensions (Dai et al., 2024; Li et al., 2023; Liu et al., 2024b; Xiao et al., 2022). Secondly, existing studies on credit risk prediction in green supply chain finance are primarily concentrated on manufacturers and suppliers (Lai et al., 2023), neglecting logistics companies, which are significant emitters of greenhouse gases within the supply chain. Lastly, methodologically, although some studies have compared the performance of different models in predicting credit risk (Emin & Emin, 2025), many studies employ only a single model, thereby offering limited knowledge of model selection.
In response to these research gaps, this paper aims to construct a green supply chain finance credit risk evaluation system that considers the specific features of logistics companies. The evaluation system is tested using both Logistic regression and neural network models. By integrating green dimensions such as corporate environmental governance into the credit risk evaluation system for supply chain finance, this study makes both theoretical and practical contributions to establishing a comprehensive and robust credit risk evaluation system for green supply chain finance.
This study has three contributions: First, we develop a novel four-dimensional credit risk evaluation framework (financial, asset, green, and supply chain status) tailored to logistics enterprises, integrating green metrics to internalize environmental externalities and better reflect modern GSCF realities. Second, we empirically demonstrate the superior performance of BP neural networks over Logistic regression in predicting credit risk within GSCF, particularly in reducing Type II errors—critical for financial institutions—thus providing a reliable tool for risk decision-making. Third, we provide targeted recommendations for logistics enterprises to enhance environmental transparency, for financial institutions to refine their credit evaluation processes, and for policymakers to establish effective GSCF support mechanisms.
Construction of the Credit Risk Evaluation System
Signaling Theory in Green Supply Chain Finance
Signaling theory provides a powerful theoretical lens for understanding how enterprises communicate their unobservable quality to external parties in situations of information asymmetry (Spence, 2002). In financial markets, this asymmetry is particularly acute, as lenders struggle to distinguish between high-risk and low-risk borrowers. High-quality firms thus have an incentive to send credible “signals” to demonstrate their lower risk profile and superior prospects, thereby gaining access to capital on more favorable terms.
Within the context of supply chain finance (SCF), traditional signals have primarily revolved around financial health (e.g., profitability, solvency) and asset quality (e.g., collateral value of inventory and receivables; Mou et al., 2018). The reputation and creditworthiness of core enterprises in the supply chain also serve as a critical positive signal for smaller partners (H. Song et al., 2021). However, in the evolving landscape of sustainable development, these traditional signals are increasingly insufficient.
The emergence of Green supply chain finance (GSCF) introduces a new class of signals that are increasingly pivotal in credit assessment. Enterprises engaged in green practices (e.g., obtaining environmental certifications, disclosing emission data, investing in green patents) send a powerful signal to financial institutions. This signal conveys multiple positive attributes, including long-term viability, management quality, operational efficiency, and market competitiveness (Hlynskyy & Maliar, 2025).
Therefore, green indicators act as a credible signal because they are often costly to imitate, separating truly sustainable firms from those merely engaged in “greenwashing” (Judijanto et al., 2024; Srivastava, 2007). Concurrently, supply chain stability itself functions as a robust signal. Indicators such as low customer and supplier concentration, and long-term contracts signal a resilient and diversified business model. A stable supply chain reduces operational risk, ensures consistent cash flow, and indicates strong relational capital—all of which are highly valued by lenders (Qiao & Zhao, 2023).
For logistics enterprises—a sector central to supply chain operations yet often perceived as high-risk due to asset intangibility and environmental impact—actively sending these signals becomes a strategic imperative. By demonstrating robust environmental performance and embeddedness within a stable supply network, they can effectively differentiate themselves from competitors and alleviate financiers’ concerns.
Guided by signaling theory, this paper argues that a comprehensive credit risk evaluation system must move beyond traditional financial metrics to incorporate these novel and highly informative signals. Consequently, we construct a novel four-dimensional indicator system that captures not only the conventional signals of financial status and asset status but also the critical modern signals of Green development (environmental governance, disclosure, innovation) and supply chain status (stability, concentration, relationships). This framework is designed to decode the full spectrum of signals sent by logistics enterprises, providing a more holistic and accurate assessment of their true creditworthiness in the era of green supply chains.
Credit Risk Evaluation Indicator System
Informed by signaling theory, we identify four key dimensions that encapsulate the most credible signals of creditworthiness for logistics enterprises in GSCF. Financial status (Liu et al., 2024c; S. Chen et al., 2022), asset status (H. Wang & Liu, 2025), and green development status (Liu et al., 2024c; Y. Zhao & Chen, 2022) of financing enterprises are critical predictors of their credit risk in green supply chain finance. Additionally, the overall supply chain status, which serves as the macro environment, also impacts their credit risk level (Liu et al., 2024c; S. Chen et al., 2022; Zhang et al., 2021). Therefore, these four factors should be considered when constructing a credit risk evaluation indicator system.
Financial Status
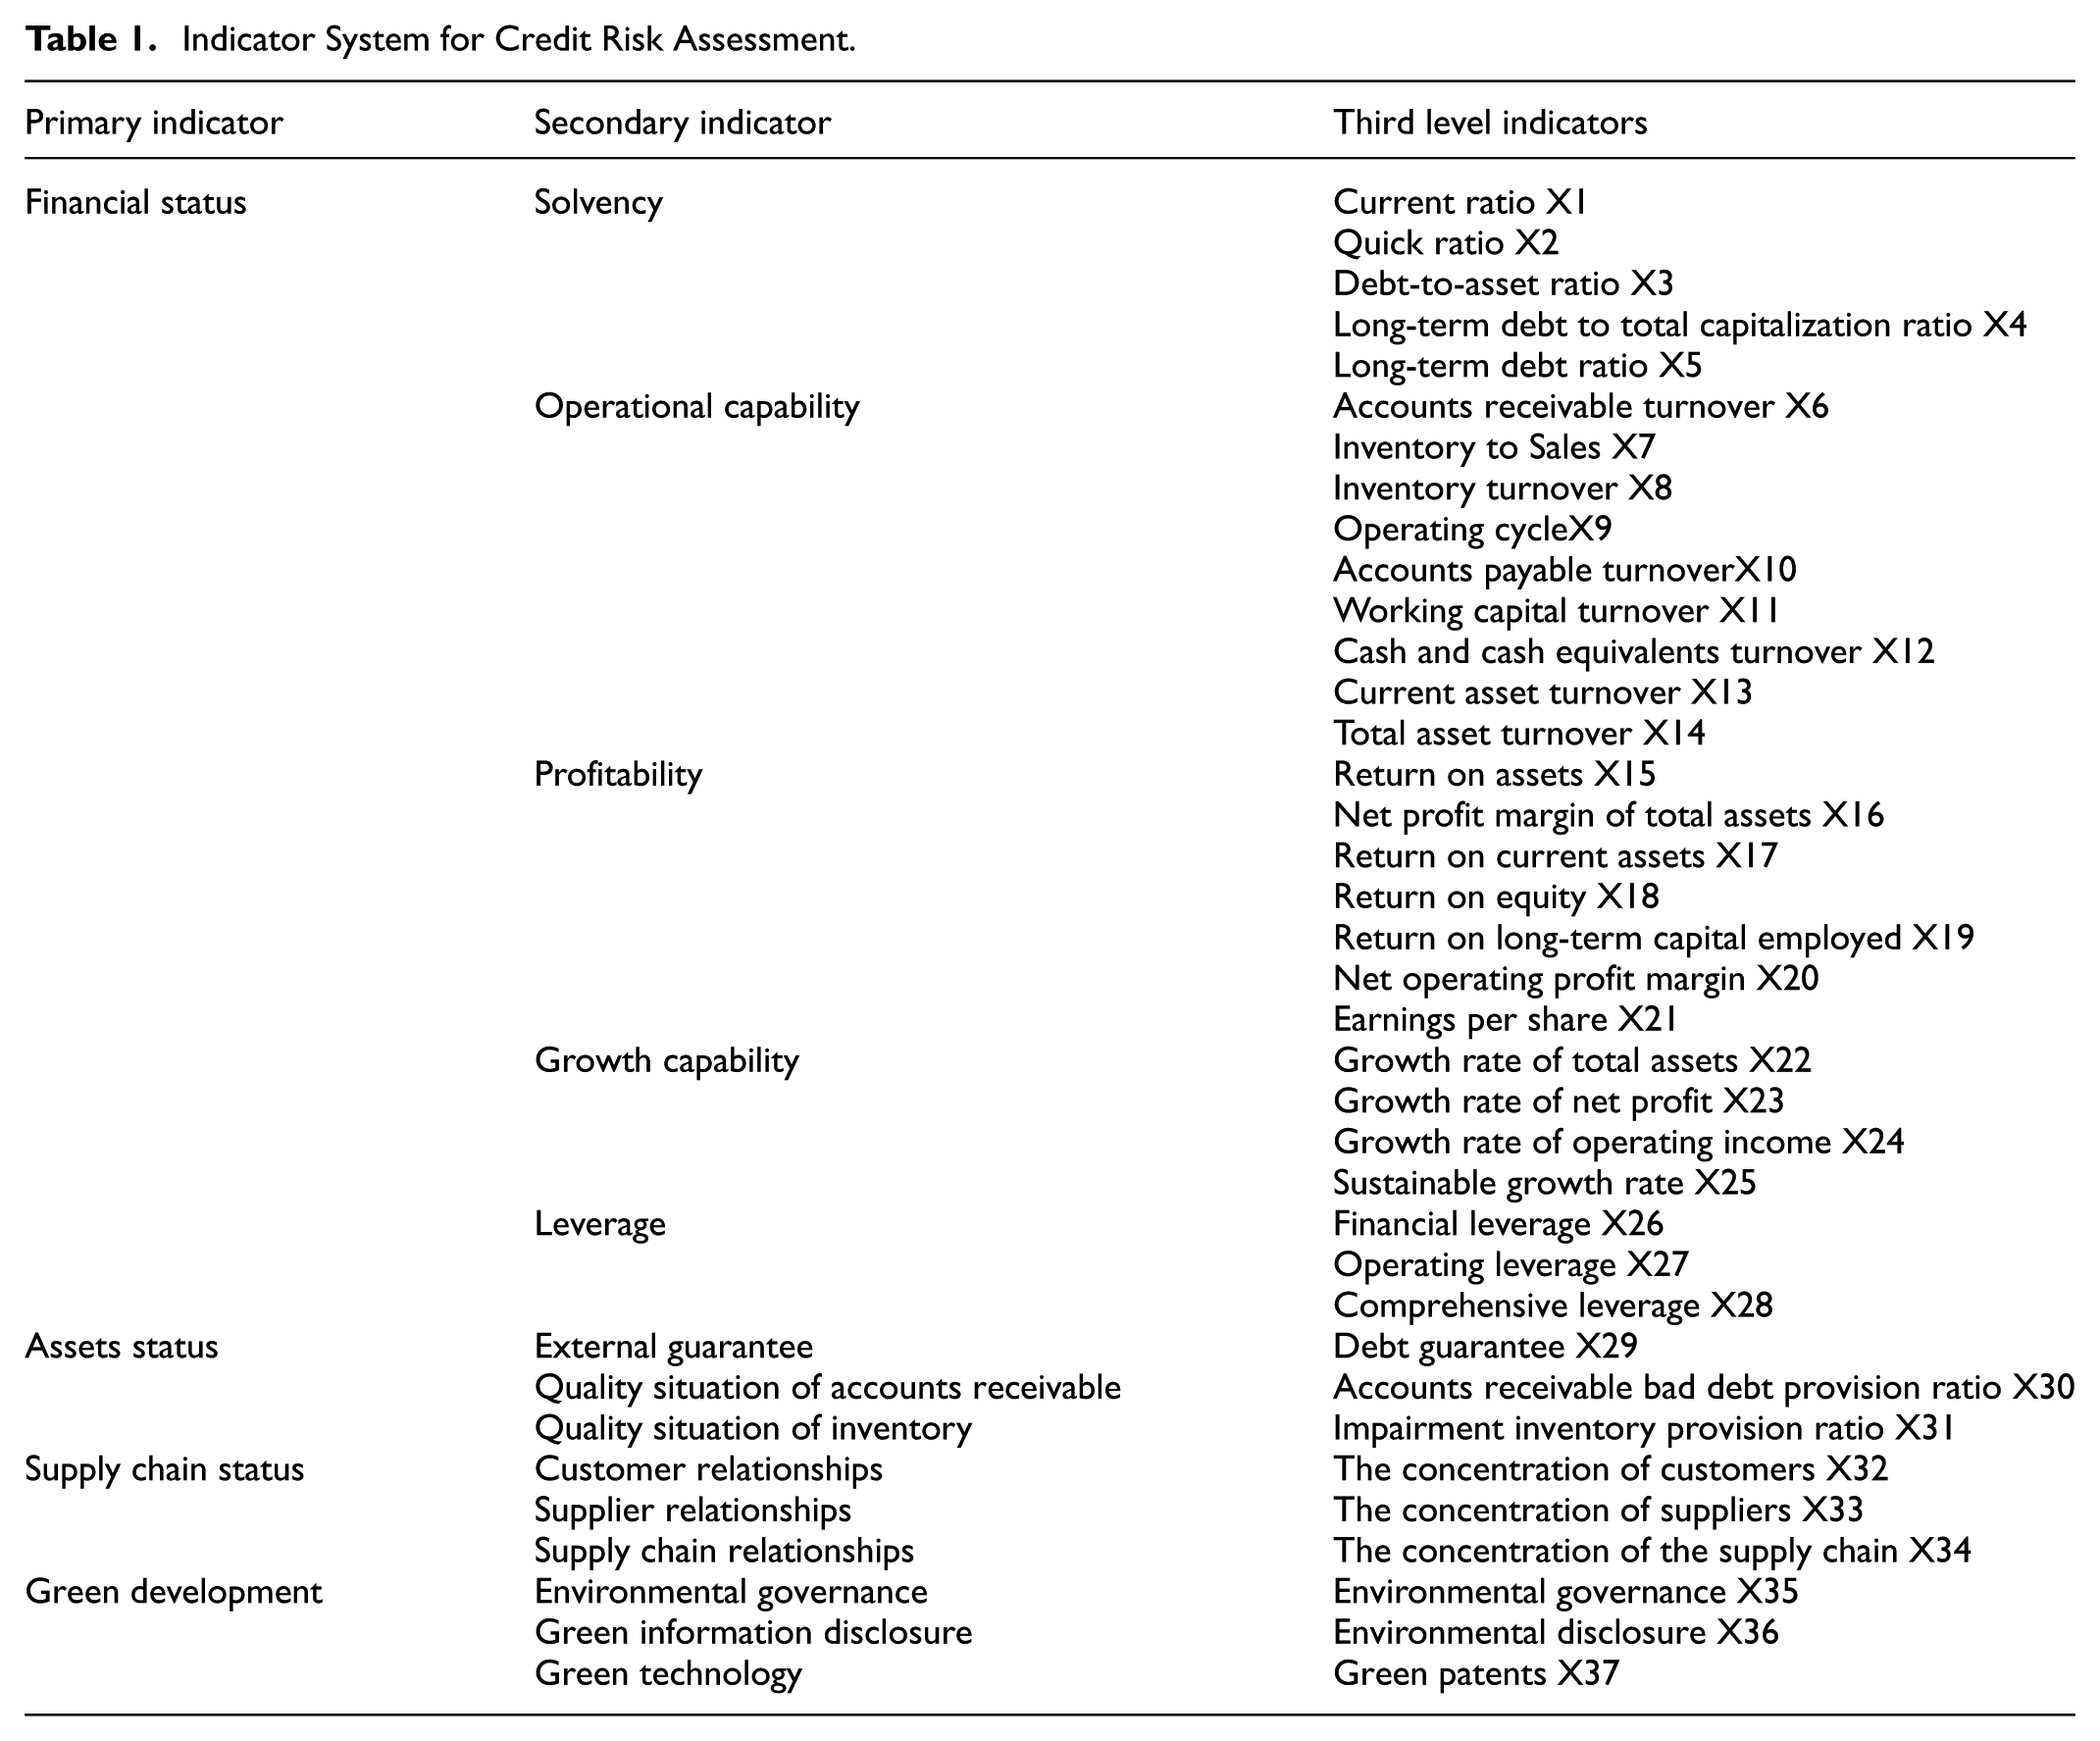
Financial indicators are essential for measuring the credit risk level of enterprises. This paper draws on current research and selects indicators of solvency, operational capacity, profitability, growth capacity, and leverage as measures of the logistics enterprises’ financial status (Zhong & Wu, 2020).
Asset Status
In green supply chain financing, enterprises can use assets such as inventories and receivables to repay loans when they are unable to meet their obligations. This approach helps reduce bad debt losses for investors and lowers the default risk. This paper selects the quality of inventory, the quality of receivables, and the status of external guarantees as indicators for the asset status of financing enterprises.
Green Development
In a green supply chain, investors assess the green development status of financing enterprises and offer more favorable financing terms to companies committed to green transformation. Consequently, green development can enhance an enterprise’s financing capacity and reduce its default risk. This paper selects environmental governance, green information disclosure, and the adoption of green patents as indicators for measuring the green development status of enterprises.
Supply Chain Status
Financing institutions usually measure the overall status of the supply chain through factors such as supplier concentration, customer concentration, and the duration and frequency of enterprise cooperations within the supply chain. Higher concentration and longer, more frequent cooperations indicate higher supply chain stability. This paper selects customer concentration, supplier concentration, and overall supply chain concentration as indicators for measuring the supply chain status.
Following the principles of hierarchical structure, comprehensiveness, operability, and specificity, this paper constructs the indicator system as shown in Table 1.
Indicator System for Credit Risk Assessment.
Selection of Samples
This study focuses on logistics enterprises. Referencing Kang et al. (2024) and Liu et al. (2024a) and the 2017 version of the “Guidelines on Industry Classification of Listed Companies” by the China Securities Regulatory Commission (CSRC), this paper selects 131 A-share listed enterprises in the transportation, warehousing, and postal industries as the research sample. Systematic environmental information disclosure and green finance mechanisms in China’s capital markets became formally standardized after 2016, driven by enhanced regulatory policies. The introduction of specific environmental reporting rules and green finance frameworks during this period ensured greater data availability and consistency (Table 2). Selecting data from 2016 onward effectively mitigates issues such as missing or unreliable pre-reform observations, thereby strengthening the validity of our “green development” measures. Moreover, the COVID-19 pandemic caused atypical disruptions in global supply chains and corporate financing conditions, introducing significant noise into financial and operational risk variables. Including pandemic-affected data could impair the identification of causal relationships between key variables. Thus, limiting the sample period to 2016 to 2021 preserves sample purity and reduces exogenous contamination. Furthermore, companies under special treatment (ST)—typically indicating financial distress or delisting risk—are excluded from the sample. Such firms exhibit significantly different financial and risk profiles compared to ongoing enterprises, and their inclusion could distort model training and impair the generalizability of the findings. This practice is consistent with common approaches in corporate credit risk research (e.g., Dai et al., 2024; Liu and Zheng, 2024). Although this may introduce a certain degree of survivorship bias, the study primarily aims to construct a credit risk assessment framework for enterprises under sustainable operating conditions, and the exclusion of ST companies thereby helps enhance the model’s explanatory power and applicability under normal operating environments. Ultimately, after excluding ST companies and outliers, 672 valid observations are obtained, and we confirm that all firm-level data used in this study are from publicly accessible sources and no confidential information has been disclosed.
Policies on Environmental Information Disclosure and Green Finance in China (2016).

This paper adopts the average interest-bearing debt ratio (57.8%) from the Enterprise Performance Evaluation Standard Value—published by China’s State-owned Assets Supervision and Administration Commission (SASAC)—as the benchmark for classifying default risk levels (X. Z. Chen & Tao, 2021). As an authoritative reference for enterprise performance evaluation in China, this standard is widely used in corporate regulation, performance assessment, and risk management. The “average standard value” represents the industry median and naturally provides a reasonable threshold for distinguishing between “average risk” and “relatively high risk.” Moreover, the application of this method is also supported by existing research (X. Z. Chen & Tao, 2021), further validating its rationality. Based on this criterion, logistics enterprises with an interest-bearing debt ratio higher than the average value are classified as high default risk (assigned a value of 0), while those with a ratio lower than the “lower standard value” are defined as low default risk (assigned a value of 1). For simplicity, the terms “default” and “compliance” are used to denote high and low default risk, respectively.
This paper employs content analysis to quantify two indicators, environmental governance and green information disclosure (Y. Yang et al., 2024). However, the data acquisition process was refined. Instead of manually analyzing corporate reports, the data were directly sourced from the corresponding fields in the CSMAR database—a leading Chinese economic and financial research database—and the final scores were generated according to its coding rules.
In the environmental governance dimension, eight standards are established, ranging from whether the enterprise has implemented an environmental management system to whether it is certified under ISO9001. Each satisfied standard earns a score of 1, resulting in a maximum score of 8 and a minimum score of 0.
In the green information disclosure dimension, six standards are set, covering whether the enterprise disclosed information on waste disposal and whether it disclosed the implementation status of clean production. Green information disclosure receives a score of 2 for each standard with quantitative descriptions (monetary/numerical), 1 for each standard with qualitative descriptions, and 0 for no description, yielding a maximum score of 12 and a minimum score of 0. The detailed evaluation standards are presented in Table 3.
Grading Standards of Environmental Governance and Environmental Disclosure.

Optimization of the Green Supply Chain Finance Indicator System
The greater the number of input variables, the lower the training speed and efficiency (X. Song et al., 2023). Therefore, this paper employs principal component analysis (PCA) using IBM SPSS Statistics 23.0 (IBM Corp., Armonk, NY, USA) to reduce the dimensionality of the indicators. Since we intend to treat the number of green patents as an independent indicator to observe its predictive power for enterprise credit risk, it was not included in the dimensionality reduction process.
To assess the suitability of the data for principal component analysis (PCA), we conducted the Kaiser-Meyer-Olkin (KMO) test and Bartlett’s test of sphericity. The KMO value was 0.688, indicating that the data were suitable for factor analysis. Bartlett’s test was significant (χ2 ≈ 24093.21, p < .001), supporting the factorability of the data.
Consequently, PCA is conducted on the remaining 34 indicators to extract principal components. As shown in Figure 1 and Table 4, the scree plot and the rotated component matrix indicate that 11 factors can be extracted from the 34 indicators. The 11 extracted components explained a cumulative variance of 73.81%, which is considered adequate for dimensionality reduction. Therefore, this paper performs model training using the 11 extracted principal components and the green patent indicator (defined as F12).

Scree plot of principal component analysis.
Rotated Component Matrix.

Based on the factor loading coefficients in Table 4, the factors can be interpreted as follows: F1 represents profitability-related indicators of logistics enterprises; F2 represents solvency-related indicators; F3 represents operational capacity-related indicators; F4 represents supply chain relationship-related indicators; F5 represents leverage-related indicators of enterprises; F6 represents operational status-related indicators; F7 represents environmental protection-related indicators of enterprises; F8 represents debt guarantee-related indicators; F9 represents growth capacity-related indicators; F10 represents accounts receivable turnover; F11 represents inventory write-down reserve ratio. Both F10 and F11 reflect the status of pledged assets.
Empirical Analysis
Construction of the Logistic Regression Model
In the field of credit risk evaluation for supply chain finance, logistic regression models are widely used. There are two Logistic regression models: binary logistic regression and multinomial logistic regression. The binary logistic regression model’s dependent variable takes two fixed values, while the multinomial logistic regression model’s dependent variable takes multiple fixed values. In this paper, the dependent variable takes two values: 0 represents default and 1 represents compliance. Therefore, a binary logistic regression model is used.
Logistic Regression is a mature forecasting approach for predicting the credit risk of listed companies in various regions and industries (Chang et al., 2023; Chi et al., 2022). Since supply chain finance has attracted increasing research interest, logistic regression models are also adopted to predict the credit risk in supply chain finance (H. Wang & Liu, 2025), especially the credit risk of SMEs in modes of online supply chain (S. Chen et al., 2022), the Internet of Things (Abbasi et al., 2019), blockchain-driven supply chain finance (Xiao et al., 2022).
Logistic regression models offer the advantages of strong interpretability and compliance with financial risk control and regulatory requirements. First, credit risk assessment in the financial sector requires not only knowing the outcome but also understanding the decision-making process and key influencing factors. Logistic regression models output the probability of an event occurring (such as default), and the coefficients of their independent variables have clear statistical significance. This means we can directly answer questions like “By how much does the probability of default decrease for each unit increase in ESG score?” Second, this transparency is crucial for financial institutions to justify credit decisions to regulators, risk management departments, and even the enterprises themselves, thereby fulfilling compliance audit requirements.
The logistic regression model can be built as follows:
In logistic regression, the dependent variable is a logit, representing the natural log of the odds.

The logit is assumed to be a linear function of independent variables. Suppose there are k variables influencing the dependent variable. the model can be expressed as

where

Now we have the odds on the left-hand side of the equation. To convert odds to probability, Equation 3 can be rearranged as

The Logistic regression model is known for its robustness. It applies an S-shaped function, Equation 5,

To the output of a linear regression, making the predicted values converge between 0 and 1, thus representing compliance probabilities. The closer the p value is to 1, the lower the likelihood of default.
Construction of the BP Neural Network Model
Due to its exceptional performance in classifying complex patterns and mapping multi-dimensional functions, the backpropagation neural network (BP Neural Network) is widely utilized among various machine learning models (H. Zhao, 2023). The BP neural network approach has emerged as a strong alternative method to predict financial risk (J. Wang & Xie, 2020; K. Liu et al., 2023; X. Song et al., 2023; X. Sun & Lei, 2021; Z. Liu et al., 2022). This approach is also applied to modeling credit risk in supply chain finance (Fu et al., 2022; J. Zhao & Li, 2022; Sang, 2021; Y. Wu et al., 2022; Ye & Xiu, 2023). Few scholars adopted the BP neural network for green supply chain cooperation credit evaluation and found that the BP neural network helps mitigate issues of slow or premature convergence and improves data search accuracy (J. Chen & Huang, 2021).
The BP Neural Network Model possesses robust nonlinear fitting capabilities. Green supply chain financing credit risk involves multidimensional indicators spanning financial, environmental, social, governance (ESG), and supply chain operational metrics. Complex, nonlinear interactions may exist among these factors. By employing multiple hidden layers and nonlinear activation functions (e.g., Sigmoid), the BP neural network can automatically learn and model these intricate nonlinear relationships without requiring manually defined interaction terms. This capability is crucial for handling the intricate data patterns encountered in real-world scenarios.
A BP neural network typically includes an input layer, one or more hidden layers, and an output layer. Under given conditions, a neural network with a three-layer structure can approximate any mapping relation to any precision. Figure 2 shows the topology of the BP neural network model:

Model structure of BP neural network.
This model simulates the pattern of human neural networks, continually training on sample data and adjusting network weights and thresholds to minimize the error measure in the negative gradient direction.
The error function is
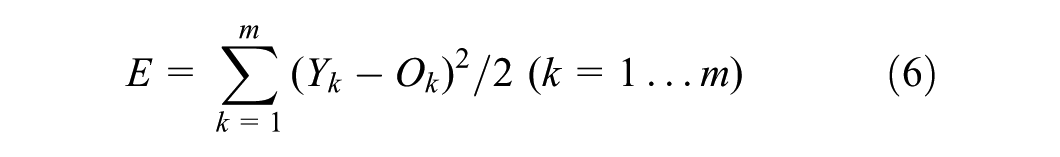
where
Therefore, the fundamental mechanism of BP neural network is to minimize the error between the output value and the expected value to optimize the model’s performance. This process helps the model approach the expected value of output, leading to optimal classification results.
The number of input layer nodes equals the number of independent variables. This paper uses 11 factors extracted through PCA and the adoption of green patents as independent variables, thus setting the number of input layer nodes to 12.
The number of output layer nodes depends on the classification of the dependent variable. Our dependent variable is a dummy variable, defining whether the enterprise has credit risk, so the number of output nodes is set to 2.
The number of hidden layers should serve the research needs. More hidden layers do not always show better prediction accuracy. Drawing on existing research that uses BP neural networks to predict corporate credit risk, this paper set the number of hidden layers to 1 (X. Song et al., 2023). Besides, there is no unified standard for the number of hidden layer nodes. Existing research generally uses the following formula to determine the number of hidden layer nodes:

I is the number of input layer nodes, O is the number of output layer nodes, and C is a random number ranging from
BP neural network is good at handling nonlinear relationships. We use a Sigmoid function

as the activation function for both the hidden and output layers to train our model. This formula, due to its applicability in handling probability issues, has been widely used in many studies predicting corporate credit risk (Li et al., 2023; X. Song et al., 2023).
Logistic Regression Model Results
The Hosmer-Lemeshow test is widely used to evaluate the goodness-of-fit of Logistic regression models, especially risk prediction models (Cao et al., 2025; Chi et al., 2022; Zhou et al., 2021). If the p-value of the Hosmer-Lemeshow test is lower than the threshold (p = .05), the null hypothesis that the model is a good fit is rejected.
As shown in Table 5, the p-value of the Hosmer-Lemeshow test is .235 (p = .235 > .05), indicating that the information from the variables is adequately reflected in the Logistic regression model and that there is no evidence suggesting the model is a poor fit.
The Results of Hosmer-Lemeshow Test.

As shown in Table 6, variables F2, F3, F4, F7, F8, and F11 are significant at the 5% significance level, while F5 and F10 are significant only at the 10% significance level. This paper choses 5% as our tolerance for Type I error, so variables with p-values higher than .05 are eliminated, retaining six variables in the regression equation:

Logistic Regression Model Results.

Since 0 in the dependent variable represents default and 1 represents compliance, P can be interpreted as the compliance rate. In Table 6, the regression coefficients for F3, F4, F7, and F11 are positive and significant at the 10% significance level, suggesting that these factors are positively associated with the compliance rate. The size of their influence, in descending order, is operational capability, inventory write-down reserve ratio, supply chain stability, and environmental protection. Conversely, the coefficients for F2, F5, F8, and F10 are negative, indicating that these factors are negatively related to the compliance rate. The size of their influence, in descending order, is solvency, debt guarantee situation, leverage level and accounts receivable turnover.
However, the coefficients of F1, F6, F9, and F12 are insignificant at the 10% significance level, suggesting that profitability, operational status, growth capacity, and green patents have no clear relationship with the compliance rate. This insignificance offers intriguing insights into the logistics sector. Firstly, the lack of significance for profitability (F1) and growth (F9) may reflect the industry’s inherent characteristics of high competition and low profit margins (Shi et al., 2020). Strong profitability or aggressive growth may not necessarily translate into lower default risk if achieved through increased financial leverage. Secondly, the insignificant coefficient for green patents (F12) suggests a potential time lag; the substantial R&D investments required may initially strain finances, with the risk-mitigating benefits materializing only in the longer term, beyond the scope of our current assessment window. Finally, the operational status metric (F6), heavily influenced by inventory turnover, may be less critical for asset-light logistics service providers compared to manufacturers, potentially explaining its diminished role across our broad sample.
The regression results indicate that financial indicators have a significant impact on the default risk of logistics enterprises. Solvency indicators, such as the debt-to-asset ratio, are directly related to the level of credit risk (p = .000 < .05). Indicators reflecting green development, including environmental governance and disclosure, are significantly positively associated with the compliance rate (p = .031 < .05), suggesting that green development is inversely related to default risk. This negative relationship may arise from increased profitability, greater performance stability, and lower cost of debt (Atif & Ali, 2021; Meles et al., 2023). Furthermore, supply chain-related indicators that represent supply chain stability are significantly positively correlated with the compliance rate (p = .009 < .05). The finding suggests that, although a more concentrated supply chain network structure tends to entail higher dependency risks, the associated stability can foster relational benefits, thereby reducing the default risk (Xu et al., 2024).
BP Neural Network Model Results
The sample companies were divided into training and test data in a 7:3 ratio, with 451 training samples (67.1%) and 221 test samples (32.9%). The detailed parameters and operational settings of the model are as follows. In the architecture settings, the number of hidden layers was set to one, and the number of units was automatically determined by the system. The activation function for the hidden layer was set to Sigmoid, and the output layer activation function was also set to Sigmoid. The training type was set to Batch; the optimization algorithm was set to standard conjugate gradient. In the training options, the initial Lambda value was .0000005, and the initial Sigma value was 0.00005. The stopping rule was set to terminate if the error did not decrease for 1 consecutive step(s). The data used for calculating the prediction error were automatically selected by the system.
Figure 3 shows that the model has 12 input nodes, representing 11 principal components and the green patent variable. The hidden layer has eight nodes, which is the optimal number determined by the system based on configured parameters. The output layer has two nodes, representing two classifications of the dependent variable. Dark solid lines indicate synaptic weights less than 0, representing a negative correlation between nodes, while light solid lines indicate synaptic weights greater than 0, representing a positive correlation.

Neural network structure of credit risk assessment system.
Figure 4 shows the normalized importance of each variable in the model, with the influencing factors ranked in descending order: F3 (operational capability), F2 (solvency), F8 (debt guarantee), F11 (inventory write-down reserve ratio), F9 (growth capability), F7 (environmental protection), F6 (operational situation), F5 (leverage situation), F10 (accounts receivable turnover), F4 (supply chain status), F12 (green patents), and F1 (profitability). The importance levels of F7 and F4 are 48.2% and 40.8%, respectively, indicating that environmental protection and supply chain stability are both significant predictors for corporate default risk.

Normalized importance of factors.
It is noteworthy that the BP-NN assigns relatively low importance to green patents. This may be attributed to the limitation of using the number of green patents as a proxy variable, which fails to fully capture qualitative aspects such as technological substance (Aghion et al., 2016). Moreover, the benefits of green technological innovation often materialize in the medium-to-long term (Hunjra et al., 2024). However, since the model designed in this study only captures the impact of current-period independent variables on current-period dependent variables, the full effect of green innovation may not yet be reflected. Nevertheless, we emphasize that green innovation remains a vital component of sustainable development, and its role in credit risk assessment is anticipated to become more prominent as green finance mechanisms evolve.
Comparison of Logistic Regression and BP Neural Network Prediction Results
Sensitivity refers to the percentage of defaulting enterprises that the model correctly identifies as defaulting, while specificity refers to the percentage of non-defaulting enterprises correctly identified as non-defaulting. According to Table 7, the logistic model’s sensitivity and specificity are 76% and 76.3%, respectively, with an overall classification accuracy of 76.2%. The model’s balanced performance is further confirmed by its receiver operating characteristic (ROC) curve analysis. According to Table 8, the area under the curve (AUC) reaches 0.831, which falls into the excellent range, indicating a high overall discriminatory power beyond a single arbitrary threshold. Therefore, the Logistic model demonstrates a robust and acceptable performance in distinguishing between defaulting and non-defaulting enterprises.
Confusion Matrix of Logistic Regression Model.

Area Under the ROC Curve (Logistic Regression).

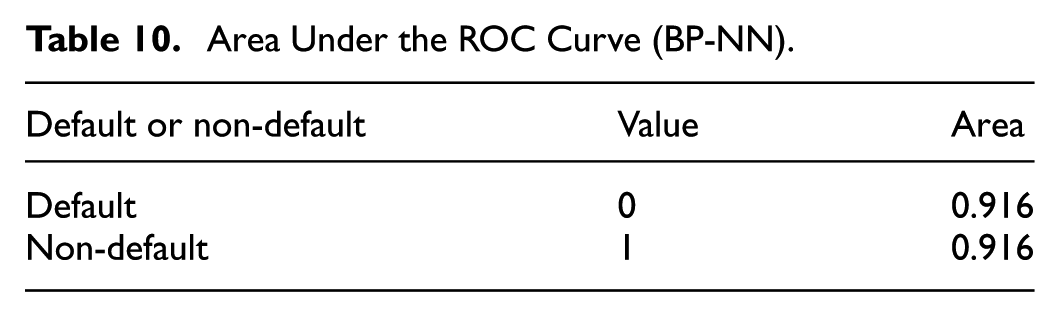
According to Table 9, the BP neural network model has a sensitivity of 78.8% and a specificity of 76.9%, with an overall accuracy of 77.8%. To provide a more comprehensive comparison of the two models’ discriminatory power, we evaluated their ROC curves and calculated the corresponding AUC values. As illustrated in Figure 5, and compared alongside the Logistic model’s ROC curve in Figure 6, the BP neural network model achieved an AUC of 0.916. This exceeds the Logistic model’s AUC of 0.831.
Confusion Matrix of BP Neural Network Model.


ROC curve of BP neural network.

ROC curve of logistic regression.
Comparing the prediction results of the two models, the neural network model’s accuracy is 1.6 percentage points higher than that of the logistic model, demonstrating a slight advantage. Additionally, the BP neural network model exhibits higher sensitivity and specificity, and crucially, a higher AUC value. The AUC metric, which evaluates the model’s ability to separate the two classes across all possible thresholds, confirms that the neural network model possesses superior overall discriminative power. This indicates that the neural network is not only more accurate but also more robust and reliable in distinguishing between defaulting and non-defaulting enterprises. Therefore, the neural network model is more suitable for predicting green supply chain financial credit risk in the logistics industry (Table 10).
Area Under the ROC Curve (BP-NN).
For financial institutions, the type I error is identifying good customers as bad customers and rejecting their loan applications. This can lower the institutions’ profit. Conversely, the type II error happens when bad customers are identified as good ones and get the loan, which may increase the bad debt ratio of financial institutions. In the logistic regression model, among 338 companies without default risk, 81 were incorrectly identified as having risk, resulting in a 24% likelihood of a type I error. Seventy-nine out of 334 companies with default risk were misclassified as risk-free, resulting in a 23.7% likelihood of a type II error. Similarly, the BP neural network model has a 23.1% likelihood of making a type I error and a 21.2% likelihood of making a type II error, indicating that the Logistic regression model is more prone to both type I and type II errors.
Existing research suggests that the danger of misclassifying bad customers as good ones is far greater than the danger of misclassifying good customers as bad ones (Huang et al., 2018). Therefore, the BP neural network model shows better performance than the Logistic regression model by demonstrating a lower likelihood of making a type II error. This superior performance may be due to the BP neural network’s suitability for large sample analysis. This study covers 672 research samples with numerous indicators, allowing the BP neural network model to fully leverage its advantages.
Robustness Checks
Alternative Train/Test Splits
To further verify the model’s sensitivity to the initial data partitioning method and enhance the robustness of the research conclusions, supplementary analyses were conducted using different train-test split ratios. In addition to the primary 7:3 split used in the main analysis, the model’s performance was evaluated under two additional split ratios: 6:4 and 8:2. To ensure comparability, the same data preprocessing and modeling procedures were applied.
The results (see Table 11) indicate that the BP neural network model maintained stable predictive performance across different data splits. Specifically, the overall accuracy remained above 76.2%, and the AUC values stayed above 0.831. This consistency demonstrates that the model is robust across different train-test set partitions and does not overly rely on one specific data division approach.
Alternative Train/Test Splits.

Sensitivity Test
Although a threshold widely used in the literature was adopted to define credit risk, this threshold may involve a degree of subjectivity or context dependence. To examine the robustness of our research conclusions, a sensitivity test was conducted by adjusting the critical value for risk definition to observe whether the core results remained stable. We adopted two alternative cut-offs (±5% from the original benchmark), which is a common practice in empirical studies. Ultimately, the core experimental results remained largely consistent; detailed results are provided in the Appendix.
Conclusions and Implications
Conclusions
The findings of this paper reveal that, within the context of green supply chain finance, the construction of a credit risk evaluation system for logistics enterprises should incorporate not only traditional metrics such as operational status, profitability, solvency, credit risk of core enterprises, and supply chain stability but also indicators that measure the level of green development. The integration of green development indicators serves to internalize the externalities associated with green transformation. This is particularly relevant as financial institutions are inclined to offer more favorable financing conditions to enterprises that comply with established environmental standards. Consequently, the pursuit of green development can significantly enhance an enterprise’s financing capabilities.
Our empirical findings contribute to and extend the existing literature in several important ways. First, the significant positive impact of green development indicators (F7) on compliance rates empirically supports the theoretical propositions of Judijanto et al. (2024) and Srivastava (2007), providing quantitative evidence that environmental stewardship is not merely a cost center but also a positive signal of creditworthiness that lowers default risk, likely through enhanced profitability and operational stability as suggested by Meles et al. (2023). Second, our finding that supply chain stability (F4) is a critical predictor aligns with and strengthens the work of Qiao and Zhao (2023), demonstrating that strong supply chain relationships mitigate information asymmetry and act as a tangible risk-mitigating factor for lenders. Finally, the superior performance of the BP neural network model, particularly in minimizing type II error, echoes the findings of Emin & Emin (2025) on the efficacy of AI in risk assessment and represents a methodological improvement over the traditional Logistic models commonly employed in earlier SCF studies (e.g., S. Chen et al., 2022).
Practical Implications
First, logistics companies should invest in green transformation by attracting specialized talent, adopting advanced green technologies, and optimizing operational processes to improve environmental ratings and secure better financing terms. Furthermore, these companies should proactively disclose comprehensive green-related information, including metrics on clean energy utilization, investments in environmental technologies, and carbon emission reduction data, to provide transparent and accurate information to financing institutions. For logistics enterprises, our empirical results provide actionable guidance for logistics firms. Given that improving environmental performance (F7) by one standard deviation increases the odds of compliance by 22.8%, managers should frame investments in green technologies not merely as CSR efforts, but as strategic tools to reduce financing costs.
Second, logistics companies should actively foster collaboration within their supply chains and engage in joint risk management strategies with core enterprises to navigate market uncertainties effectively. A stable and well-coordinated supply chain signals low risk to financial institutions, making it easier for companies to secure more favorable loan terms and improve their debt repayment capacity.
From a policy perspective, governments should address information asymmetry by establishing a centralized big data platform dedicated to green information sharing. This platform should facilitate seamless data integration among the central bank’s credit system, bank credit systems, and enterprise ERP platforms, thereby improving the availability and traceability of green-related data. Such measures would mitigate adverse selection issues in supply chain finance. Furthermore, financial institutions should calibrate their credit evaluation frameworks according to differing risk appetites. Traditional banks, which are typically more risk-averse due to their deposit-based structure, may assign greater weight to financial stability indicators (e.g., solvency [F2], leverage [F5]) and asset quality (e.g., inventory write-down ratio [F11]) when evaluating loan applications. Their primary concern is capital preservation and predictable repayment. In contrast, non-bank financial institutions (e.g., venture capital, green funds, or supply chain finance companies), which often have a higher tolerance for risk in pursuit of higher returns, might place more emphasis on growth potential and sustainability performance. They could prioritize indicators like green technology adoption (F12: Green Patents), environmental governance (F7), and operational capability (F3), as these signal long-term viability and alignment with sustainable investment principles. This differentiated approach allows each type of institution to align its credit evaluation with its strategic objectives and risk profile.
Third, governments should develop and implement industry standards and supportive policies for green supply chain finance. This includes the formulation of standardized corporate social responsibility (CSR) reporting guidelines and the establishment of a unified third-party green information assessment system. These initiatives would ensure the consistency, reliability, and credibility of green performance ratings across the industry.
Limitations and Further Research
Although this study provides valuable insights into credit risk assessment for logistics companies within Green supply chain finance (GSCF), it has several limitations that also suggest directions for future research.
First, this study focuses on listed logistics companies in China. Although the sample offers high-quality and standardized data, it may not fully represent the broader population of small and medium-sized enterprises (SMEs), which often face more severe financing constraints and information opacity. Therefore, the findings may have limited generalizability to private SMEs. Future studies could collect data from non-listed SMEs through surveys or field research to develop a more inclusive evaluation framework. Exploring alternative data sources—such as digital footprints or operational data from logistics platforms—to assess the credit risk of SMEs is a promising direction.
Second, despite improvements in the measurement of green development indicators, the study still heavily relies on self-reported corporate disclosures (e.g., annual reports, CSR reports). This approach is susceptible to greenwashing, where companies may exaggerate their environmental performance. Future research could enhance the objectivity of these indicators by incorporating hard performance data, such as actual carbon emission data from life-cycle assessments, real-time energy consumption data from IoT sensors, or green certifications from authoritative third parties.
Third, the model developed in this study adopts a static approach, while supply chain credit risk is inherently dynamic. Credit risk in supply chains can be affected by external macroeconomic shocks, such as global pandemics, trade wars, or changes in environmental regulations. Future research could develop a dynamic early-warning system that incorporates time-series analysis or uses panel data to model how risk profiles evolve over time and in response to external events.
Footnotes
Appendix
Robustness Test: Cut-Offs +5% from the Original Benchmark (Model Comparison).

| Model | Accuracy (%) | Sensitivity (%) | Specificity (%) | AUC |
|---|---|---|---|---|
| Logistic | 74.1 | 67.6 | 79.2 | 0.832 |
| BP-NN | 84.7 | 87.4 | 82.2 | 0.922 |
Ethical Considerations
This article does not contain any studies with human or animal participants.
Consent to Participate
There are no human participants in this article and informed consent is not required.
Author Contributions
Funding
The authors disclosed receipt of the following financial support for the research, authorship, and/or publication of this article: This work was supported by Humanity and Social Science foundation of Ministry of Education of China [grant no.3YJA630095]; Key Project Funding from Beijing Social Science Fund [grant no. 20GLA011].
Declaration of Conflicting Interests
The authors declared no potential conflicts of interest with respect to the research, authorship, and/or publication of this article.
Data Availability Statement
The data that support the findings of this study are available from the corresponding author, [ZYC], upon reasonable request.