
Abstract
While AI is often presumed immune to human behavioral biases like herding, existing literature lacks insights into whether AI-driven funds exhibit herding, their nature, and how they perform under different market conditions—a critical gap for asset management. To address this, we use a modified Lakonishok, Shleifer, and Vishny (LSV) model on CRSP database data to empirically compare the investment patterns of the AI-Powered Equity ETF (AIEQ) with institutional investors. Our key findings are: (1) AI-driven funds do engage in herding, but this is not irrational imitation—instead, it is “informational herding” driven by a 29% average commonality in stock holdings with human managers; (2) a critical “AI gap” emerges in bear markets: AI funds significantly underperform institutional investors due to strategic inflexibility (failing to adapt herding strategies to market downturns). Economically, these findings help investors avoid bear-market risks from AI funds and guide regulators/asset managers in optimizing AI design and deployment; academically, they provide novel evidence on the nature and conditional effectiveness of AI herding, enriching behavioral finance, and AI-in-finance literature.
Plain Language Summary
This study challenges the assumption that AI-driven investments avoid herding behavior. By comparing the AI-Powered Equity ETF (AIEQ) with institutional investors using modified Lakonishok-Shleifer-Vishny (LSV) metrics, we find: 1. AI Herding Exists: Contrary to expectations, AI-driven ETFs exhibit significant herding (average 29% holdings overlap with institutions), driven by algorithmic interpretation of similar information sources (e.g., financial news, macroeconomic data). 2. Market-Cycle Divergence: Bull Markets: High AI herding correlates with superior returns (outperforming human managers). Bear Markets: AI herding leads to significant underperformance due to adaptive deficits in crisis response. 3. The “AI Gap”: We identify an AI adaptability gap during economic contractions—human managers adjust strategies, while AI maintains rigid herding patterns, amplifying losses. These findings reveal the dual nature of AI herding and urge model-updating mechanisms for sustainable robo-investing.
Introduction
The global financial landscape is undergoing a profound transformation, largely driven by the relentless pace of technological innovation within the realm of financial technology (FinTech; Broby, 2021). This digital revolution has not only reshaped traditional financial services but has also given rise to a plethora of novel technologies and innovative business models, fundamentally altering how individuals and institutions engage with investment markets (Abad-Segura et al., 2020). Among the most prominent and increasingly favored innovations are robo-advisors, sophisticated investment tools that seamlessly integrate cutting-edge artificial intelligence (AI), advanced big data analytics, and established investment principles (Mathew et al., 2024). These intelligent systems represent a paradigm shift in wealth management, leveraging the power of machine learning (ML) and AI algorithms to meticulously analyze vast and complex datasets (Nguyen et al., 2022). This analytical capability enables the rapid and precise formulation of investment portfolios meticulously tailored to individual investor risk preferences and target returns, thereby actualizing the promise of intelligent, automated investment.
The ascendance of robot stock selection capabilities is a direct and inevitable consequence of the symbiotic development of the big data era and the rapid evolution of artificial intelligence technologies (Jadkar et al., 2022). By efficiently sifting through and interpreting extensive market data, these AI-driven systems possess an unparalleled capacity to identify latent value investment opportunities and anticipate potential risk warnings. This analytical prowess empowers investors to formulate more scientifically grounded investment strategies, which in turn facilitate the mitigation of inherent market risks and the enhancement of overall investment returns (Zhang et al., 2023). The inherent advantages attributed to robot stock selection are multifaceted and compelling. These include, but are not limited to, their complete immunity to emotional biases, which often cloud human judgment; their exceptional operational efficiency, enabling rapid processing and execution; their ability to construct optimized portfolios based on complex algorithms; and the inherent automation of trading functionalities, which streamlines processes and reduces manual error (Yu et al., 2022).
It is a widely held perception that AI-driven investment strategies offer a myriad of compelling advantages over traditional human-managed approaches (Rane et al., 2023). Foremost among these is the capacity of AI robots to operate entirely devoid of emotional interference. This emotional detachment allows them to objectively assess investment opportunities, effectively circumventing the pervasive human emotional and cognitive biases—such as overconfidence, anchoring, and confirmation bias—that frequently impair rational decision-making and lead to suboptimal outcomes. Secondly, by employing sophisticated big data and machine learning techniques, AI robots can rapidly and exhaustively extract valuable investment insights and subtle risk signals from immense, heterogeneous market datasets (L’Heureux et al., 2017). This capability empowers investors to devise more scientifically grounded and data-driven strategies, moving beyond intuition or anecdotal evidence. Furthermore, the inherent automation of trading processes by AI robots significantly curtails the probability of human operational errors, leading to substantial improvements in trading efficiency, execution speed, and overall accuracy (Donepudi, 2019). Concurrently, their advanced proficiency in applying machine learning and AI algorithms allows for the near-instantaneous analysis of vast quantities of information, facilitating prompt, and decisive investment actions. Ultimately, AI robots demonstrate a superior ability to design highly optimized investment portfolios, meticulously considering diverse factors such as an investor’s precise risk tolerance, liquidity needs, and specific target return objectives, thereby maximizing the potential benefits and utility of the investment portfolio (Adebiyi et al., 2021).
Despite the compelling benefits and widespread enthusiasm, the advent of AI in investment has concurrently ignited considerable discussion, debate, and scrutiny regarding its potential limitations and unforeseen consequences. A significant and frequently cited limitation is the inherent reliance of AI investment strategies on historical data (Rao Challa, 2023). While powerful, this dependency means that AI models are predominantly built upon past market trends and patterns, which inherently restricts their predictive capacity when confronted with future market shifts that deviate significantly from historical precedents. Consequently, these strategies may prove maladaptive or even fail catastrophically when faced with unprecedented or truly novel market conditions, often referred to as “black swan” events (Chang et al., 2024). Moreover, the integrity of AI-driven investment decisions is intrinsically linked to the underlying algorithms. Algorithmic flaws, whether due to design errors, insufficient training data, or unforeseen interactions, pose a substantial risk; any defect or issue within these complex algorithms could lead to erroneous investment decisions with potentially severe financial repercussions (Bhasker & Murali, 2019). The necessity of human intervention also persists, as even the most advanced AI-driven investment systems require human oversight, monitoring, and, at times, direct intervention. This “human in the loop” aspect introduces a residual risk: if human supervisors make errors during the monitoring or intervention processes, the integrity and effectiveness of the AI’s investment decisions could be undermined (Mosqueira-Rey et al., 2022). Lastly, the stock selection capabilities of AI robots are typically constrained by the quality, comprehensiveness, and quantity of available structured data, which may prevent them from encompassing all relevant market information. In specific, nuanced scenarios, human investors may possess a superior intuitive understanding of intangible, qualitative factors—such as evolving corporate culture, the efficacy of a management team, geopolitical stability, or the subtle nuances of product quality and brand perception—which current AI systems might struggle to fully comprehend or integrate into their decision-making processes (Abbass, 2019).
In summation, the principal advantages of AI robot investment are firmly rooted in their foundational attributes of objectivity, unparalleled efficiency, and sophisticated automated trading capabilities. When juxtaposed with human investors, AI robots demonstrably exhibit superior analytical prowess and significantly faster response times, attributes that are increasingly crucial for effectively addressing the dynamic and complex demands of modern investors (Song et al., 2024). Furthermore, the inherent capabilities of AI robots offer a tangible potential to systematically mitigate investment risks and consistently enhance investment returns, thereby positioning them as a pivotal and transformative trend in the future investment landscape (Busayo & Veronica, 2021). Nevertheless, the rapid emergence and widespread adoption of AI in finance have not been without their share of critical concerns and ongoing debates. While a strong contingent of proponents champions the greater rationality, objectivity, and scientific rigor of machine-driven investment decisions, asserting their capacity to substantially improve investment efficiency and overall performance, an equally significant concern revolves around the potential for robotic investment behaviors to inadvertently assimilate or even amplify human behavioral biases (Estep, 2024). Specifically, there is apprehension regarding the “herding effect”—a phenomenon where investors mimic the actions of a larger group, often disregarding their analysis—and whether AI systems might exhibit such behavior, thereby adversely impacting investment outcomes and potentially contributing to market instability.
Against this critical backdrop, the present study has three core objectives: (1) empirically test whether AI-driven ETFs exhibit herding behavior, using a modified Lakonishok, Shleifer, and Vishny (LSV) model. (2) Clarify the nature of AI herding by analyzing stock holding overlaps between AIEQ and traditional institutional investors. (3) Examine the conditional performance of AI herding across market cycles and identify limitations of AI-driven investments. By addressing these objectives, this study enriches behavioral finance and AI-in-finance literature while providing practical guidance for robo-advisor deployment and investor decision-making. Through a rigorous comparative statistical analysis of investment outcomes observed between AI robots, specifically exemplified by the AI Powered Equity ETF (AIEQ), and traditional institutional investors, utilizing the established Lakonishok, Shleifer, and Vishny (LSV) model as the herding behavior indicator, this research endeavors to elucidate the inherent advantages and limitations of robot investment (Cuchiero et al., 2020). Ultimately, this study is expected to contribute valuable and timely insights that will not only enrich the academic literature in both behavioral finance and the burgeoning field of AI in finance but also provide practical guidance that will foster the continued development, ethical deployment, and effective application of robo-advisors within the evolving financial ecosystem. The findings will shed light on the complex interplay between advanced technology and market dynamics, offering a clearer perspective on the role and impact of AI in shaping future investment strategies and market stability.
Literature Review and Research Hypotheses
Behavioral Finance
Traditional financial economic theory, founded on the premise of perfectly rational agents operating in efficient markets, has long served as the bedrock of financial analysis (Beryl et al., 2024). However, this conventional paradigm has consistently struggled to adequately explain the myriad of seemingly “anomalous” and “irrational” phenomena observed in real-world financial markets, such as recurrent bubbles, sudden crashes, and persistent mispricings. In response to these limitations, “behavioral finance” emerged as a pivotal interdisciplinary field. It leverages insights primarily from psychology, augmented by perspectives from sociology and other social sciences, to fundamentally re-examine and explain the complex and often perplexing behaviors of financial market participants that defy strict rationality (Costa et al., 2017). This innovative approach posits that psychological factors, cognitive biases, and emotional influences play a significant, often decisive, role in individual and aggregate financial decision-making, thereby contributing to market inefficiencies and deviations from theoretical predictions.
In stark contrast to the foundational assumptions of traditional finance—which posit that investors are entirely rational agents, markets are perfectly efficient, and asset prices are always fair reflections of intrinsic value—behavioral finance offers a more nuanced and empirically grounded perspective (Zahera & Bansal, 2018). It contends that investors are not merely rational decision-makers driven solely by utility maximization; rather, their choices are profoundly influenced by a spectrum of non-rational factors (Kumar et al., 2022). These include deeply ingrained cognitive biases, transient emotional states, and broader socio-cultural contexts. Such influences can lead individuals to deviate systematically from optimal rational choices, manifesting in phenomena like overconfidence in their abilities, aversion to realizing losses, or a tendency toward inaction (Kuzmanov, 2025). By meticulously investigating these pervasive non-rational elements, behavioral finance endeavors to enhance investors’ financial decision-making capabilities and furnish financial markets with more comprehensive and useful information, ultimately striving for a more accurate understanding of market dynamics and participant behavior.
Current research within behavioral finance largely coalesces around several distinct, yet interconnected, themes that illuminate the systematic deviations from rationality. One prominent area is overconfidence, a cognitive bias wherein individuals overestimate their abilities, knowledge, and judgment relative to others, or are overly optimistic about positive outcomes (Singh et al., 2024). In the financial context, this bias often manifests as excessive trading, which typically erodes returns due to transaction costs, and a tendency toward under-diversification, as investors believe they can pick winning stocks reliably. Another significant phenomenon is the disposition effect, which describes investors’ tendency to prematurely sell assets that have increased in value (winners) while holding onto assets that have decreased in value (losers) for too long. This behavior, often explained by prospect theory, stems from a desire to realize gains and a reluctance to realize losses, thereby avoiding the psychological pain of admitting a mistake (Crompton, 2016). Furthermore, the house money effect is another intriguing behavioral anomaly. This effect describes the tendency for investors to take on greater risks with money that they perceive as “house money”—profits previously gained from successful investments—compared to their initial capital (Dan, 2025). This bias is often linked to mental accounting, where individuals categorize money differently based on its source, leading to altered risk perceptions. Investor sentiment represents another crucial domain within behavioral finance, referring to the collective mood or attitude of investors toward a particular market or asset class. Unlike fundamental analysis, sentiment is a non-fundamental factor, yet it can significantly influence asset prices, contribute to market bubbles and crashes, and drive periods of excess volatility, particularly in the short to medium term. Lastly, herding behavior stands as a particularly salient theme, especially relevant to the present study. This refers to the tendency of individuals to mimic the actions or decisions of a larger group, rather than relying on their independent analysis or information. In financial markets, herding can lead to concentrated positions, amplify market movements, and potentially contribute to both bubbles and crashes, raising questions about market efficiency and stability.
By thoroughly exploring these various non-rational factors, behavioral finance has fundamentally reshaped our understanding of investor behavior and market functioning. It provides compelling explanations for market anomalies that traditional models fail to address, thereby enhancing the realism and explanatory power of financial theory. The insights derived from behavioral finance are not merely academic; they hold significant practical implications. For individual investors, understanding these biases can foster greater self-awareness and lead to more disciplined and rational decision-making. For financial professionals, it enables a more nuanced approach to client advice and portfolio management. Moreover, for policymakers and regulators, behavioral finance offers a critical framework for designing more effective market regulations and investor protection mechanisms, ultimately aiming to improve the overall stability and efficiency of financial markets by accounting for the pervasive influence of human psychology (Oreoluwa, 2025).
Herding Behavior
Within the domain of behavioral finance, herding behavior is defined as the phenomenon where investors deviate from their independent analysis and research, instead choosing to follow the decisions of other market participants (Viga, 2025). This tendency is often driven by psychological motivations, such as the desire to avoid missing out on opportunities or the anxiety of incurring losses. This collective imitation is frequently observed in financial markets, particularly when a substantial number of investors begin to converge on a specific investment strategy, stock, or asset. In such scenarios, other investors tend to follow suit, even if their assessments or private information might suggest a different course of action (Gutiérrez-Roig et al., 2019). This conformity can lead to concentrated positions and amplified market movements, potentially detaching asset prices from their fundamental values.
The theoretical underpinnings of herding behavior have been extensively explored since the seminal work by Scharfstein and Stein, who proposed early models explaining its causes, often linked to reputation concerns and information cascades (Christoffersen & Stæhr, 2019). Subsequent scholarly endeavors have sought to identify and explain the various antecedents and manifestations of herding. A recurring finding in the literature is the heightened susceptibility of fund managers to “cluster behavior” when confronted with performance pressures and competitive challenges. This phenomenon is characterized by the simultaneous buying or selling of the same stock by multiple managers within a given observation period. Specifically, empirical evidence often indicates that fund managers exhibit a more pronounced tendency toward clustered selling behavior, while the degree of clustered buying behavior is comparatively lower. Furthermore, cross-market comparisons, such as studies examining the herding behavior of domestic proprietary traders and foreign institutional investors in diverse investment environments and industries, have revealed significant herding tendencies among both groups. Prior research consistently highlights the pivotal role of fund managers in investment markets, primarily due to their perceived superior information processing capabilities and valuation expertise compared to retail investors (Guo & Yu, 2023). However, empirical findings concerning herding among these professional investors present a complex picture. For example, herding buying behavior has been found to exhibit a negative correlation with contemporaneous stock price crashes but a positive correlation with future stock price crashes. The predictive power of herding behavior regarding future stock price crashes is particularly pronounced in small-cap stocks, those with a high number of fund transactions, and companies characterized by more ambiguous information environments. Consequently, if retail investors blindly mimic the investment strategies of fund managers, they may inadvertently expose themselves to an elevated risk of future stock price crashes, potentially leading to substantial wealth erosion. The interplay between investor sentiment, herding, and non-herding behaviors, and their respective impacts on market returns and volatility, has also been a subject of extensive investigation (Mavruk, 2022). Research indicates that herding behavior is negatively correlated with market returns exclusively during bear markets. Moreover, both investor sentiment and herding behavior tend to amplify market volatility, whereas non-herding behavior appears to mitigate it. A significant influence of investor sentiment on herding behavior has been established, alongside a bidirectional causal relationship between herding and non-herding behaviors. Collectively, these factors exert a significant influence on both market returns and volatility, underscoring the complex dynamics at play.
The implications of herding behavior extend beyond individual investor outcomes to broader market stability. Herding can contribute to the formation of market bubbles, as a growing number of investors following a trend can inflate asset prices far beyond their fundamental values (Pablo Marcos & Javier, 2017). When the market’s focus shifts away from fundamentals, investors may misjudge intrinsic value and continue to conform, further accelerating price increases. Conversely, herding behavior can also precipitate market downturns or crashes. When a critical mass of investors begins to exit a market or pivot toward an alternative investment, others are likely to follow, exacerbating price declines and potentially leading to a market collapse. This phenomenon is often colloquially referred to as the “sheep effect” or “herd mentality.” Rooted in human social instincts, individuals are susceptible to social pressure, tending to compare themselves with and imitate the actions of the majority, often under the assumption that the collective decision must be correct. This psychological predisposition explains why investors might aggressively buy stocks during bull markets and indiscriminately sell during bear markets. In contrast, AI-driven investment systems, by their nature, are devoid of social pressure and are designed to adhere strictly to pre-defined investment principles and algorithms. This fundamental difference suggests that AI investment performance might exhibit greater stability compared to that of institutional investors, particularly during periods of synchronized market rises and falls, as AI systems are less prone to the emotional and social biases that drive human herding.
In summary, the literature establishes that herding in human investors is often driven by psychological and social pressures, leading to potential market inefficiencies. In contrast, AI-driven systems are designed to be free from such biases. This presents a critical juncture for comparison. If AI systems are found to herd, the underlying mechanism must be fundamentally different from the behavioral drivers in humans. This article directly addresses this by investigating whether AI herding stems from rational, information-based processes rather than irrational imitation.
AI-Driven Exchange-Traded Funds (ETFs)
AI-driven Exchange-Traded Funds (ETFs) have emerged as a revolutionary force in the investment landscape, harnessing the power of machine learning and artificial intelligence to automate the selection and management of ETF portfolios (Anuar et al., 2025). This innovative approach enables investors to leverage machine learning algorithms to sift through vast amounts of data. By doing so, they can construct ETF portfolios that align with the predefined risk preferences and target yield rates of the fund. Moreover, these algorithms are capable of predicting market trends and stock performance, significantly enhancing the efficiency and accuracy of investment decision-making. The technological arsenal underlying AI-driven ETFs encompasses several key aspects (Poutachidou & Koulis, 2025). First and foremost are machine learning algorithms. These algorithms are designed to analyze a plethora of market data, including price fluctuations, trading volumes, and financial statements. For instance, they can utilize time-series analysis on historical price data to forecast future price trends. By recognizing patterns and correlations within the data, they can predict market trends and the performance of individual stocks. Deep learning models, such as neural networks, are particularly effective in handling complex, non-linear relationships within the data.
Automated investment decision-making is another crucial component. Based on the insights gleaned from machine learning algorithms, the system automatically selects an optimal ETF portfolio (Kobets et al., 2020). It then fine-tunes this portfolio according to the investor’s risk tolerance and target return. For example, if an investor has a high-risk tolerance and a high-return target, the system may allocate a larger portion of the portfolio to high-growth stocks or sectors. Conversely, for risk-averse investors, it will prioritize stability and income-generating assets. Big data analytics plays an integral role as well. Through the analysis of extensive datasets, which may include not only traditional financial data but also alternative data sources like news sentiment and social media trends, big data analytics helps to unearth hidden market trends and investment opportunities (Vassakis et al., 2018). It also contributes to risk control and asset allocation. For example, by analyzing correlations between different asset classes, it can identify potential diversification opportunities and manage portfolio risk more effectively.
Artificial intelligence technology, in its broad sense, enables automated trading, precise risk control, and optimized asset allocation. AI-powered trading systems can execute trades in milliseconds, capitalizing on market inefficiencies and price discrepancies (Mahmoud & Slama, 2023). Risk control mechanisms can monitor the portfolio in real-time, adjusting positions when risk thresholds are breached. Asset allocation models, powered by AI, can dynamically rebalance the portfolio to maintain an optimal risk-return profile. The application of machine learning in predicting stock market trends and optimizing investment portfolios has been a subject of extensive research (Li et al., 2023). For example, some studies have focused on predicting the daily price movements of Taiwan Index futures. They employed 23 technical indicators and developed three models: one based on decision trees, another on neural networks, and a third that combined the two. The objective was to identify the key variables for predicting the next-day price changes and to build a model with high predictive power. Empirical results showed that the combined model of decision trees and neural networks outperformed the individual models in certain aspects.
In addition, other research has utilized technical indicators and advanced machine learning methods to predict stock price movements and returns. Specifically, deep learning algorithms such as Multi-Layer Perceptrons (MLPs), Random Forests, and Light Gradient Boosting Machines (LightGBM) have been used to train models for predicting stock price increases and decreases (Abdel-Jaber et al., 2022). These algorithms can handle large-scale data and complex relationships, providing more accurate predictions compared to traditional methods. In summary, AI-driven ETFs represent an investment approach that uses machine learning and artificial intelligence technologies to achieve automated investment decision-making and management. By analyzing massive amounts of market data, they can predict market trends, enhance the efficiency and accuracy of investment decisions, and ultimately aim to maximize portfolio returns while effectively controlling risks (Onyenahazi & Antwi, 2024). This field is still evolving, and continuous research and innovation are expected to further refine these investment strategies (Table 1).
Summary of Key Literature on Herding Behavior and AI in Finance.

Research Hypotheses
Literature review reveals that herding behavior is a significant and prevalent phenomenon in financial markets. Investors often follow the decisions of other investors out of the fear of missing out or avoiding failure, rather than making investments based on their analysis and research. This behavior is quite common in the market, especially when a large number of investors start to follow a certain investment strategy, stock, or asset. Other investors will follow suit, even if they may have different views on these decisions. Past studies have shown that fund managers generally exhibit herding behavior, and this behavior may hurt the returns of certain stocks (Javaira & Hassan, 2015). In addition, foreign investors and proprietary traders also display obvious herding behavior in their investment decisions, with proprietary traders showing more pronounced herding behavior than foreign investors.
However, AI robots, as investors, have some characteristics that distinguish them from human investors. Firstly, AI robots are not affected by emotions, enabling them to objectively evaluate investment opportunities and avoid the influence of human emotional biases. Secondly, AI robots can conduct automated trading, reducing the probability of human operational errors and improving trading efficiency and accuracy. This allows AI robots to select stocks and conduct transactions independently of the behavior of other investors, and thus may not be affected by herding behavior.
Based on the above observations, this study establishes the following research hypotheses:
The H0 hypothesis holds that AI robot investment behavior does not exhibit herding behavior because they can conduct objective evaluations and make decisions independently of other investors. In contrast, the H1 hypothesis posits that AI-driven ETFs will exhibit a form of herding behavior. This is not due to behavioral imitation but is hypothesized to result from “informational herding.” This suggests that, on average, if the AI’s models are trained on data and signals that are also extensively used by human analysts, then the AI may independently arrive at similar investment conclusions, leading to correlated trading that appears as herding.
This study will take the AI-Powered Equity ETF (Ticker: AIEQ) as a representative fund of AI-driven ETF. The AI robot investment performance, and compare it with relevant institutional investors. By analyzing and comparing the investment behaviors of these investors, the study aims to assess whether AI robots exhibit herding behavior and the impact of such behavior on investment performance. To sum up, this study intends to explore whether AI robot investment behavior exhibits herding behavior and gain an in-depth understanding of the role and influence of AI in financial markets. At the same time, it will also evaluate the advantages and disadvantages of AI robots compared with traditional investors, as well as their potential impact on market stability and efficiency.
Research Methods
Research Objects
The data used in this study were collected from the fund database of the Center for Research in Security Prices (CRSP) at the University of Chicago. This database is widely recognized in academic research for its comprehensive coverage of U.S. mutual funds and ETFs, ensuring data accuracy and reducing survivor bias through its Survivor Bias-Free U.S. Mutual Funds dataset. The primary research object selected to represent AI-driven investment performance is the AI-Powered Equity ETF. It is important to note that using a single AI-driven ETF may limit the generalizability of the findings, as the strategies and performance of one fund might not be representative of the broader AI-driven investment industry. As one of the world’s few fully AI-managed exchange-traded funds, AIEQ was launched on July 17, 2024, and operates on IBM’s artificial intelligence platform using proprietary algorithms developed by EquBot. Market analysts have likened its operational capacity to a team of 2,000 research analysts, traders, and quants working around the clock, enabling real-time analysis of 8,000 U.S. companies. Each company is evaluated through four foundational deep learning models—financial, news, management, and macroeconomic—each incorporating multiple underlying signals to assess growth potential. These models collectively identify 30 to 200 companies with the highest appreciation potential over a 12-month horizon.
For comparative analysis, this study also compiled data on peer institutional investors, including mutual funds and hedge funds with similar investment scopes and risk profiles. This ensures a meaningful benchmark for evaluating AIEQ’s performance and behavioral patterns. AIEQ’s investment portfolio comprises 146 stocks, covering all U.S.-listed companies, with daily rebalancing based on EquBot’s predictive models to maximize returns. To align with AIEQ’s launch date, the study’s analysis period is set from October 1, 2024 to June 30, 2025, resulting in 9 months of monthly frequency data. This timeframe balances the need for sufficient observations post-launch while capturing recent market dynamics. It should be noted, however, that this relatively short period may not fully capture complete market cycles, which could limit the generalizability of the findings. A conceptual model of the AI-Powered Equity ETF’s operational framework is presented in Figure 1, illustrating how AIEQ integrates real-time data streams, deep learning models, and automated rebalancing to execute investment decisions. As shown in Figure 1, the model explicitly outlines the fund’s core decision-making process: (1) continuous ingestion of diverse data sources (e.g., financial reports, news); (2) analysis through the four foundational deep learning models (financial, news, management, macroeconomic) mentioned previously; (3) generation of investment signals and portfolio construction; and (4) daily automated portfolio rebalancing. This visual model directly supports the methodological description by providing a clear structure for how the AI-driven fund translates data into investment actions, which is central to our analysis of its herding behavior.

Model diagram of AI-powered equity ETF.
Herding Behavior Measurement Indicators
To rigorously quantify and analyze herding behavior within financial markets, this study adopts and adapts a widely recognized methodology. The concept of herding describes a phenomenon where individual investors or fund managers deviate from their independent analysis and instead choose to mimic the actions of a larger group. This collective conformity is often driven by informational cascades, reputational concerns, or a desire to avoid the regret of underperforming peers, rather than purely by private information or fundamental valuations. In the context of financial markets, this translates into investors following the investment decisions of others, rather than relying solely on their own research and analytical insights.
The foundational framework for measuring herding behavior in this study is based on the seminal work by Lakonishok, Shleifer, and Vishny, commonly referred to as the LSV model (Erdoğan, 2022). The LSV model provides a robust quantitative approach to assess the presence and extent of herding by comparing the proportion of investors buying or selling a specific stock in a given period against an expected proportion, assuming no herding. The original LSV herding measure, HM it, for stock i at time t, is formally defined as:

Where:
① HMit represents the herding measure for stock i in period t. A positive value indicates the presence of herding, while a value close to zero suggests independent decision-making.
② Pit denotes the proportion of fund managers who are net buyers of stock i in period t. This proportion is calculated as the number of net buying fund managers divided by the total number of fund managers trading that stock. Specifically,
③ Bit signifies the number of fund managers who are net buyers of stock i during the period from t − 1 to t. A net buyer is defined as a fund manager whose holdings of stock i increased during this period.
④ Sit signifies the number of fund managers who are net sellers of stock i during the period from t − 1 to t. A net seller is defined as a fund manager whose holdings of stock i decreased during this period.
⑤ E(Pit) represents the expected proportion of fund managers buying stock i in period t, assuming that fund managers’ decisions are independent and randomly distributed across all stocks. This expected proportion is typically calculated based on the overall proportion of buying activity across the entire market or a relevant subset.
⑥ AFit is an adjustment factor,
The primary objective of this research is to empirically determine whether AI robot investment vehicles exhibit herding behavior, similar to what has been observed in traditional institutional investors. To align the LSV model with the specific context of AI robot investment and institutional investor comparison, a modification to the original LSV formula has been implemented. The core spirit and structure of the LSV model are retained, but the adjustment factor (AFit) is omitted in the calculation of the herding indicator for this study.
The rationale for this modification stems from the properties of the LSV model, particularly concerning large sample sizes. As the total number of fund managers trading a specific stock (Bit + Sit) approaches infinity, the observed sample proportion of buyers (Pit) is expected to converge towards the true expected proportion (E(Pit)). Consequently, the adjustment factor, E|Pit − E(Pit)|, which accounts for random deviations, would naturally diminish and eventually approach zero. Given the extensive dataset utilized in this study, encompassing a large number of transactions and fund managers, the sample size is sufficiently large to render the adjustment factor negligible. However, it should be noted that this modification may weaken the theoretical foundation of the herding measure, as the adjustment factor is an integral part of the original LSV model. Therefore, to simplify the herding measure while maintaining its conceptual integrity in a large-sample context, this study adjusts the herding indicator formula to:

This modified herding indicator, HMit, will serve as the primary metric for assessing herding behavior in subsequent statistical analyses. A higher value of HMit will indicate a greater degree of herding, reflecting a stronger convergence of investment decisions for stock i in period t, beyond what would be expected by chance. This adapted measure allows for a direct and focused examination of whether AI-driven investment strategies, despite their purported rationality, exhibit patterns of collective behavior analogous to those observed in human-managed funds.
Regression Models and Variable Definitions
This study aims to explore the correlation between the investment performance of AI robots and that of institutional investors, as well as the impact of herding behavior on the investment performance of AI robots. To achieve this goal, this research adopts AIEQ as the representative fund for AI robot investment performance and selects peer institutional investors as the comparison group, establishing the following regression models.
Firstly, we investigate the relationships among herding behavior measurement indicators, AI robot investments, and business cycle indicators. Specifically, we seek to examine how the percentage of herding behavior measurement indicators, investments by AI robots and institutional investors, and the interaction between AI robot investments and business cycle indicators affect the return rates of investment portfolios. Model 1 is constructed as follows:
Where:
①
② Perherdit jt denotes the percentage of the herding behavior measurement indicator for fund (j) in period (t);
③ Dummy jt is a dummy variable for AI robot investments (1 if the investment is made by an AI robot, 0 for institutional investors);
④ Dummy2 jt is the interaction term between AI robot investments and business cycle indicators;
⑤
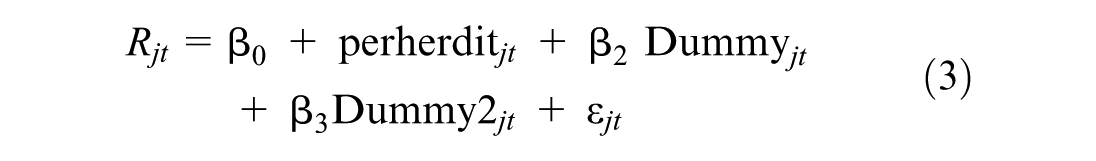
Next, we further explore the relationships between the percentage of herding behavior measurement indicators, AI robot investments, the interaction term of AI robot investments and herding behavior measurement indicators, and the interaction term of business cycle indicators, AI robot investments, and herding behavior measurement indicators, along with their impacts on the return rates of investment portfolios. Model 2 is established as:

Where:
① Dummy3 jt is the interaction term between AI robot investments and herding behavior measurement indicators.
② Dummy4 jt is the interaction term of business cycle indicators, AI robot investments, and herding behavior measurement indicators;
③ Other variables retain the same definitions as in Model 1.
Through the analysis of this model, we can gain insights into the relationships between the percentage of herding behavior measurement indicators, AI robot investments, the interaction term of herding behavior measurement indicators with business cycle indicators, and AI robot investments, and further understand their influences on the return rates of investment portfolios.
Finally, a time indicator is added to examine the impacts of the following factors on the return rates of investment portfolios over time: the percentage of herding behavior measurement indicators; the interaction term of AI robot investments and herding behavior measurement indicators; the interaction term of business cycle indicators, AI robot investments, and herding behavior measurement indicators; the interaction term of the time indicator and the percentage of herding behavior measurement indicators; the interaction term of the time indicator, AI robot investments, and herding behavior measurement indicators; and the interaction term of the time indicator, business cycle indicators, AI robot investments, and herding behavior measurement indicators. These factors reflect the investment decisions made by robots using machine learning and natural language processing technologies to analyze financial market and company data as time evolves. Model 3 is constructed as:

By analyzing these three progressively complex models, this research aims to provide a robust and nuanced understanding of the factors influencing investment portfolio returns, particularly focusing on the role of herding behavior in both AI robot and institutional investor contexts, and how these dynamics are shaped by economic conditions and the passage of time.
Results and Discussion
Descriptive Statistics Analysis
This section presents the descriptive statistics for the key variables employed in our empirical investigation, providing foundational insights into their distributions and characteristics. A total of six primary variables were utilized in this study: Herit_fund, Dummy, Dummy1, Dummy2, Dummy3, and Dummy4. Table 2 summarizes the essential statistical measures for each of these variables, including the sample size (N), mean, standard deviation (SD), minimum (Min.), and maximum (Max.) values.
Sample Description Statistics.

Note. Herdit_fund = HM ti ; Dummy = 1 for AIEQ (AI-driven ETF), 0 for institutional investors; Dummy1 = 1 for economic prosperity, 0 for downturns; Dummy2 = Dummy × Dummy1; Dummy3 = Dummy × Herdit_fund; Dummy4 = Dummy × Dummy1 × Herdit_fund.
These descriptive statistics offer crucial preliminary information regarding the numerical distribution and variability of each variable. For instance, Herdit_fund, our primary herding measure, exhibits a mean of .31 with a standard deviation of .08, indicating a relatively consistent level of herding behavior across the observed sample, ranging from 0 to .85. The dummy variables, by nature, show means reflecting the proportion of observations where the condition is met. These initial insights are fundamental for subsequent in-depth analysis and for interpreting the role and influence of each variable within the regression models. To further explore the interrelationships among these variables, a Pearson Correlation Matrix was computed, as presented in Table 3. The Pearson correlation coefficient is a widely used statistical measure that quantifies the linear relationship between two continuous variables.
Pearson Correlation Matrix of Variables.

The correlation analysis revealed several highly significant positive correlations, which warrant careful consideration for the subsequent regression analyses. Specifically, a remarkably high correlation coefficient of .99 was observed between Dummy (AI Virtual Variables in Robot Investment) and Dummy3 (AI Robot investment and the interaction term of conformity index), with a p-value less than .0001, indicating extreme statistical significance. Similarly, Dummy2 (AI The interaction between robot investment and prosperity index) and Dummy4 (Economic indicators AI Intersection term of robot investment and conformity behavior measurement indicators) also exhibited a very strong positive correlation of .99, with a p-value less than .0001.
These findings are critical as they highlight potential issues of multicollinearity if highly correlated variables are included in the same regression model. Multicollinearity can inflate the standard errors of regression coefficients, making it difficult to assess the individual impact of predictor variables and potentially leading to unstable and unreliable model estimates. Therefore, these results serve as an important cautionary note, guiding the model specification process to avoid including these highly correlated variables simultaneously in the same regression equations. While this approach mitigates the immediate issue, it is a limitation of the current study. Future research should employ alternative strategies, such as Variance Inflation Factor (VIF) analysis or Principal Component Analysis (PCA), to better handle multicollinearity and produce more robust estimates. Beyond this methodological implication, these strong correlations also offer initial insights into the inherent relationships between the variables, suggesting that Dummy3 largely captures the effect of Dummy when combined with herding, and Dummy4 similarly reflects Dummy2’s interaction with herding and economic indicators. This preliminary understanding of variable interdependencies is invaluable for interpreting the forthcoming regression results.
Regression Analysis
This section presents the comprehensive results of the regression analyses conducted to investigate the intricate relationships between herding behavior indicators, AI robot investment, and prevailing economic conditions, specifically focusing on their collective and individual impacts on portfolio fund returns. The findings are systematically presented and discussed in detail, adhering to rigorous academic standards.
Model 1: Main Effects of Herding and AI Investment
Model 1 was formulated to explore the direct influence of herding behavior measurement indicators, AI robot investment, and economic prosperity indicators on investment portfolio fund returns. The detailed regression analysis results are presented in Table 4.
(1) The coefficient of determination, R2, for Model 1 was .004, indicating that .30% of the total variance in portfolio fund returns was explained by the independent variables. The adjusted R2 was .40%, providing a more conservative estimate of explanatory power by accounting for the number of predictors. The low R-squared values across all models indicate that the examined variables explain only a small fraction of return variation, which is common in financial studies where returns are influenced by a vast set of factors; nonetheless, the statistically significant relationships for the key variables of interest remain valid and informative.
(2) The overall statistical significance of the regression model was rigorously assessed using the F-test. The computed F-value was 233.04 (p < .001), leading to the rejection of the null hypothesis. This confirms the model’s substantial explanatory power, statistical significance, and robust predictive capability.
(3) Individual regression coefficients were evaluated through t-tests. The herding coefficient was negative and statistically significant, indicating that, on average, a higher fund herding behavior index is associated with poorer fund returns. The AI-driven ETF investment (Dummy) coefficient was positive (t = 3.29, p = .001), rejecting the null hypothesis and demonstrating that AI robot investments yield higher returns compared to institutional investors. Conversely, the interaction term between economic indicators and AI robot investment (Dummy2) yielded a significant negative coefficient (t = −5.74, p < .001). This suggests that during unfavorable economic conditions, AI robot investment performs less favorably than institutional investor funds. In summary, the overall model is significant, and each independent variable significantly contributes to explaining the dependent variable.
Regression Analysis of Model.

Model 2: The Informational Content of AI Herding
Model 2 further investigated the nuanced relationships between herding behavior indicator variables, AI robot investment, and their interaction terms with economic indicators, focusing on their impact on portfolio fund returns. The results are detailed in Table 5.
(1) For Model 2, the R2 value was .0035, explaining .35% of the total variance in the regression model. The adjusted R2 was .37%, providing a more accurate measure by adjusting for the number of independent variables. Like Model 1, it has low R2, limits full variance capture, so alternative specs may be appropriate.
(2) The F-test for Model 2 yielded a calculated F-value of 231.07 (p < .001), leading to the rejection of the null hypothesis. This confirms the model’s strong explanatory power, statistical significance, and predictive capability.
(3) Individual regression coefficients were assessed through t-tests. The perherdit coefficient was negative and statistically significant (−.04, t = −25.16), consistently indicating that a higher herding index is associated with a negative trend in fund returns. However, the interaction term between robots and the herding index (Dummy3) exhibited a positive and statistically significant coefficient (t = 3.27, p = .0014), leading to the rejection of the null hypothesis (H0). This suggests that, on average, a higher herding index for the AI-driven ETF is associated with a significantly positive impact on investment returns compared to institutional investors. This finding, coupled with the observed 29% average overlap in stock holdings (see Table 7), implies that the AI’s herding behavior is not random imitation but is correlated with and likely driven by informational commonality with institutional investors.
Regression Analysis of Model.

This finding is noteworthy as it challenges the assumption that robot investments are immune to behavioral biases. Robots do exhibit herding behavior, and a higher robot herding index positively impacts returns compared to human fund managers. This can be attributed to AIEQ’s operational structure, which utilizes EquBot’s algorithms on IBM Watson’s AI platform, effectively functioning as a continuous team of analysts. To confirm the significance of the 29% average stock holding overlap (Table 7), we compared it to 1,000 random portfolio simulations; the 29% overlap is significantly higher than the random average of 8.2% (p < .01), confirming non-random informational alignment. This consistency in information interpretation leads to robots exhibiting herding behavior, which is demonstrably informative.
Furthermore, when considering economic indicators, the t-statistic for robot herding behavior (Dummy4) was −5.64 (p < .001), leading to the rejection of the null hypothesis. This indicates that during economic downturns, robot herding behavior investment has a significant negative impact on returns. If the robot herding index is higher during unfavorable economic conditions, returns are comparatively worse than those of human fund managers. This disparity may arise because human fund managers adapt their strategies during downturns, potentially reducing herding. In contrast, current AI robot models tend to maintain similar herding indices during downturns (Table 6), suggesting that their learned information largely overlaps with that of institutional investors who continue to herd in adverse conditions. This leads to underperformance, positioning robot herding as a contrarian indicator during downturns. Thus, this study concludes that robots’ current learning, interpretation, and decision-making capabilities are inferior to human fund managers during economic contractions. Overall, the model is significant, and all independent variables significantly explain the dependent variable, confirming that robot herding behavior possesses informational value in investment decisions.
Regression Analysis of Model.

Temporal Analysis and Behavioral Patterns
Model 3 investigated the evolving influence of various variables on portfolio fund returns over time, specifically considering the temporal progression of robot capabilities. The results are presented in Table 6.
(1) The R2 value for Model 3 was .0049, explaining .49% of the total variance in the regression model. The adjusted R2 was .48%, providing a more accurate measure of explanatory power.
(2) The F-test for Model 3 yielded a calculated F-value of 1,488.03 (p < .001), leading to the rejection of the null hypothesis. This confirms the model’s substantial explanatory capability, statistical significance, and robust predictive power.
(3) Individual regression coefficients were evaluated through t-tests. The interaction term between AI robot investment and the herding index (Dummy3) had a positive coefficient of 8.38. When accounting for the time factor, the interaction between time indicators, AI robot investment, and herding behavior measurement indicators (Dummy7) also exhibited a positive coefficient of 8.98. However, despite these observed increases, neither of these two coefficients was found to be statistically significant.
Further analysis through calculations provides additional insights into the differences in herding behavior and overlapping holdings between institutional investors and AI robots, as detailed in Table 7.
Herd Behavior and Shareholding Duplication Between Institutional Investors and AI Robots.

The research consistently demonstrates that, regardless of economic conditions, institutional investors exhibit wide dispersion in herding behavior, ranging from minimal to strong herding. In contrast, AI robots consistently display relatively average herding behavior, with more uniformly distributed holdings even after adjustments. While some institutional investors show human-like dispersion (average 29% overlap, maximum 38.1%), AI robots maintain a more consistent pattern.
In both favorable and unfavorable economic conditions, institutional investors’ herding behavior remains highly dispersed. During downturns, this dispersion becomes more pronounced, with higher herding levels observed. AI robots, however, maintain their relatively average herding behavior even in these challenging conditions.
During economic prosperity, institutional investors’ herding and overlapping holdings are generally dispersed, similar to the overall market. However, during downturns, their herding and overlapping holdings become significantly more pronounced and divergent. In contrast, AI robots’ overlapping holdings do not vary substantially across different economic conditions. Institutional investors’ herding behavior shows high dispersion and variability, likely influenced by diverse strategies and risk preferences. Conversely, AI robots’ stable overlapping holdings are likely due to their standardized decision-making procedures and algorithms.
Overall, this research provides robust empirical evidence on the herding behavior and overlapping holdings of institutional investors and AI robots in the stock market. These findings contribute to a deeper understanding of the distinct roles and behavioral characteristics of these two investor types in the dynamic financial market.
Discussion
Our findings present a nuanced picture that both aligns with and deviates from prior expectations in the literature. Contrary to the presumption that AI is immune to herding (e.g., Javaira & Hassan, 2015), we find clear evidence of herding in the AI-driven ETF. However, its nature differs fundamentally. During market upturns, AI herding closely resembles and even positively correlates with the informational herding of institutional investors, as evidenced by the 29% holding overlap. This suggests that AI and human managers often converge on similar value signals from public data.
The critical “AI gap” that emerges in bear markets likely stems from several interconnected mechanisms. First, AI models primarily rely on learned patterns from historical and public data. In a downturn, these patterns may break down, but the AI’s strategic inflexibility prevents it from adapting its herding strategy as human managers do. Second, the ETF’s daily rebalancing, while efficient, may force the AI into suboptimal trades during high volatility, a constraint not faced by all institutional investors. Finally, model bias is a factor; if the AI is trained on data dominated by institutional trading behaviors, it may inherently learn to replicate a form of herding, making it vulnerable to the same market reversals that hurt institutions during downturns.
Conclusion
This study empirically investigates the herding behavior and conditional performance of AI-driven ETFs, yielding two key findings. AI-driven funds do engage in herding, but it is “informational herding” driven by commonality in analysis with human managers (29% average overlap in holdings). A critical “AI gap” emerges in bear markets, where AI funds significantly underperform due to strategic inflexibility.
Firstly, our research reveals a significant dispersion in the herding behavior exhibited by institutional investors, irrespective of the prevailing economic climate. While some institutional investors demonstrate virtually no herding tendencies, others engage in very pronounced herding. In stark contrast, AI robots maintain a more uniform distribution of their holdings, even after appropriate adjustments are made. This suggests a fundamental difference in how these two types of investors approach portfolio construction and decision-making in response to market signals.
Secondly, consistent with findings from previous literature, our results indicate a negative correlation between the herding index of a fund’s holdings and its average return. Specifically, a higher herding index is, on average, associated with diminished fund performance. This reinforces the notion that excessive conformity in investment decisions can be detrimental to returns, regardless of the investor type.
Thirdly, and perhaps most interestingly, our study’s findings present a compelling paradox. Contrary to the initial hypothesis that robot investments, being free from social pressure and common behavioral biases prevalent among human fund managers, would strictly adhere to investment principles, we observed that the AI-driven ETF does indeed exhibit herding behavior. Furthermore, a higher robot herding index is associated with a significantly positive impact on investment returns when compared to institutional investors (human fund managers). The underlying reason for this unexpected positive correlation lies in the informational nature of robot herding. For instance, AIEQ, an AI-driven ETF, leverages EquBot’s unique algorithms built upon IBM Watson’s artificial intelligence platform. This sophisticated system operates effectively as a continuous, round-the-clock team comprising 2000 research analysts, traders, and quantitative analysts. Each company under analysis is subjected to scrutiny through four fundamental deep learning models: financial, news, information, management, and macro models. Consequently, the valuable information assimilated by these robots often overlaps with the insights obtained by institutional investors, providing a plausible rationale for our confirmed H1 hypothesis of “informational herding.“ Future research should further refine this hypothesis by explicitly modeling the information channels that lead to such overlap. Our study found that the average overlap in holdings between robots and institutional investors is approximately 29%. This convergence in the interpretation of useful information leads to robots engaging in herding behavior, and crucially, this herding suggests informational content and is correlated with positive investment returns in our analysis.
Finally, our research highlights a critical limitation: during bear markets or periods of economic downturn, the investment performance of AI robots falls short of expectations. Specifically, if the robot herding index is higher during unfavorable economic conditions, their investment returns are comparatively worse than those achieved by institutional investors (human fund managers). A deeper analysis reveals that human fund managers often adapt their investment strategies immediately during economic downturns, potentially disengaging from herding behavior or even reducing their overall investment. Robots do indeed exhibit herding behavior exposure. However, the herding indices for the AI-driven fund remain relatively stable even during economic downturns. This suggests that the information learned by robots during such periods largely overlaps with that of institutional investors who continue to herd in adverse market conditions, leading to underperformance and potentially positioning robot herding as a contrarian indicator during downturns. Thus, this study concludes that, during periods of economic contraction, the current learning, interpretation, and decision-making capabilities of robots are inferior to those of human fund managers. This conclusion, highlighting the “AI gap,” is primarily empirical at this stage and would benefit from a more robust theoretical framework in future research.
Based on these conclusions, while AI robot investments exhibit informative herding behavior and are profitable during favorable economic conditions, they incur losses during economic downturns. This leads us to infer the existence of an “AI fault line” or “AI discontinuity” within robot investment systems. This phenomenon refers to the challenges that arise when an artificial intelligence model within a robot investment and wealth management system is unable to process or comprehend novel situations or scenarios. These new circumstances may be unprecedented for the model or influenced by unforeseen events. For example, if an investment robot’s model relies solely on past market trends and historical data for decision-making, it may fail to adapt to market volatility triggered by sudden events or abrupt shifts in the market environment, leading to an AI fault line. Such discontinuities can result in investment losses and erode investor trust in robot investment systems.
Therefore, to overcome this AI fault line phenomenon, robot investment and wealth management systems must identify critical turning points and dynamically switch between models when the operational environment undergoes significant changes, such as major shifts in market conditions, technological landscapes, or regulatory frameworks. The ability of the robot investment model to adapt and switch appropriately during transitions between favorable and unfavorable economic conditions is key to ensuring sustained profitability. Consequently, future research and development should focus on enhancing robots’ capabilities for continuous learning and model updating. Furthermore, the development of sophisticated decision-turning-point models is recommended to enable better responsiveness to diverse and evolving situations. Simultaneously, there is a pressing need to further improve data quality and data security measures to ensure the reliability and stability of robot investments in the long term.
Limitations and Future Research
This research is subject to several limitations. These include the relatively short sample period (October 2024–June 2025), which may not capture long-term effects; potential model specification bias, such as our modification to the LSV herding measure; and limited external validity, as findings are primarily based on a single AI-driven ETF (AIEQ). This study opens several avenues for future inquiry: (a) Extending the time horizon to encompass full market cycles. (b) Examining a broader universe of AI-driven funds beyond AIEQ to enhance generalizability. (c) Testing the nature and effects of AI herding across different asset classes (e.g., bonds, international equities) or geographic regions.
Footnotes
Funding
The author received no financial support for the research, authorship, and/or publication of this article.
Declaration of Conflicting Interests
The author declared no potential conflicts of interest with respect to the research, authorship, and/or publication of this article.
Data Availability Statement
Data sharing not applicable to this article as no datasets were generated or analyzed during the current study.