
Abstract
Using the investor-herding index (IHRB) and manager-herding index (MHRB), the emergence of investors’ and managers’ herding behavior at the corporate-level and its potential impact on firm financial performance (FFP) is analyzed in the entire study. The study utilizes the micro-level data of 296 listed firms of Pakistan stock exchange (PSX) from 2013 to 2017. Empirical findings show that the investors’ and managers’ herding significantly affect FFP. The results are robust under alternative measurements of FFP. This study has a unique contribution to the literature on behavioral finance by addressing the astonishingly overlooked phenomena of firm-level biases and their potential impact on FFP. For prospective investor’s decision, the findings are significant in such way that the market index is irrelevant than the firm-level financial evidence. Explicitly, the study concludes that positive herding behavior is elucidated by the bullish trend and inverse herding behavior of investors with respective to firm value leads toward bearish trend of stock market index. The likelihood of market crash may become more stringent in circumstances once managers and investors interactively exhibit negative herding behavior. Thus, the study offers useful policy and strategy implications for the associated stakeholders to the device the policies accordingly.
Plain Language Summary
To examine the impact of investor-herding index (IHRB) and manager-herding index (MHRB) on financial performance (FFP). The study utilizes the micro-level data of 296 listed firms of Pakistan stock Exchange (PSX) from 2013 to 2017. We find that the investors’ and managers’ herding significantly affects FFP. This study has a unique contribution to the literature on behavioral finance by addressing the least focused phenomena of firm-level biases and their potential impact on FFP. We also supplement that positive herding behavior is reflected by the bullish trend and inverse herding behavior of investors with respect to firm value leads toward bearish trend of a stock market index. The likelihood of a market crash may become more stringent in circumstances once managers and investors interactively exhibit negative herding behavior. Thus, the study offers useful policy and strategy implications for the associated stakeholders to devise the policies accordingly.
Keywords
Introduction
Herding behavior among market participants gained much attention among research scholars. Established Herding hypotheses indicate that market investors tend to herd the financial experts rather than their source of information in their trading behavior. Christie and Huang (1995) find a strong association of herding behavior with stock returns volatility, particularly in the extreme market movements. Similarly, Garber (1990) shows that herding behavior is more prominent in the psychology of judgment. Over the last decade, the literature of herding behavior explores the diverse market behavior worldwide. In the milieu of the U.S. market, Christie and Huang (1995) empirically exhibit the no herding behavior, even during the extreme market trading behavior. Whereas the study of N. Choi and Sias (2009) evident the significant institutional herding bias in U.S. markets. In Europe, the studies of Mobarek et al. (2014) and Simões Vieira and Valente Pereira (2015) explain the existence of herding behavior in the European markets, particularly during the crises. Likewise, Walter and Moritz Weber (2006) document the mutual fund managers’ herding behavior during high volatile market conditions at German equity markets. In China, Taiwan, and South Korea, stock markets also exhibit significant evidence of herding behavior (Chang et al., 2000; Chiang et al., 2010). Bo et al. (2016) find herding in investment behavior among the corporate board, directors, and CEO and find the positive relation of herding behavior on the firm performance of Chinese listed firms. The study on the Taiwan stock market by C.-D. Chen and Demirer (2018) explain the returns are associated with the level of herding instead of past performance and also reports herding based investment significantly generates profit. The study of M. U. D. Shah et al. (2017) also shows the significant impact of herding behavior in Pakistan equity market.
Preceding research highlighted herding behavior in two ways; Firstly, during the extreme trading movements the investors herding at market and sector/industry level is indicated. Secondly, the evidence of the investment-herding behavior of corporate managers is based on their attributes. Usually, investors and managers need firm-level information for making the investment decision. Hence, firm-level investigation of herding bias may provide a better understanding of corporate financial sustainability. This is surprising why such an important phenomenon is unnoticed among research players. Considering the pivotal nature of this issue, this study is guided to fill the knowledge gap identified in the prior literature. Therefore, we empirically investigate the following questions.
Does the investor herding behavior holds at the firm level?
Whether firms’ manager exhibit herding behavior?
How the firm financial performance influences the investors and managers herding behavior?
Grounded on above stated literature and questions, this paper contributes to the existing literature in the following four aspects. Considering the models presented in the studies of Chang et al. (2000), C.-D. Chen and Demirer (2018), Demirer and Kutan (2006), M. U. D. Shah et al. (2017) from 2013 to 2017; the first part investigated herding bias existence or non-existence in the equity market (individual and whole industry/sector level). The study also analyzed that whether only market or industrial herding in insufficient to investigate the investor’s behavior associated with the trading firm. To address this relevant gap, considering the study of Demirer and Zhang (2019), that firm size, its characteristics, and the past return have a significantly provoke the investor herding, we extend the first part of our analysis to the firm level by the introduction of newly constructed index IHRB by the extending the formula of Chang et al. (2000). The second part postulates the impact of investor herding bias on the financial performance, the third part is devoted to the managers’ herding bias and its effect on firm financial performance, and at last study attempts to hypothesis the impact of investors and managers’ herding bias on the firm financial performance.
Overall results of the study demonstrate; (i) In Pakistan stock market herding behavior exists for the entire sample period as non-leaner and significant relation hold between stock return and cross-sectional absolute deviation (CSAD), i.e., 95% confidence interval at the market, and from 90% to 99% among 13 sectors and 103 firms. (ii) Using different measures of firm value (FV) that is, Market to Book value (MB), and Tobin’s Q, we find that investor and manager herding behavior non-monotonically and significantly affect the firm value for the sample period 2013 to 2017.
The remaining study is structured as: (1) a brief up to date review of the literature and development of hypotheses are described in Section 2. The methodological approach, together with variable definitions, data sources and a sample period are defined in Section 3. Empirical findings and discussion are elaborated in Section 4, while Section 5 consists of the conclusion of study and suggestions.
Brief Literature Review and Development of Hypotheses
Preceding literature highlights versatile herding behavior among market members around the globe, due to the diverse country’s economic, social, and cultural policies (Mokadem & Muwafak, 2020). An empirical analysis of U.S. and Europe’s investors and behavior of managers, elucidate the existence of herding bias among mutual fund managers (Grinblatt et al., 1995), analysts’ recommendation (Welch, 2000), and managers of pension funds scheme (Lakonishok et al., 1991). The foremost result of herding behavior is further rampant in international markets, entirely in emerging/rising markets. The study of Chang et al. (2000) exhibits a major presence of herding bias in markets of South Korea and Taiwan, the insignificant presence in Japan, and non-presence is revealed in the U.S. and Hong Kong. Later, Tan et al.’s (2008) study reports a significant impact of herding behavior exists in A and B-shares of the Chinese stock market.
In addition, on 18 foreign markets, the empirical study of herding bias by Chiang and Zheng (2010), reveals the significant existence of herding bias in six advanced and seven Asian markets, whereas the absence of herding bias detected in Latin American markets except in the era of market crises. Current studies of Balcilar et al. (2013) and Zheng et al. (2017) also report the herding bias in the Asian and Gulf markets. In the context of Pakistan, the studies of T. Javed et al. (2011) and Javaira and Hassan (2015) find no empirical evidence of herding behavior in listed KSE 100 index companies at the Karachi stock exchange (KSE) for the entire sample period of 2002 through 2014. Whereas Yousaf et al. (2018) study discusses the presence of herding behavior particularly from 2005 to 2008, in the Pakistan stock market. Similarly, M. U. D. Shah et al. (2017) also provide substantial evidence of herding behavior in the Pakistan stock market for the period from 2004 to 2013, specifically during the intense market movements. Also, study finds, during the upward market shift, more than half of the industries exhibits herding behavior.
The above studies of herding behavior contribute significantly to an improved and enhanced understanding of PSX and its investor’s behavior. However, their empirical results are narrowed at the market and industry and also address the sample period till 2014. Therefore these studies are incapable of explaining the behavior associated with the latest extreme trading period 2013 to 2017 for the potential stakeholders. Therefore, this research, linked to the literature, aims to investigate the herding actions of PSX investors from 2013 to 2017. For this purpose, the first hypothesis of this study is constructed as follows:
H1: At the market or industry level price momentum at PSX reveals major herding behavior of investors.
Habitually Investors trade in emerging and rising securities. The study of Huberman (2001) deliberates the foremost illustration of this phenomenon. Huberman (2001) finds the employees high buying attention of securities among those firms for which they were doing jobs or informed by their peers. Ha (2007) explores the robust impact of herding bias on the security performance as a proxy of stock returns. On the parallel side, stock returns significantly impact the firm value (Fama and French, 1992). Tracking of investors behavior is more valid and reliable from the local market (Awad et al., 2021), because home stock is more trending than the foreign stocks (Van Nieuwerburgh and Veldkamp, 2009) and investors also find irrational during their investment decision (Gebka and Wohar, 2013).
Grounded on the above stated literature, it is postulated that investors prefer to invest in well-known stocks of the industries, mainly in domestic stock market. Further, in their preference they have seen irrational in their decisions. In developing countries like Pakistan, herd behavior predominately captured behind the investors’ cognitive and emotional irrational thoughts during decision making process. Grounded on the below second hypothesis, this study attempts to detect the herd behavior associated of each stock from each industry, while concentrating on individual stock information instead of whole sector or index.
H2: Individual stock price momentums for the whole sample period at PSX exhibit substantial herding behavior at firm-level.
At any level uncovering of herding behavior is not adequate to enlighten the impact of behavior toward the specific firm. Investors generally consider the firm value as a prime analysis tool for their investment decision (Fama and French, 1992). Stock price retorts the momentum, established on the frequency of trade among investors. Consequently, the trading habits of investors display several behavioral anomalies, biases that influence the firm’s performance. Among them, the prime behavioral bias is herding bias (Garber, 1990; H. Javed et al., 2017), which significantly affect the firm performance (Alabass, 2019; Bo et al., 2016; C.-D. Chen & Demirer, 2018). To examine whether investor-herding behavior affects firm performance in the Pakistan equity market, we build the third hypothesis as;
H3: Investors’ herding is adversely impacted by firm financial performance.
The impact of herding bias is not only limited to the investors, but the manager of the firms often manifest herding bias in their investment decisions. In standard literature, theories of herding behavior presume that under a mature market environment, the information on which corporate managers make investment choice is absolutely great and insightful to ensuring a transparent structure of corporate reporting, efficient frameworks of corporate governance, mature laws and regulations for strengthen protection of shareholders wealth. In such conditions, investment decisions should be taken by the corporate manager based on the knowledge that is important to the business. Disparately, In their investment decisions over time, Prendergast and Stole (1996) find the herding intent among managers that means firms’ manager rely their peers’ knowledge instead of their one piece of information. Also, Demirer and Zhang (2019) highlight the poor performance among small companies with highly significant herding bias compared to small companies with low herding. Besides, they noticed an insignificant interaction of firm value and market beta with herding. Adversely C.-D. Chen and Demirer (2018) note that, regardless of their past results, companies with a high degree of herding achieve higher subsequent returns.
Theories on manager behavior posit the herding magnitude, following to their peers, in their investment decisions (Bikhchandani et al., 1992). In this context, herding behavior is described as the most protuberant bias in the field of judgmental psychology by Garber (1990).
Prior studies on manager herding behavior in investment documents reveal the universal behavioral pattern. The relation between managerial career concerns and herding is studied by many scholars. In making corporate investment decisions, Devenow and Welch (1996) analytically illustrate the existence of herd behavior among managers. Dewan and Dharni (2019) illustrate four general theories that are classified into two subparts; the first part explains the intentional herding and the second is for unintentional herding. The authors demonstrate the reasons for managers herding bias as: (1) they have a fear of reputational risk if they behave contrarily from the crowd. Hence they prefer to herd. (2) Managers can infer from rival managers’ private information (perceived in their previous trades), resulting in the creation of an informational cascade. (3) Similar private information can also be accessed by managers because they also analyze the same price variables that led them to draw similar conclusions for individual stocks. (4) By analysis, managers can reveal parallel aversions toward stocks with unique characteristics, such as low liquidity or low coverage.
Managers exhibits peculiar herding behavior across various industries in the U.S. and European markets. In U.S. corporations, N. Choi and Sias (2009) explain significant institutional herding. Walter and Moritz Weber (2006) also identify the herding of mutual fund managers in the markets of Germany, South Korea, Taiwan, and China (Chang et al., 2000; Chiang et al., 2010).
Consequently, the studies mentioned above show that a herding-based investment strategy generates significant profits, even after adjusting for risk. Similarly, the study of S. S. H. Shah et al. (2019), Alabass (2019), and Bo et al. (2016) also incorporates the positive impact of managers herding on firm performance. To observe, whether Pakistani manager-herding behavior affects firm performance, we propose the following hypothesis.
H4: Managers’ herding is positively related to firm financial performance.
For evaluating the firm financial performance, investors and managers financial decisions is considered to be the most significant and important metric. It has broad consequences for the acquisition, allocation of capital, and market effectiveness of the organization. Nikolic and Yan (2014), S. S. H. Shah et al. (2018, 2019), and Alabass (2019) explain the significant impact of investors and managers behavioral biases on the firm value. Therefore, H3 and H4 are structured to independently test the herd behavior of investors and managers. It might be possible the combined effect of adverse herd results on FFP. To investigate the combined effect of investor and manager herding on the FFP, we test the following hypothesis.
H5: Managers and investors herding is significantly and non-monotonically related to firm financial performance.
Methodological Approach
Investors Herding
Ever since in financial markets no precise measure of herding exists, various proxies are established at different periods in the financial literature. Herding behavior is reviewed in two ways (Demirer & Zhang, 2019), first utilizing the asymmetric buying and selling behavior of the security on the market, which illustrates either herding behavior exists on the buying side or on selling side, for example, herding buying appears if the buying orders exceeds the selling orders in the market and vice versa. This chunk of literature describes individual investor’s herding behavior drawn from their investment portfolio (Lakonishok et al., 1991). While, the subsequent study on herding uses a regression analysis grounded on the asset-pricing model, and cross-sectional deviation of stock returns to captures bias at the market/industry level. Prior herding studies reveal the second approach of herding in such way that suitable sample of herding can be examined at various periods. Such approach leads toward two traditional methodologies for the detection of herding bias. Cross-sectional standard deviations (CSSD) are the first approach and Cross-sectional absolute standard deviations (CSAD) are the second approach. CSSD was initially proposed by Christie and Huang (1995) which calculates the cross-sectional deviation of stock returns as:

Where n indicates the number of registered companies in the portfolio, ri,t is stock i return at time t, and rm,t denotes equally weighted stock returns of the market portfolio. The analysis of Christie and Huang (1995) evident the presence of herding, if the dispersion by CSSD is substantially lower. There is no fixed criteria for lower deviation. However, existing literature suggests, close to zero value for the lower deviation. Later, the research of Chang et al. (2000) extended the methodology for herding behavior by applying the phenomena of cross-sectional absolute deviation (CSAD), grounded on CAPM (capital asset pricing model). CSAD is very leading and suitable model for exploring herding in different market situations and environment. Our empirical study is also constructed on the CSAD approach of Chang et al. (2000), Adem and Sarıoğlu (2020), and K.-H. Choi and Yoon (2020) for investigating the herding bias among the market participants, and is calculated as;

Chang et al.’s (2000) research finds a linear correlation of CSAD with the absolute value of the stock in unbiased market conditions. However, when herd bias emerges, this linear relation turns to non-linear as investors’ trade closely backed the market trend which resulted to cluster the individual stock return around the market return. Hence, under the following circumstances, the negative and significant non-linear relations between stock market return and CSAD shows the existence of herding bias. Thus, the CSAD model for identifying herding bias is constructed as follows:

In CSAD, negative and significant γ2 shows the existence of herding bias. As our study also focuses on the detection of herd behavior specifically within sectors and enlisted firms therein, therefore we revise the above model and construct a series of herding models as follows:


In Equation 4, (CSADind,t) is computed on N, all the number of stock returns within the industry. For computing CSADind,t, the average industry return (Rind,t) is used for each of the 30 industries in the market along with individual stock return (Ri,t) registered and listed in the same industry.
In Equation 5, Rind_m,t = Rind,t − E(Rind,t), where E(Rind,t) is the expected industry return that is based on CAPM, and calculated as E(Rind,t) = α + βRm,t.α and β for individual industry of market are calculated by using the industry return and regress them on the market return for the entire data.


In Equation 6, we extend the model and calculate stock return dispersion
Managers Herding Bias
Proposed by Alabass (2019) and Bo et al. (2016), the proxy of managers’ herding bias, this study exercise a ratio model of absolute investment deviation. In this investment model herding bias subsist only if managers of firm i, follow the similar pattern for investment decisions of their peers. In common practice it is observed that when investors make their own investment decisions it is difficult for them to study other companies’ contemporary investment decisions. Perhaps, it is more reasonable to conclude that the managers of companies are well informed of the average investment value in recent years of other companies listed in the same sector. For considering investment decisions and as a point of reference, managers mostly observe the last year average investment value of the industry. The proxy for investment herding is, therefore, defined as;

The above model illustrates the absolute deviation of investment ratio between a firm i at time t of a sector from the average of a sector with exclusion firm i at the time t−1. While computing the investment ratio (I/k)i,t, sector wise data is considered and sorted initially and then again sorted within the sectors for the dimension of average investment ratio (
Herding and Firm Financial Performance
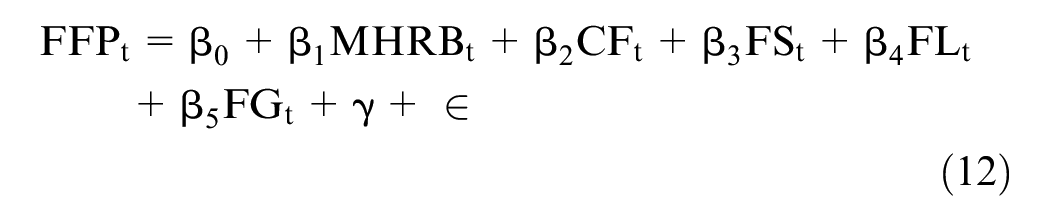
To examine the effect of investors and managers’ herding on firm value, the theoretical association between these variables can functionally express as;

Transformation of Equation 1 into mathematical expression;

In the above equation,
Description of Variables.

Data Source and Period of Study
Two sources are used for attaining data, compilation and its empirical analysis. First, during the sample period from 2013 to 2017 for CSAD, stock-based data was collected, for example, closing price, individual stocks trading volume, industry indexes, and market indexes from the Pakistan stock exchange web portal. Secondly, from the e-library of the State Bank of Pakistan, we gather data at firm-level, for example, CF, FL, FG, FS, and ROA. During the sample period all the firms listed on the Pakistan Stock Exchange are considered. Subsequently due to data constraint issue our sample is restricted to 296 companies from 30 sectors. The sample period selection of the period for 2013 through 2017 is based on the following reasons;
2013 was the immediate proceeding year after the Pakistan Stock Exchange Act (2012), which was passed to gain the confidence of domestic and foreign investors after the worse market crash of 2008.
2017 is the year in which the Pakistan stock market was included in the Morgan Stanley Capital International Emerging Markets Index (MSCI). In June 2017 Pakistan Stock Exchange enter the Morgan Stanley Capital International Emerging Markets Index (MSCI) which consists of 23rd high growth economies and win highest trading index. In mid of 2017, it achieved the highest milestone, and near to the end of the year, it went again to the downside of the index.
These compelling reasons endorsing the studies of Abuamsha (2021) and Hammash and Terban (2019), motive us to know the cause of unstable market operation during the sample period from 2013 to 2017, particularly associated with the behavior of market participants ceteris paribus.
Empirical Results and Discussion
Descriptive Statistics and Unit Root Testing
Table 2 presents the descriptive statistics and matrix correlation of all corresponding variables. The results report mean, minimum, maximum, and standard deviation of the firm financial performance (FFP and FFP1), cash flow, firm size, firm leverage, and firm growth.
Descriptive Statistics and Correlation Matrix.

The average value of FFP and FFP1 is 3.04, and 1.490 at a standard deviation 7.61, and 1.692 respectively. Descriptive statistics of a dummy variable, that is, investors and managers’ herding, show 40% and 46% average value respectively, which means in our data 40% IHRB and 46% MHRB exists. The rest of the descriptive statistics of IHRB and MHRB is 0 or 1, due to the binary nature of data. Matrix correlation, the second part of the table, exhibits no multi correlation among variables.
Table 3 shows the stationarity results based on the criteria of Levin, Lin, and Chu, Im, Pesaran, and Shin W-stat, ADF—Fisher Chi-square, and PP—Fisher Chi-square test. The null hypothesis assumes the presence of unit-root. If the corresponding p-value is greater than .05, against the alternative, which holds that series is free from unit-root. We find no evidence to accept the null hypothesis of the existence of unit-root for all the variables with all criteria. This implies that the variables under study are stationary at the level and further estimation is appropriate.
Panel Unit Root Test.

, **, and *** indicate test statistically significant at 10%, 5%, and 1% respectively.
Herding at Pakistan Equity Market
This section reports the empirical analysis for herding behavior from estimated CSAD models (3), (5), and (7). To perform this process, we regress each model separately. Firstly, we regress the stock return dispersion measure CSADm,t of the model (3) on the absolute value of excess market returns and the squared term of excess market returns. Secondly, we regress CSADint,t of a model (5) on the absolute value of excess sector returns and the squared term of excess sector returns. Finally, we regress CSADfirm,t model (7) on the average absolute value of excess firm’s returns and squared term of excess firm’s return to test whether herding exists at the market, industry, and firm-level in the Pakistan equity market. From the regression results, we observe the presence of herding effects at the market, sector, and firm-level.
Herding at Market Level
As stated earlier, when herding occurs, the linear relation between CSAD and the absolute value of the stock at the market, industry, and firms returns no longer exists, and each stock returns cluster around the market and industry returns. Therefore, a negative and significant γ2 (CSAD model coefficient) exhibits evidence of herding behavior. The results of Equation 3 are reported in Table 4, which supports our hypothesis (1) that investors herd along with market returns in the Pakistan equity market with a negative and significant coefficient, γ2.
Market Level Herding.

, **, and *** indicate test statistically significant at 10%, 5%, and 1% respectively, while p-value in parenthesis.
Herding at the Industry Level
Table 5, illustrates the results of Equation 5 of CSADint,t model of 30 sectors/industries of Pakistan equity market. The results attribute herding of investors among 13 sectors out of 30 sectors, that is, automobile assembler, cement, engineering, food, glass, jute, leather, oil and gas exploration, oil and gas marketing, paper and board, synthetic and rayon, textile composite and technology (where respective γ2 is negative and significant). Whereas 17 sectors are free from the herding bias, including the automobile part, commercial bank fertilizer and food. Our results are consistent with the findings of M. U. D. Shah et al. (2017). The results of the equation model (5) also ratify our hypothesis (1), the presence of herding behavior in the sector level. This means that among these 13 dominant and attractive sectors, investors follow sequential decision model that derives the herd behavior and causing the equilibrium inefficient (Banerjee, 1992). The partially existence of sequential trading pattern in the market sectors stimulates inspiration to further explore whether the information spillover can generate the information cascade to the firms for the non-herd sectors (Cipriani & Guarino, 2008; Zhou & Lai, 2009). For this purpose, the regression analysis of Equation 7 of CSADfirm,t model is empirically presented in Appendix Table 1.
Sector/Industry Herding.

, **, and *** denote tests that are statistically significant at10%, 5%, and 1%, respectively, having the p-value enclosed in parenthesis.
Herding at Firm-level
The regression analysis of Equation 7 of CSADfirm,t model for a 296-listed firm of Pakistan stock market, reports the firm-level herding behavior of investors. The results present the herding behavior of investors among 103 firms out of 296 firms. Whereas, 193 firms are free from the herding, having positive/negative and insignificant γ2 (CSADfirm,t model coefficient). This industry and firm-level analysis capture the evidence of 43% herding at the industry level, and 35% at the firm level. However, digging at firm level, eight firms, representing 2.7% of whole sample, from non-herd sectors demonstration the herding behavior and endorse the findings of (Cipriani & Guarino, 2008; Zhou & Lai, 2009). Thus, the results of the equation model (7) are in favor of hypothesis 2 that the firm-level herding exists in the Pakistan stock market (H. Javed et al., 2017; M. U. D. Shah et al., 2017; Yousaf et al., 2018). See Table 1 in Appendix for more detail.
Herding and Firm Financial Performance
Market, sector, and firm level analysis of herd are confined only to explain the herd behavior associated with them. To further excel, whether this sequential trading financial market behavior drive gains for the firm value? This study with reverence to hypothesis 3 to 5, attempts to elaborate the impact of IHRB and MHRB on FFP by using multivariate regression. Tables 6 to 8 use FFP and FFP1 as proxies for firm performance, as described in Table 1.
IHRB, MRB, and FFP.

Note. FFP = firm financial performance as measured by return on assets; OLS = ordinary least square; FE = fixed effect; IHRB = investor herding; MHRB = managers herding; CF = cash flow; FS = firm size; FL = firm leverage; FG = firm growth; N = number of observations.
, **, and *** denote tests that are statistically significant at 10%, 5%, and 1%, respectively, having the p-value enclosed in parenthesis.
IHRB, MHRB, and FFP1.

Note. FFP1 = firm financial performance as measured by Tobin Q; OLS = ordinary least square; FE = fixed effect; IHRB = investor herding; MHRB = managers herding; CF = cash flow; FS = firm size; FL = firm leverage; FG = firm growth; N = number of observations.
, **, and *** denote tests that are statistically significant at 10%, 5%, and 1%, respectively, having the p-value enclosed in parenthesis.
IHRB, MHRB, and FFP During Economic Shocks.

Note. FFP1 = firm financial performance as measured by Tobin Q; OLS = ordinary least square; FE = fixed effect; IHRB = investor herding; MHRB = managers herding; CF = cash flow; FS = firm size; FL = firm leverage; FG = firm growth; N = number of observations.
, **, and *** denote tests that are statistically significant at 10%, 5%, and 1%, respectively, having the p-value enclosed in parenthesis.
Fixed effect regression analysis is observed by Hausman test in which random effect hypothesis having significant p-value is rejected. Hence, the random effect is appropriate leading to rejection of null hypothesis. Using the following equation based on investor herding on the firm performance, baseline (OLS), and fixed effect regression analysis reports result in Appendix Table 1 and Tables 6 and 7.


In Table 6, the OLS model shows negative and positive IHRB and MHRB on FFP at 5% and 10% significance level, respectively, in columns 1, 3, and 5. However, the FE model, as suggested by the Hausman test mentioned above, exhibits the positive and significant IHRB and MHRB on FFP in columns 2, 4, and 6. Moreover, the significance level of managers herding increases from 10% to 1%, t-value (1.89) to (3.82), respectively, from individual to the collective regression model. Where the interaction of IHRB and MHRB elucidate the negative and insignificant impact on FFP. The control variable exhibits a positive and significant impact on firm performance except for firm size (FS), illustrated by the 22% Adj- R square at significant F-stat. Overall results support H4 that managers herding bias has a positive and significant impact on firm financial performance individually and collectedly and negate H3 and H5. FFP measure is based on the return of assets, which is used for measuring the firms’ internal accounting-based performance (Abdullah et al., 2012). This may be a reason that it only explains the managers’ behavior better than the investors’ behavior. Our findings are consistent with the findings of Bo et al. (2016). To further test the strength of results toward the support of hypotheses, whether investor behavior affects financial performance, we use different proxy FFP1 in Table 7.
Existing literature is evident that Tobin’s Q is a better proxy for firm performance at the market level. In Table 7, we replace FFP by Tobin’s Q proxy as FFP1, to check the relative strength of herding on firm performance. Column (1) and (2) show negative and significant results of IHRB in baselines and fixed effect with significant t-stat (−2.47) and (−3.13), respectively. MHRB in column (3) and column (4), reveals a positive and significant influence on FFP. Likewise, the overall results show a negative and positive, non -monotonically, significant influence of IHRB, and MHRB on FFP. Further, the interactive term overall explains the negative and insignificant impact of herding on FFP. These results are heterogeneous for different measures of FFP. The probable reason is that FFP explains the effect of behavior on accounting or book values on the firm (Abdullah et al., 2012; Wermers, 1999). So, it better describes the management behavior internally, whereas FFP1 considers both book and market value of a firm, which captures concentrated results than the FFP. The results of the controlling variables are consistent with previous literature. The results of Table 8, favor our all hypothesis 3, 4, and 5. These results are consistent with the finding of Alabass (2019) and Bo et al. (2016).
IHRB, MHRB, and FFP During Economic Shocks
As an exogenous factor, the impact of herding behavior on FFP during the economic shock is diagnosed for such purpose we divide the whole study period into three sub-samples. Where, the first and second sample consists of 2 years, that is, 2013 to 2014, 2015 to 2016, and third sample based on a single year such as 2017. These time intervals contain results based on FFP1. Empirical analyses document the mixed impact of investors’ and managers’ herding behavior in three-time intervals on the performance. In 2013 to 2014, when the Pakistan stock market was going toward the plus index, the results are in favor of hypotheses, which means IHRB influences negatively, whereas MHRB influences positively to the performance. While interaction explains the negative but insignificant impact on the FFP. In 2015 to 2016, MHRB still positively affect the FFP with the changed (positive) behavior of investors.
This means the investment behavior of both investors and managers are in favor of firm performance as their interaction clarifies the positive and significant impact on the FFP, despite shattering the market index in 2015 to 2016. In 2017, when the stock market was it’s at the highest index, the behavior of both investor and manager shows a negative impact on the performance, which means behavior at this interval exhibits disequilibrium the FFP with a negative and insignificant impact of interactive behavior on FFP. The first half of 2017 was the golden economic period in the history of the Pakistan stock exchange when it has achieved the highest index among all Asian equity markets and entered the list of emerging markets. The second half of 2017 was entirely different from the first half as near the last quarter, the market index went down continuously close to crash. This might be the reason for media news on the negative behavior of investors and managers in 2017. However, our findings are consistent with the literature of Bikhchandani and Sharma (2000) and Wonse et al. (2020), and exhibit the effect of economic shock on behavior and FFP.
Conclusion
Using the IHRB index based on Chang et al. (2000) and Zheng et al. (2017) cross-sectional absolute deviation model, this study examines the existence of investors herding at the firm-level in particular and market and sector level in general. The study utilizes the micro-level data of 296 listed firms of Pakistani stock exchange from 2013 to 2017. We apply Alabass (2019) and Bo et al. (2016) investment model of firms’ investment absolute deviation to construct the MHRB index. Supported by preliminary unit-root testing, we deploy the fixed-effect model to investigate the effect of: (1) investors’ herding bias on financial performance, (2) managers’ herding bias on the financial performance, and (3) investors and managers’ herding bias on the financial performance by two different proxies ROA and Tobin’s Q.
Empirical findings show that the investor and managers’ herding significantly affect the financial performance, negative and positive in magnitude, in the context of the Pakistani market. The results are robust under alternative measurements of firm financial performance. The unique contribution of this study to the existing finance literate is, the investigation of the presence of investors and managers’ herding at the firm level, and the subsequent impact, it poses on financial performance. This study offers useful policy implications to stock market regulators, government, policymakers, corporate board members, and potential investors (individual and institutional). Specifically, we infer that investor negative herding behavior lead toward bearish trend to a stock market index, while the positive herding behavior is explained by the bullish trend. The possibility of market crash and collapse may become high; especially under circumstances when both negative herding behavior is observed in manager and investor account. Thus, regulators can re-engineer the policies accordingly. Further, by extending the time period and study sample this study can provide the more meaningful results to stakeholders, not only to exploring and identify the impact of herding but also help them to better diagnose the factors of the herding behavior and market volatility.
Footnotes
Appendix
Firm-Level Herding (γ2).

| (1) | AGTL | −0.015*** | (38) | SMCPL | 0.011 |
| (2) | ATLH | −0.014*** | (39) | ABL | 0.042 |
| (3) | DFML | −0.024*** | (40) | AKBL | 0.022 |
| (4) | GAIL | −0.020** | (41) | ARPL | −0.020** |
| (5) | GHNI | 0.027*** | (42) | BAFL | 0.067 |
| (6) | GHNL | −0.018*** | (43) | BERG | −0.013* |
| (7) | HCAR | −0.018*** | (44) | BIFO | −0.01 |
| (8) | HINO | 0.020*** | (45) | BUXL | 0.001 |
| (9) | INDU | −0.013*** | (46) | COLG | −0.016 |
| (10) | MTL | 0.016*** | (47) | DAAG | −0.029* |
| (11) | AGIL | 0.007 | (48) | DOL | 0.019 |
| (12) | ATBA | 0.015*** | (49) | DYNO | 0.019 |
| (13) | BWHL | −0.021* | (50) | EPCL | 0.004 |
| (14) | EXIDE | 0.016*** | (51) | GASF | −0.023* |
| (15) | GTYR | 0.005 | (52) | GGL | 0.013 |
| (16) | LOADS | 0.009 | (53) | ICI | 0.013 |
| (17) | THALL | −0.014*** | (54) | ICL | −0.022* |
| (18) | CECL | 0.016* | (55) | LOTC | 0.01 |
| (19) | EMCO | 0.022*** | (56) | NICL | 0.006 |
| (20) | JOPP | 0.011* | (57) | NRSL | 0.035 |
| (21) | PAEL | 0.020*** | (58) | WAHN | 0.032 |
| (22) | TPL | −0.016*** | (59) | ADOS | −0.017* |
| (23) | ACPL | 0.013 | (60) | ASL | 0.007 |
| (24) | AGL | 0.012 | (61) | ASTL | 0.009** |
| (25) | AKZO | −0.032* | (62) | BIPL | 0.002 |
| (26) | BWCL | 0.013 | (63) | BOK | 0.002 |
| (27) | CHCC | 0.012 | (64) | BOP | −0.003 |
| (28) | DCL | 0.011 | (65) | FABL | −0.003 |
| (29) | DGKC | 0.007 | (66) | HBL | −0.007 |
| (30) | DNCC | 0.022 | (67) | HMB | 0.009 |
| (31) | FCCL | 0.034 | (68) | JSBL | 0.013 |
| (32) | FECTC | −0.020* | (69) | MCB | 0.002 |
| (33) | FLYNG | −0.008* | (70) | MEBL | 0.011 |
| (34) | GWLC | 0.007 | (71) | NBP | −0.012* |
| (35) | KOHC | 0.016 | (72) | SBL | 0.020* |
| (36) | LUCK | −0.014 | (73) | AHCL | −0.030** |
| (37) | MLCF | −0.004** | (74) | BCL | −0.003 |
| (75) | CSAP | 0.009 | (112) | AHL | 0.018 |
| (76) | DADX | −0.016** | (113) | AMBL | 0.017 |
| (77) | DAWH | 0.008* | (114) | BIPLS | 0.017 |
| (78) | DKL | 0.021 | (115) | CYAN | 0.019 |
| (79) | DSL | −0.033** | (116) | EFGH | 0.036 |
| (80) | INIL | 0.014* | (117) | EFUG | 0.006 |
| (81) | ISL | −0.002** | (118) | ESBL | 0.022 |
| (82) | ITTEFAQ | −0.003 | (119) | EWLA | −0.039** |
| (83) | KSBP | 0.022*** | (120) | HICL | 0.003** |
| (84) | MUGHAL | −0.013* | (121) | IGIIL | −0.024** |
| (85) | ASC | 0.009 | (122) | IGIL | 0.007 |
| (86) | CLOV | 0.01 | (123) | JGICL | −0.022** |
| (87) | EFOODS | 0.008* | (124) | JLICL | 0.005 |
| (88) | ENGRO | −0.015** | (125) | CJPL | −0.051* |
| (89) | FATIMA | −0.011** | (126) | FCIBL | 0.026 |
| (90) | FFBL | 0.010** | (127) | FDIBL | −0.043* |
| (91) | FFC | −0.010** | (128) | GRYL | 0.033 |
| (92) | BGL | 0.019 | (129) | ICIBL | 0.029* |
| (93) | FFL | 0.023 | (130) | JSCL | 0.017* |
| (94) | FRCL | 0.23 | (131) | JSGCL | −0.030** |
| (95) | GGGL | 0.018 | (132) | JSIL | 0.013 |
| (96) | GHGL | 0.023 | (133) | NEXT | −0.026* |
| (97) | GIL | 0.017 | (134) | SIBL | −0.030** |
| (98) | GLPL | −0.001 | (135) | AKDCL | −0.016* |
| (99) | ISIL | 0.021 | (136) | AKGL | −0.020** |
| (100) | MFFL | 0.014 | (137) | ARPAK | −0.029*** |
| (101) | MUREB | −0.040** | (138) | BATA | −0.019*** |
| (102) | NATF | 0.017*** | (139) | ECOP | −0.014 |
| (103) | NESTLE | 0.007 | (140) | LEUL | −0.02 |
| (104) | ZIL | −0.025** | (141) | GAMON | −0.058** |
| (105) | AICL | 0.004 | (142) | GOC | 0.017*** |
| (106) | ASIC | 0.008 | (143) | MACFL | 0.016*** |
| (107) | ATIL | 0.009 | (144) | ARM | −0.037*** |
| (108) | CENI | 0.009 | (145) | AWWAL | −0.003 |
| (109) | CSIL | 0.051*** | (146) | BFMOD | 0.021* |
| (110) | GVGL | 0.018** | (147) | CSM | −0.031* |
| (111) | KCL | −0.020** | (148) | FANM | −0.01 |
| (149) | FECM | 0.025* | (186) | SAPL | −0.003 |
| (150) | PACE | 0.018** | (187) | SEARL | −0.007 |
| (151) | TRIPF | −0.029*** | (188) | WYETH | −0.025** |
| (152) | APL | −0.007*** | (189) | ADAMS | 0.006 |
| (153) | BPL | −0.011** | (190) | ATRL | −0.019 |
| (154) | FEM | −0.019*** | (191) | BYCO | −0.044* |
| (155) | FFLM | −0.014* | (192) | DCR | −0.022 |
| (156) | FHAM | −0.024** | (193) | KOHP | −0.025* |
| (157) | FIBLM | −0.026*** | (194) | LPL | −0.013 |
| (158) | FNBM | −0.040** | (195) | NCPL | −0.004 |
| (159) | FPRM | −0.002 | (196) | NPL | −0.010* |
| (160) | HASCOL | −0.045** | (197) | NRL | 0.012* |
| (161) | HMM | −0.020** | (198) | SPWL | −0.015** |
| (162) | KASBM | 0.054** | (199) | ANSM | 0.030*** |
| (163) | MARI | −0.02 | (200) | BAFS | 0.014 |
| (164) | MODAM | −0.009 | (201) | CHAS | −0.014* |
| (165) | OGDC | −0.008* | (202) | DWSM | 0.010* |
| (166) | ORIXM | 0.014** | (203) | FRSM | −0.005 |
| (167) | BPBL | 0.013 | (204) | GATI | −0.033 |
| (168) | CEPB | 0.016** | (205) | HABSM | 0.034 |
| (169) | CPPL | 0.011 | (206) | HAL | −0.001 |
| (170) | MERIT | 0.015** | (207) | HSM | −0.008* |
| (171) | PKGS | −0.012** | (208) | HWQS | 0.013 |
| (172) | ABOT | −0.002** | (209) | IBFL | −0.001 |
| (173) | FEROZ | −0.012* | (210) | IMSL | −0.019 |
| (174) | GLAXO | −0.011** | (211) | JDWS | −0.013 |
| (175) | GSKCH | −0.015* | (212) | JSML | −0.16 |
| (176) | HINOON | −0.007** | (213) | KHTC | 0.080* |
| (177) | IBLHL | −0.006 | (214) | KPUS | 0.025 |
| (178) | OTSU | −0.015** | (215) | MIRKS | −0.005 |
| (179) | AEL | −0.021 | (216) | MRNS | 0.02 |
| (180) | ALTN | −0.004 | (217) | MZSM | 0.009 |
| (181) | EPQL | −0.002 | (218) | NONS | 0.01 |
| (182) | HUBC | −0.010** | (219) | NORS | −0.031 |
| (183) | KAPCO | −0.017* | (220) | SANSM | −0.005 |
| (184) | KEL | −0.009 | (221) | SKRS | 0.029 |
| (185) | KOHE | −0.001 | (222) | TICL | 0.051 |
| (223) | AVN | −0.020** | (260) | NML | −0.06 |
| (224) | HUMNL | −0.019** | (261) | SFAT | −0.021 |
| (225) | MDTL | 0.023*** | (262) | SFL | −0.041 |
| (226) | NETSOL | −0.037** | (263) | SFLL | −0.046 |
| (227) | ADMM | −0.017** | (264) | TOWL | −0.06 |
| (228) | AHTM | −0.013* | (265) | ZAHID | −0.593** |
| (229) | ANL | −0.015* | (266) | ASHT | −0.013* |
| (230) | ARUJ | 0.023* | (267) | CTM | −0.027** |
| (231) | BHAT | −0.011** | (268) | CWSM | −0.016 |
| (232) | BTL | −0.049 | (269) | DFSM | −0.028* |
| (233) | CRTM | 0.022* | (270) | DINT | −0.266** |
| (234) | TELE | 0.015 | (271) | DKTM | −0.297** |
| (235) | TRG | −0.001* | (272) | DMTM | −0.021* |
| (236) | WTL | 0.009 | (273) | DMTX | −0.022 |
| (237) | AMTEX | −0.158* | (274) | DSIL | −0.014 |
| (238) | ASTM | −0.019** | (275) | DSML | −0.049** |
| (239) | AWTX | −0.068 | (276) | DWTM | −0.028* |
| (240) | BCML | −0.031** | (277) | ELCM | −0.004 |
| (241) | BILF | −0.053** | (278) | ELSM | −0.038** |
| (242) | CCM | −0.024** | (279) | FML | −0.031 |
| (243) | CFL | −0.020* | (280) | FZCM | −0.039** |
| (244) | DLL | −0.021 | (281) | GLAT | −0.095** |
| (245) | FASM | 0.1 | (282) | HIRAT | −0.038 |
| (246) | GATM | −0.061 | (283) | IDRT | −0.031** |
| (247) | GFIL | 0.008* | (284) | IDSM | −0.053* |
| (248) | HAEL | −0.016 | (285) | IDYM | −0.047 |
| (249) | HAFL | −0.098 | (286) | ILTM | −0.036 |
| (250) | INKL | −0.015 | (287) | JATM | −0.041** |
| (251) | ISTM | 0.018 | (288) | JDMT | −0.081 |
| (252) | JUBS | −0.091 | (289) | JKSM | −0.058* |
| (253) | KML | −0.078* | (290) | KOSM | −0.033 |
| (254) | KOIL | −0.205** | (291) | LMSM | −0.047** |
| (255) | KTML | −0.049 | (292) | MQTM | −0.07 |
| (256) | MEHT | −0.041 | (293) | NAGC | −0.111** |
| (257) | MTIL | 0.046 | (294) | NCML | −0.046 |
| (258) | MUBT | −0.072* | (295) | BNWM | 0.011** |
| (259) | NCL | −0.178** | (296) | SSOM | 0.013*** |
*, **, and *** indicate test statistically significant at 10%, 5%, and 1% respectively.
Declaration of Conflicting Interests
The author(s) declared no potential conflicts of interest with respect to the research, authorship, and/or publication of this article.
Funding
The author(s) received no financial support for the research, authorship, and/or publication of this article.
Data Availability Statement
Data will be available on request for corresponding author.