
Abstract
The study conducts an in-depth analysis of the development trends in China’s strategic emerging industries amid the new wave of technological revolution and industrial transformation, with a particular focus on the phenomenon of stock market bubbles. This research constructs a new theoretical framework for real-time monitoring and early warning of bubble risks and systematically investigates these bubbles by using the Kalman filter technique and the CUSUM control chart algorithm. Through empirical analysis, the model successfully identifies the super-exponential bubbles in the stock indices of strategic emerging industries between 2014 and 2015 and between 2019 and 2021. Further research findings suggest that short-term increases in market liquidity may trigger bubble formation, while sustained government policy support and long-term investor confidence in emerging industries play a crucial role in the continued development of these bubbles. The study proposes a series of policy recommendations aimed at mitigating bubble risks and promoting stable and sustainable economic development.
Keywords
Introduction
The global economy is shifting as traditional industrialization wanes, giving way to new-generation information technologies like the Internet, IoT, AI, big data, and cloud computing, which stimulate a technological revolution (Zou, 2024). Strategic emerging industries (SEI), marked by technological breakthroughs, are increasingly promoted worldwide, especially in the U.S., Germany, and China, supported by policy initiatives. In China, the rapid growth of SEIs is vital for economic transformation and high-quality development, particularly since the COVID-19 pandemic has highlighted structural challenges and the limitations of traditional growth models (X. Li et al., 2023; Nong, 2024). The need for an innovation-driven path is urgent amid global technological competition. In September 2023, President Xi Jinping emphasized “New Quality Productive Forces,” focusing on sectors like new energy and advanced manufacturing. The government policies have fostered rapid SEI growth, with over 2 million enterprises contributing more than 13% to GDP by 2023. However, excessive government support and investor enthusiasm risk creating economic bubbles, driven by unrealistic growth expectations (Tran, 2017).
Bubbles in emerging industries can arise from both government and market factors. From the government’s viewpoint, information asymmetry (Ma et al., 2021; Zhao et al., 2024) and irrational political incentives (He et al., 2019) can lead to proactive fiscal policies that result in overinvestment, resource redundancy, and overcapacity. Incentives like financial subsidies attract significant capital, causing rapid investment expansion without corresponding market demand, which may lead to disordered production capacity (S. Ding et al., 2024; Kou et al., 2023). Local governments, eager to showcase achievements, may promote similar industrial developments, intensifying homogeneous competition and distorting supply-demand dynamics (Dong & Sun, 2022), ultimately contributing to economic bubbles.
From the market perspective, rising asset prices lure speculators seeking high returns, creating a self-reinforcing upward trend (Chen et al., 2021). This fosters overly optimistic investor expectations, leading to an investment frenzy (Gao & Martin, 2021; Haddad et al., 2022). Consequently, asset prices can diverge significantly from their actual value, resulting in an irrational market state that encourages bubble formation (Azmat et al., 2021).
The various mechanisms and phenomena contributing to bubble formation highlight the significant risk of bubble-induced crises lurking behind the rapid development of China’s strategic emerging industries. Amid the rapid development of China’s strategic emerging industries, identifying and alerting of potential bubble risks has become a key focus for policymakers and market participants alike. However, existing research on bubble identification in strategic emerging industries still has shortcomings. Many scholars tend to focus on exploring the dotcom bubble in the US (Basse et al., 2021; Potrykus, 2024) and cryptocurrency bubbles (Chowdhury et al., 2022; Geuder et al., 2019). Meanwhile, a few scholars have empirically demonstrated the presence of industry bubbles within China’s digital economy using bubble identification techniques (Qin et al., 2023; Qin et al., 2024). Although these studies provide valuable insights for this study, in-depth research specifically focused on strategic emerging industries remains insufficient.
In terms of research methods, existing studies primarily use unit root-based methods and price dynamics-based methods for bubble identification. However, these methods have certain limitations. On one hand, unit root-based methods such as BSADF and GSADF are complex in rolling window operations and have limited effectiveness in revealing the mechanisms behind bubble formation (Fan et al., 2023; Huang & Wang, 2024). These methods mainly rely on detecting abnormal large price fluctuations to identify the process of bubble bursting, but they struggle to recognize the gradual price increases that occur in the early stages of a bubble. On the other hand, among price dynamics-based bubble identification methods, the Log-Periodic Power Law (LPPL) model is widely used in asset bubble research because it can accurately describe the super-exponential growth process in price bubbles. The drawback of the LPPL model lies in its difficulty in determining whether current asset prices are in a bubble state, meaning it lacks the ability to effectively identify bubbles (Ji & Zhang, 2024; Yao & Li, 2021). However, the LPPL model can provide early warning signals for asset price bubbles and has a clear advantage in predicting the timing of market bubble bursts, with a high degree of accuracy (Q. Zhang et al., 2016). Therefore, if the LPPL model can be improved to enhance its predictive capability for asset price bubbles, it would have a significant advantage in warning of bubbles in strategic emerging industries.
However, existing research has yet to systematically explore how to integrate real-time monitoring techniques with traditional bubble theories. This study is the first to combine the Kalman filter and the CUSUM control chart to construct a dynamic monitoring framework. This approach complements conventional bubble theories such as the LPPL model: the Kalman filter enables real-time tracking of changes in the drift term, identifying potential super-exponential growth trends, while the CUSUM control chart effectively captures cumulative changes, enhancing sensitivity to early signs of bubble formation. These methods provide a more accurate and dynamic monitoring capability for bubble formation and evolution compared to traditional static models, addressing the gap in the literature regarding real-time early warning systems.
The study proposes a bubble monitoring method based conducting an in-depth analysis and monitoring of bubble phenomena in China’s strategic emerging industries stock indices. Using the development of China’s strategic emerging industries as a case study, this study aims to construct a theoretical framework for identifying early signals of bubbles and to provide references for policy formulation and market regulation. Moreover, the real-time monitoring capability of the model allows for the timely identification of the onset and trends of bubbles, offering crucial decision support for investors and policymakers. The findings not only provide a new perspective on understanding the mechanisms behind bubble formation in China’s strategic emerging industries but also offer theoretical foundations and empirical analysis for building effective bubble early-warning systems, which contributes to better identification and management of bubble risks associated with strategic emerging industries, thereby ensuring economic stability and sustainable development.
Model Description
Economic bubbles occur when market prices significantly exceed the intrinsic value of assets, often driven by excessive speculation. This creates irrational expectations of future price increases, which persist until the market recognizes the disconnect between prices and the actual economic fundamentals, leading to the bursting of the bubble and a sharp price decline. Although the intrinsic value of an asset—defined as the discounted value of future cash flows under a risk-neutral measure—is challenging to predict accurately using existing models, making direct comparisons between market prices and intrinsic values somewhat limited in detecting bubbles, market prices still offer a viable alternative as observable and quantifiable indicators. This study employs the Log-Periodic Power Law (LPPL) model to describe bubble behavior and uses Kalman filter techniques to create an early warning model that accurately tracks super-exponential price growth during bubble periods.
Price Dynamics Model During Bubble Periods
The LPPL model and its extensions proposed by Johansen et al. (2000) are capable of fitting the bubble formation process and predicting its crash solely based on price information. This method utilizes social network modeling to demonstrate how investor herding behavior, fuels bubble formation. This positive feedback leads to asset price surges driven by emotion rather than fundamentals. The LPPL model quantifies this behavior, offering early warning signals for potential market crashes.
In the LPPL model, the asset price during the bubble phase can be described by the following stochastic differential equation:

In the equation,
Under the no-arbitrage condition, the price becomes a martingale under the risk-neutral measure. Therefore, by

Where

Where
Before the bubble crash, when

By combining the asset price

Theoretical Mechanism of Bubble Monitoring
To accurately monitor the existence of economic bubbles, the key lies in comparing the abnormal price behavior during a bubble with the normal price behavior in non-bubble periods. Through this comparison, we can extract the distinctive characteristics unique to price bubbles, and then use these characteristics to develop an effective mechanism to identify and differentiate price bubbles, ultimately enabling the monitoring of economic bubbles.
The Geometric Brownian Motion (GBM) model, a classic asset pricing tool, serves as a foundational instrument in finance for analyzing stock price fluctuations and pricing derivatives (Liu & Chang, 2013). It is generally believed that the GBM model can accurately describe the dynamic behavior of asset prices. Assuming the current market does not have a bubble, the general price

Where


By comparing the dynamic characteristics of bubble prices described by Equation 5 with the general prices described by Equation 8, we can reveal the significant differences in the dominant factors of asset pricing under different market conditions. During the formation of a bubble, asset pricing
Super-exponential growth is a unique growth pattern characterized by an accelerating growth rate over time. Initially, it may resemble exponential growth, as both describe phenomena that increase over time, as illustrated in Figure 1. However, the distinctive feature of super-exponential growth is that the growth rate itself accelerates over time, meaning that the quantity grows at an increasingly faster pace in later stages. If the drift variable

Comparison between super-exponential growth and exponential growth.
Bubble Monitoring Methods
Based on the theoretical mechanisms for bubble monitoring described in the previous section, this paper uses the drift process of the general price
To estimate the time-varying drift parameter


Equation 9 serves as the state equation, outlining how the system’s state evolves over time. Equation 10 acts as the observation equation, which specifies the relationship between the observed data and the system’s state. In this context:

The
Kalman filter proceeds through two recursive steps: prediction and update. First, based on the information available at time

The above equations are collectively known as the prediction equations. Under the Gaussian assumption,

Once the new observation

The above formulas together constitute the Kalman filter equations. Given initial values
After estimating the state variable

This formula ensures that the cumulative sum does not decrease, reflecting the cumulative effect of process deviations. If the cumulative sum
It is worth noting that this study assumes the drift term to be a time-varying parameter following a normal distribution, rather than the constant parameter assumed in the traditional Black-Scholes model. This assumption better reflects the dynamic adjustment characteristics of asset prices during different stages in real markets. Meanwhile, the CUSUM control chart method is based on the assumption that during the early stage of bubble formation, the drift term exhibits gradual and cumulative deviations rather than abrupt or large jumps. As illustrated in Figure 1, this assumption facilitates capturing subtle but accumulating changes in asset prices during the initial phase of bubbles. The dynamic estimation of the drift term through the Kalman filter, combined with the CUSUM control chart’s sensitivity to cumulative changes, provides the methodological foundation for identifying early signs of bubbles.
However, it should be acknowledged that the proposed framework rests on several key assumptions. Specifically, the underlying bubble theory assumes that market dynamics are driven by the interaction of rational agents and ‘noise traders’; our model identifies price patterns consistent with this theory but does not directly model these investor behaviors. Furthermore, the analysis relies on aggregated stock index data, which reflects market-level sentiment but may obscure firm-level heterogeneity. Finally, the idealized assumptions regarding market noise and efficiency inherent in the Kalman filter and CUSUM methods mean these techniques may have limitations when confronted with extreme liquidity shocks or structural regime shifts.
Overall, the model and methods developed in the current study exhibit excellent characteristics. Based on LPPL theory, the model effectively captures the super-exponential growth features of asset price bubbles, providing a solid theoretical foundation for early bubble identification. By incorporating Kalman filter technology, the model can precisely estimate the time-varying drift parameters and achieve real-time tracking of stock index fluctuations, significantly enhancing prediction accuracy and dynamic adaptability. Additionally, the use of the CUSUM control chart algorithm further strengthens the monitoring of dynamic changes in price bubbles, enabling the model to timely detect and warn of potential market instability and risks.
Data Description and Preliminary Analysis
The data in this study are from the Wind database.
Since 2010, the Shanghai Stock Exchange and the Shenzhen Stock Exchange have introduced various emerging industry indices, such as the Shanghai Emerging Index, Shenzhen Emerging Index, SME Emerging Index, and GEM Emerging Index. These indices aim to reflect the development changes in strategic emerging industry stocks, which are deeply integrated with new technologies and emerging industries. According to the published index compilation schemes, strategic emerging industries mainly cover sectors such as new energy, biomedicine, new materials, and electric vehicles. The strategic emerging industry stock indices select representative listed company stocks as samples to comprehensively reflect the overall performance and development trends of strategic emerging industries or specific market sectors, which thus provide a quantitative measure of the development status of these industries. A higher stock index indicates increased investor interest in digital economy-related assets, leading to more investments, and vice versa.
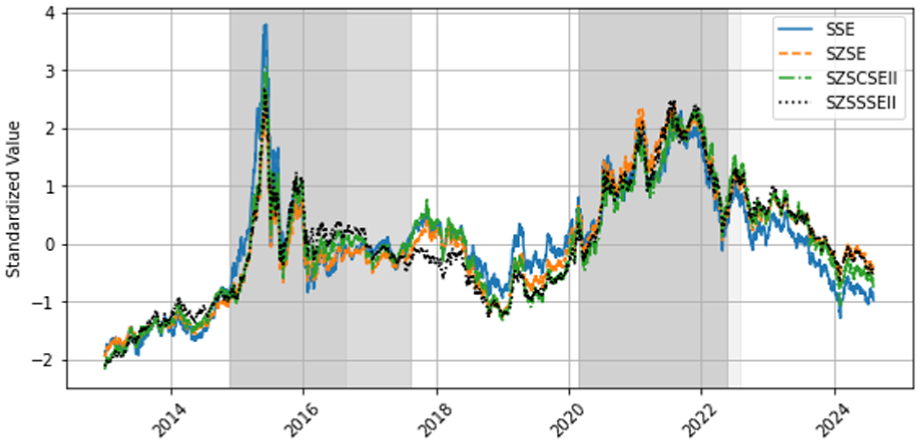
Therefore, this study selects the daily closing prices of the Shanghai Emerging Index (SSE, index code: 000067), Shenzhen Emerging Index (SZSE, index code: 399641), SME Emerging Index (SZSCSEII, index code: 399641), and GEM Emerging Index (SZSSSEII, index code: 399643) from January 4, 2013, to August 5, 2024, to quantify the development of strategic emerging industries and investigate whether there are bubbles during periods of cyclical prosperity and recession in China’s strategic emerging industries. Among these, the GEM Emerging Index (SZSSSEII) is particularly noteworthy as it focuses on high-tech enterprises on the ChiNext board. Compared to main board indices like the SSE, it places greater emphasis on start-up phase emerging industries. These characteristics often lead to more pronounced bubble features, as evidenced by its high CUSUM values during the 2019 to 2021 period (see Figure 6), making it a key representative for analyzing industry-specific bubbles. Figure 2 illustrates the trends of various strategic emerging industry stock indices. To facilitate comparison of volatility trends between different indices, we standardize the indices in the visualization process of Figure 2. However, the original data will be used for analysis in the subsequent sections.

Strategic emerging industry stock indices.
Figure 2 shows that the strategic emerging industry stock indices exhibit significant volatility characteristics, indicating the potential presence of price bubble behavior. As illustrated by the gray shaded areas in Figure 2, from May 19, 2014, to June 15, 2015, all four stock price indices accumulated gains of over 100% within 392 days. Additionally, from January 3, 2019, to August 9, 2021, the industry stock indices accumulated gains exceeding 95% over 949 days, with a clear upward trend.
The first upward interval is considered to be the direct trigger of the “2015 stock market crash,” but the second upward interval is less frequently discussed. Therefore, can the second upward interval be viewed as an economic bubble? The observed fluctuations indicate significant volatility in the stock indices, suggesting the possible existence of multiple bubbles within China’s strategic emerging industries. Moreover, despite the different geographical regions, sizes, and market liquidity characteristics of the various indices, all four strategic emerging industry stock indices showed notable synchronization during market upswings, further confirming their excellent representation of the overall trends in the strategic emerging industries.
At the same time, when assessing whether there is a bubble in the strategic emerging industries by stock indices, it is necessary to compare with composite stock indices such as the Shanghai Composite Index, Shenzhen Component Index, Small and Medium-sized Enterprise (SME) Board Index, and ChiNext Index. These composite indices provide a benchmark for the overall market performance. By comparing key indicators such as growth rates and volatility, whether specific industries have experienced overheating or bubbles can be revealed. The fluctuation trends of the composite indices are shown in Figure 3. The composite indices exhibited a clear upward trend during the first interval, but the rise during the second interval did not show the same persistence. This suggests that the increase in strategic emerging industries during the second interval has distinct industry-specific characteristics.

Major composite stock indices of the Chinese stock market.
Table 1 presents the descriptive statistics for the four strategic emerging industry stock indices, with a total of 2,815 observations. The strategic emerging industry stock indices exclude weekends and holidays. The means of these indices are 6,936.811, 1,916.147, 1,717.334, and 2,326.704, with standard deviations of 1,600.308, 515.974, 429.726, and 769.886. This indicates that the stock indices exhibit significant volatility, which may increase the likelihood of digital economy bubbles. The skewness of the series is significantly greater than 0, suggesting that the stock indices follow a right-skewed distribution. Additionally, the Shapiro-Wilk test indicates that the strategic emerging industry stock indices reject the null hypothesis, meaning the series does not conform to a standardized normal distribution at the 1% significance level.
Descriptive Statistics of Strategic Emerging Industry Stock Indices.

Bubbles Monitoring of Strategic Emerging Industry Stock Index
Model Fitness and Results
This study employs the previously designed bubble monitoring method to identify super-exponential growth trends in the strategic emerging industry stock indices SSE, SZSE, SZSCSEII, and SZSSSEII, and to estimate whether bubbles exist in China’s strategic emerging industries during the new wave of technological boom. We firstly use the Kalman filter method to estimate the time-varying drift parameter
Figure 4 clearly displays the logarithmic levels of stock indices and the model fitness, where the estimated value curves are highly consistent with the actual trends. This demonstrates the efficiency and accuracy of the Kalman filter algorithm in tracking stock index fluctuations. Additionally, this study uses the forward step prediction

Results of Kalman filter parameter estimation.
Forward-Step Prediction R2 for Kalman Filter.

Dynamic Process of the Drift Parameter
According to the definition of the bubble monitoring model, the dynamic changes in the drift parameter
Figure 5 reveals the dynamic changes over time in the estimated drift parameter

Dynamic process of the drift parameter (Red solid line) and its mean-adjusted dynamic process (Blue dashed line).
By analyzing the dynamic changes in the estimated values of the drift parameter
Furthermore, after 2019, the various strategic emerging industry stock indices experienced growth to varying degrees, although these growth trends were not particularly significant. To more clearly reveal the upward trend of the drift variable
This amplification process allows us to clearly observe a significant upward trend in the strategic emerging industry stock indices in early 2019. This phenomenon not only reveals a subtle but genuine super-exponential growth in these industries from 2019 to 2021, providing solid empirical evidence for bubble monitoring. Although the growth during this period did not reach the peaks seen from 2014 to 2015, the sustained upward trend again signals a build-up of speculative sentiment fueled by strong growth expectations, strongly indicating the existence of a bubble in the strategic emerging industries.
Bubbles Monitoring of Strategic Emerging Industry
To quantify whether there is a significant upward trend in the drift variable
As shown in Figure 6, during the stock market bubble of 2014 to 2015, the bubble monitoring model successfully identified the presence of bubbles in the strategic emerging industry within all four stock indices. For the period from 2019 to 2021, the SSE, SZSE, SZSCSEII, and SZSSSEII indices all exhibited clear signs of economic bubbles, which confirms that there were indeed economic bubbles in the strategic emerging industries during that time.

Warning time points for the emergence of bubble risk in strategic emerging industry stock indices.
Figure 7 shows the overlapping periods of bubble booms and busts for the four strategic emerging industry stock indices. It is noteworthy that the bubble monitoring results indicate that the earliest sign of an economic bubble was detected in the SZSE index in February 2020, and the latest in the SSE index in July 2020, which is generally later. This is attributed to the fact that, under the backdrop of the 2018 Sino-US a trade war, the US targeted China’s competitive high-tech firms, leading to a significant downturn in the strategic emerging industry stock indices (Mauck et al., 2022). Therefore, the rise from 2019 to 2020 is considered more as a mean reverting process. However, with the continued rise of the strategic emerging industry stock indices, a new round of economic bubbles emerged, driven by the new wave of technological boom.
Bubble boom and bust periods under the bubble monitoring model.
Robustness Check
To assess the robustness of the two primary monitoring models used in the current study, the Kalman Filter model and the CUSUM control chart model are used. The study adjusts the initial parameters of each model and evaluates the robustness of their results.
For the Kalman Filter, the setting of the process noise covariance matrix Q directly affects the prediction accuracy and filter performance of the Kalman Filter. Adjusting the value of Q helps estimate the robustness of the model results. In this study, four different levels of the covariance matrix Q were set: 1,

Bubble monitoring control charts after modifying Kalman filter Q.
By adjusting the parameter values of the covariance matrix Q, we observe that as Q increases, the CUSUM values tend to show an upward trend, accompanied by a delay in the bubble recession period. However, regarding the starting time of the strategic emerging industry bubble, different values of the covariance matrix Q exhibit a high level of consistency in identifying the bubble’s onset. This indicates that, although the value of Q has a significant impact on the CUSUM values, it demonstrates high robustness in identifying the bubble’s starting time.
For the CUSUM control chart model, adjusting the threshold is crucial for assessing the robustness of the model’s results, as this process directly affects the model’s sensitivity and response to changes. This study examines three different threshold values: 0.45, 0.5, and 0.55, as shown in Table 3. It is observed that with smaller thresholds, the bubble monitoring model identifies the start time earlier but the end time later; and vice versa. However, compared to the significant shifts in end times under different thresholds, the estimates of the start times are relatively consistent, indicating that the model has strong robustness.
Changes in Start and End Times After Adjusting CUSUM Control Chart Thresholds.

Further Research: Market Factors or Industry Factors?
When monitoring bubbles in strategic emerging industry stock indices, it is crucial to examine whether market composite stock indices also show signs of bubble formation. This helps distinguish whether the bubbles are driven by overall market factors or specific industry factors.
Therefore, this study conducts bubble monitoring for major stock composite indices such as the CSI 300 (CSI300), Shenzhen Index (SZI), Shanghai Composite Index (SSEC), SME Index (SME), and GEM Index (GEI). The monitoring results are shown in Figure 9. For the two rounds of stock index bubbles, the bubble monitoring model effectively detects price bubbles in the first round for all five stock composite indices, but the results for the second round of bubbles vary among the five indices.
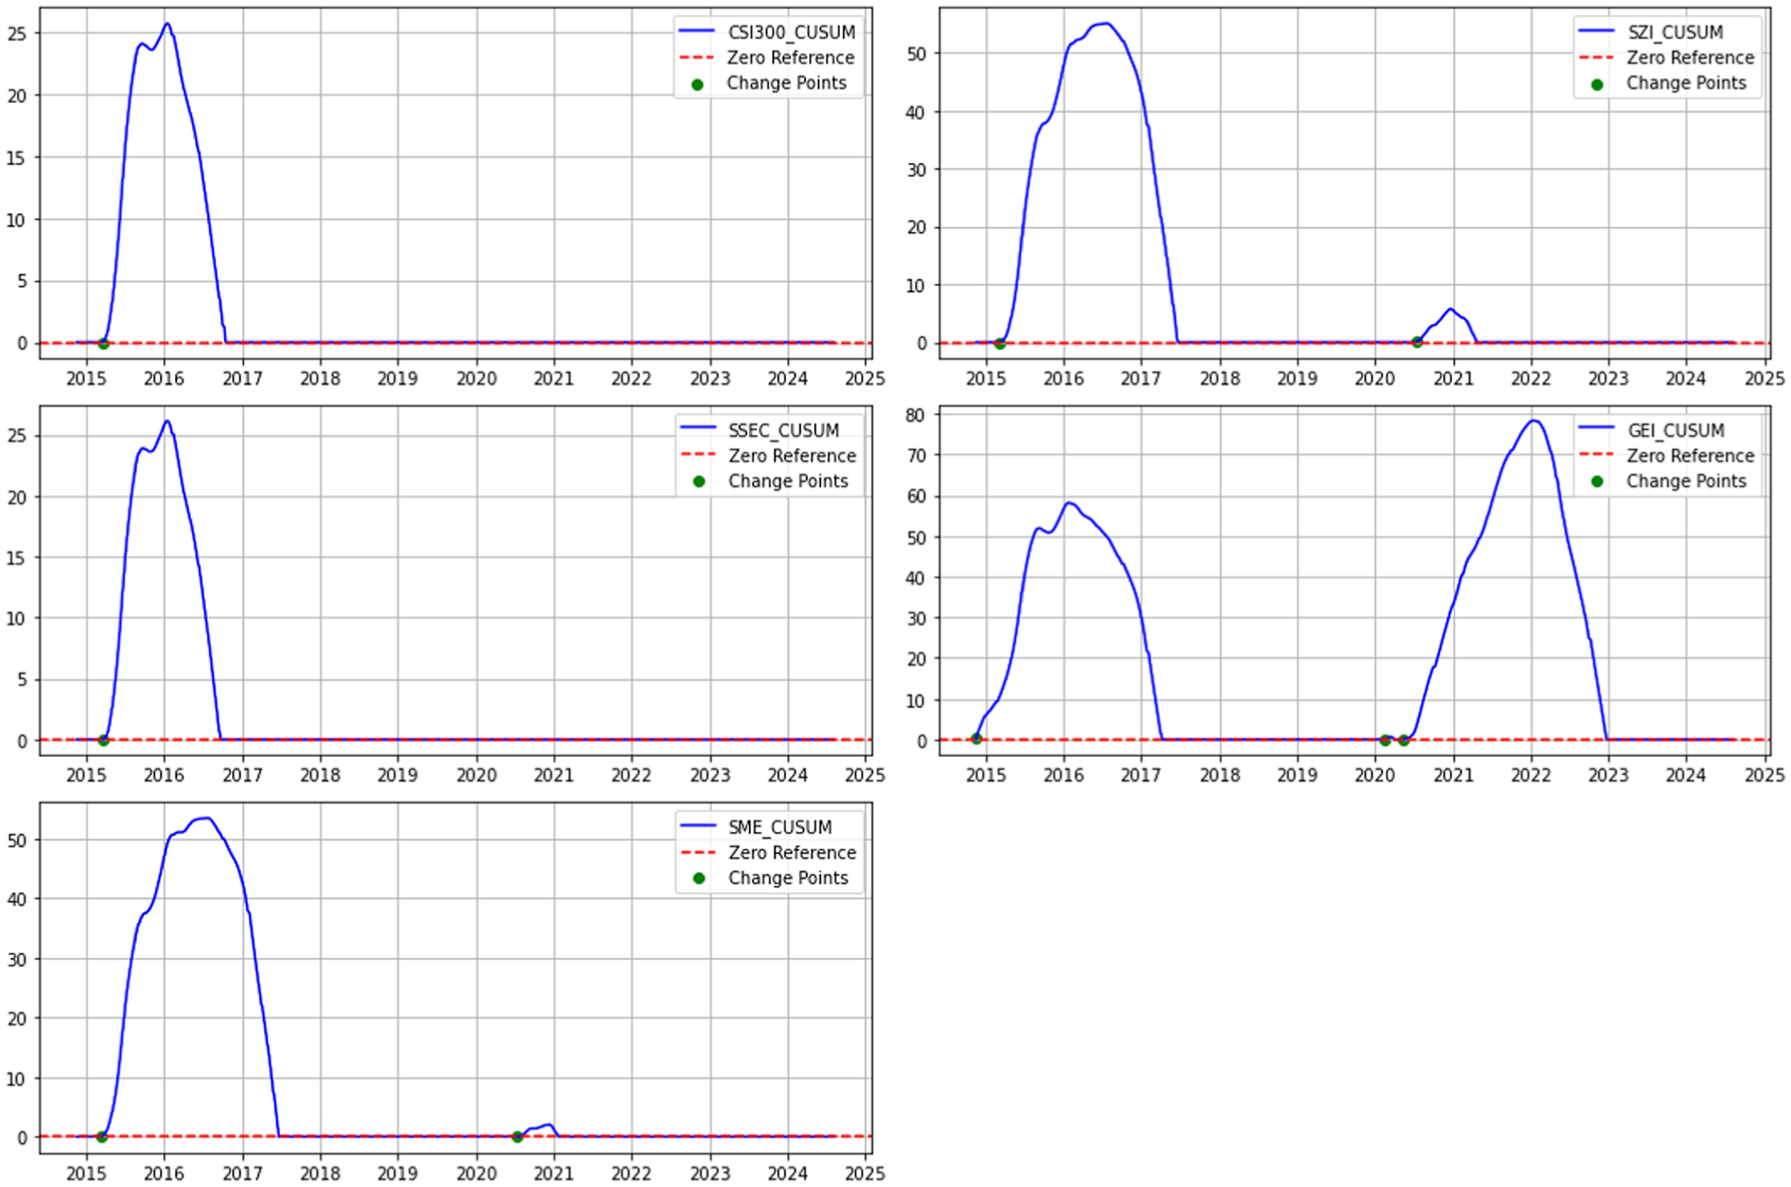
Bubble monitoring results for major stock composite indices.
Specifically, during the second round of the stock market bubble, the CSI 300 Index and the Shanghai Composite Index did not show significant signs of economic bubbles. Meanwhile, although the Shenzhen Index and the SME Index briefly exhibited bubble phenomena, these bubbles quickly dissipated. In contrast, the GEM Index displayed a significant economic bubble.
This indicates that, during the second round of the bubble, the market indeed experienced a bubble shock. This brief bubble phenomenon was largely due to the interest rate environment and the recovery pace of the Chinese manufacturing sector during the COVID-19 pandemic. The former was influenced by the Federal Reserve’s two emergency rate cuts in March, which increased monetary liquidity and raised stock valuations, resulting in a significant positive impact on the stock market. However, as the market quickly adjusted, the stock index bubble soon dissipated. Therefore, while market factors may have been a catalyst for the strategic emerging industry bubble in this round, their driving effect on the bubble’s persistence was not significant.
The latter refers to China taking appropriate measures to combat the pandemic and relatively quickly resuming work and production (Qin et al., 2023). Therefore, both domestic and international investors showed confidence in China’s economic prospects, leading to a rise in the overall stock market. However, this uptrend had distinct industry or sector characteristics (Z. Liu et al., 2023). High costs and lower revenues during the COVID-19 pandemic drove people to invest in the stock market in search of additional income sources. Among these investors, most were retail investors who were particularly optimistic about technology stocks (Qin et al., 2023). In 2019, China identified the development of strategic emerging industries as a national strategy and issued policies to promote the development of these industries at the local government level. National and local policies guided investments and encouraged investors to invest in emerging industries for higher returns. The drive from national policies and increasing investors led to industry or sector-specific bubble behaviors in strategic emerging industries.
To summarize, the monitoring results of the second round of bubbles in strategic emerging industries reveal both the inducement effect of market factors and the sustained driving effect of industry factors. The Federal Reserve’s interest rate cuts temporarily increased liquidity, bringing a positive shock to the market, but the market’s self-adjustment capability quickly calmed the bubble. Meanwhile, the recovery of China’s manufacturing sector and the support from national policies instilled confidence in strategic emerging industries, attracting investors, particularly individual investors, and further fueling the formation of industry bubbles. Therefore, the formation of the second round of bubbles in strategic emerging industries is primarily driven by long-term industry factors.
Conclusion
This study constructs a real-time bubble monitoring framework grounded in the Log-Periodic Power Law (LPPL) theory and integrates Kalman filter techniques with the CUSUM control chart method. The proposed method enables dynamic identification of potential bubble risks through real-time estimation of the drift parameter. Using daily stock index data from China’s strategic emerging industries, the empirical analysis identifies two distinct periods of super-exponential growth between 2014 to 2015 and 2019 to 2021, both of which are consistent with known episodes of asset bubbles in China’s capital markets. The findings confirm that bubbles in these industries are often fueled by short-term liquidity shocks but more fundamentally sustained by long-term factors, including government policy support and heightened investor expectations for future growth.
Further analysis differentiates between market-wide and industry-specific factors, highlighting that while general liquidity environments can act as catalysts, bubbles in strategic emerging industries are predominantly driven by sector-specific dynamics such as policy guidance and speculative enthusiasm centered on emerging technologies.
In light of these findings, this study suggests that regulatory authorities should prioritize the development of industry-specific early warning systems to capture abnormal market behaviors promptly. Fiscal policy should shift focus from broad subsidies toward more targeted measures that discourage overinvestment in overheated sectors and guide capital allocation more rationally through differentiated taxation. Regulatory transparency should be enhanced, particularly concerning listed firms in strategic emerging industries, to curb speculative behavior and improve market discipline. Strengthening these measures is crucial to mitigating systemic risks and fostering the sustainable and stable development of emerging industries.
Although this study proposes an innovative dynamic bubble monitoring framework, the Kalman filter and CUSUM methods, while offering real-time monitoring capabilities, may not fully capture structural breaks or black swan events caused by extreme external shocks. Future research could expand the model’s application to verify its generalizability across different contexts. This would involve applying it to cross-country datasets—for example, by comparing the bubble characteristics identified in this study with those in sectors like the US AI industry and Europe’s new energy industry—to explore commonalities (e.g., excessive optimism triggered by technological breakthroughs) and differences (e.g., the stronger policy dominance in China) in bubble formation. In parallel, the application could be extended to alternative asset classes, and the integration of machine learning techniques could be explored to enhance predictive accuracy and robustness under complex market dynamics. Furthermore, a key priority should be developing an extended framework, such as one based on the MIDAS model, to effectively integrate low-frequency macroeconomic variables and deepen the understanding of bubble driving mechanisms.
Footnotes
Author Contributions
Changxiu Luo: revision framework, study design, data analysis, language, revise the manuscript; Yikang Tang: Data curation, formal analysis, investigation, methodology, writing, and editing, software. Zhanyong Zou: Data curation, formal analysis, and investigation. Shulin Xu: Formal analysis, investigation, methodology, and editing. Xing Li: Conceptualization, formal analysis, writing, and editing.
Funding
The authors disclosed receipt of the following financial support for the research, authorship, and/or publication of this article: We thank the support provided by the Guangdong Provincial Philosophy and Social Sciences Planning Project [Grant No. GD25YYJ45], the 2024 Research and Cultivation project of Guangdong University of Finance & Economics [Grant No. 2024JYPY07], and the Research Project on Cultural and Tourism Statistics of Guangdong Province [Grant No. GDWLTJ-202513].
Declaration of Conflicting Interests
The authors declared no potential conflicts of interest with respect to the research, authorship, and/or publication of this article.
Data Availability Statement
The data that support the findings of this study are available from the authors upon reasonable request.