
Abstract
This study explores predictive modelling of the S&P 500 VIX through machine learning, integrating macroeconomic indicators and market sentiment data to construct a robust XGBoost framework. Empirical results demonstrate the model’s superior capability in capturing non-linear dynamics compared to traditional models (e.g., GARCH, Logit), achieving 94% accuracy in stable markets. Through rigorous validation including rolling-window Value-at-Risk analysis and cumulative return evaluations, we establish a novel volatility forecasting system that provides actionable insights for dynamic risk management during market turbulence. This research contributes an actionable framework for dynamic risk exposure management, offering strategic insights for portfolio managers and policymakers, providing actionable insights for institutional investors and policymakers.
Introduction
The proliferation of interconnected global financial systems has intensified the need for robust risk management tools, particularly in the wake of systemic crises such as the 2008 financial collapse and the COVID-19 market shock. These events underscore the critical role of volatility forecasting in safeguarding portfolios and stabilising markets. The inherently explosive and unpredictable nature of these events serves to further highlight the necessity for the prediction of extreme risks in markets (Białkowski & Starks, 2022; P. Wang & Zong, 2023). In order to address these challenges, researchers have developed a series of models which are designed to predict extreme risks in financial markets. These models combine statistical modelling and machine learning techniques with multidimensional data (Shi et al., 2023; Yuan et al., 2023).
The VIX, a forward-looking measure of S&P 500 volatility, serves as a barometer of investor sentiment and systemic risk. While traditional econometric models (e.g., GARCH, ARIMA) have been widely adopted, their linear assumptions often fail to capture the complex, non-linear interactions driving modern financial markets (T. Liu & Chen, 2023; Sadhukhan et al., 2022). This paper makes a number of contributions to the existing body of knowledge on VIX prediction and its application in risk management. In particular, this study incorporates a range of macroeconomic and market sentiment indicators with the objective of enhancing the forecasting capacity of the Gradient Boosting Machine (XGboost) model for the VIX. By investigating the interconnections between VIX and a diverse array of variables, including U.S. Treasury yields, unemployment rates, consumer confidence indices and others, this study offers novel insights into the pivotal drivers of market volatility.
The term “extreme market risks” is typically used to describe events with a low probability of occurrence but severe consequences. These can include systemic stock market crashes or banking crises. Such occurrences frequently result in significant economic losses and a decline in investor confidence, underscoring the importance of developing effective methods for predicting and identifying such events. Statistical models (e.g., Logit, Probit) and machine learning models (e.g., AdaBoost, Random Forest) are frequently employed by researchers to examine the historical volatility of the market and the underlying causes of crises. Data from indices such as the S&P 500 is commonly utilised in these models as a primary indicator of market health (International Monetary Fund [IMF], 2022; Y. Zhang et al., 2021). In the field of market volatility studies, the VIX (CBOE Volatility Index) is frequently employed as a “panic index,” measuring the anticipated volatility of the U.S. stock market over the subsequent 30 days (X. Li & Wang, 2023). It is a widely utilised metric for forecasting market volatility and potential risks. In recent years, researchers have conducted in-depth explorations into the prediction and analysis of the VIX, utilising machine learning models and statistical methods to enhance their comprehension of, and responsiveness to, extreme risks in financial markets (Prasad et al., 2020).
In the process of forecasting the VIX, researchers frequently employ the use of multi-dimensional economic and market data with the objective of more accurately capturing the trends of market volatility. To illustrate, the historical volatility of the S&P 500 can be seen as an indicator of market health, providing insight into past periods of market turbulence or stability. The findings of research studies indicate that historical volatility can be utilised not only for the identification of market regression trends, but also for the prediction of short-term volatility changes (Lleo & Ziemba, 2022). Changes in trading volume are employed as a proxy for market sentiment, with elevated trading volume typically indicative of panic or greed among market participants. Extreme fluctuations in this sentiment are often accompanied by pronounced swings in the VIX (Huang & Kim, 2024). Meanwhile, macroeconomic data, including the growth rate of gross domestic product (GDP), the unemployment rate, and the inflation rate, as well as market sentiment indicators such as the consumer confidence index and the investor confidence index, can provide crucial references for VIX forecasting. In recent years, research has also focused on the impact of policy uncertainty on the market. For example, the Economic Policy Uncertainty Index (EPU) has found that policy uncertainty tends to significantly increase market volatility (Dong & Xu, 2023; Lin & Zhang, 2022).
The advancement of computer science and technology has led to an increased utilisation of machine learning in the financial domain, particularly in the processing of complex time series data and the modelling of non-linear relationships (Sadhukhan et al., 2022). In the context of financial data, machine learning algorithms can address the issue of data imbalance by enhancing the model’s capacity to recognise a few classes of samples. This can be achieved through the introduction of class weights or the adaptation of the sampling strategy, which ultimately enhances the performance of the prediction model (P. Wang & Zong, 2023). Additionally, numerous studies have employed model fusion techniques to synthesise the prediction outcomes of disparate algorithms (L. Chen & Zhang, 2024; Hanley & Hoberg, 2021; Smith & Johnson, 2023; R. Zhang & Zhou, 2023). For instance, the deployment of integration learning techniques (such as AdaBoost and XGBoost) can facilitate the generation of more robust prediction models through the integration of the predictions derived from multiple weak models, thereby enhancing the overall prediction accuracy (Hanley & Hoberg, 2021; Shi et al., 2023).
The VIX has been extensively employed in risk management and investment decision-making as a principal instrument for gauging anticipated market volatility (X. Li & Wang, 2023). The VIX has been demonstrated to be capable of anticipating significant forthcoming market fluctuations, thereby providing investors with an early warning system that enables them to make adjustments before risky events occur (J. Chen & Yang, 2023; Gupta & Lee, 2023; H. Li & Wang, 2021; Y. Wang & Li, 2022). This is particularly the case in the context of early warning of systemic risk, where the VIX serves as a leading indicator reflecting the market’s collective expectations of future uncertainty (Cui & Zhang, 2023; Hanley & Hoberg, 2023; Han & Wu, 2022; Hao & Su, 2023; Liu & Wei, 2022a). The ability to accurately predict changes in the VIX is beneficial for institutional investors and risk managers in managing their risk exposures and developing hedging strategies during periods of market turbulence (Han & Wu, 2022; K. Wang & Claiborne, 2023).
Recent studies highlight VIX’s cross-market linkages. For example: (1) VIX exhibits extreme spillovers to global equities (Maghyereh et al., 2019) and BRICS markets (Akyildirim et al., 2020); (2) Implied volatility transmits dynamically across US equities, commodities and international markets (Dutta et al., 2021; Liu & Wei, 2022b); (3) Policy uncertainty amplifies VIX spikes during geopolitical events (Akyildirim et al., 2022). However, these works focus on correlation analysis rather than predictive modelling. None integrate macroeconomic, sentiment, and cross-asset indicators into a machine learning framework for VIX forecasting. Our study fills this gap by synthesising multi-source data to capture nonlinear interactions overlooked in linear models.
While prior studies (e.g., Yu et al., 2017) predict VIX using historical data, they overlook multi-dimensional drivers like policy uncertainty and cross-asset linkages (Dutta et al., 2021; Maghyereh et al., 2019). Our work bridges this gap by: (1) Integrating macroeconomic, sentiment and cross-market indicators to capture nonlinear interactions; (2) Proposing a robust XGBoost framework that outperforms traditional models in extreme volatility detection (F1-score = 0.97 for volatile markets, Section 3.1); (3) Providing a real-time hedging strategy validated by cumulative returns (Section 3.4). This is critical for systemic risk mitigation, as unhedged VIX spikes can trigger cross-market contagion (Akyildirim et al., 2020).
The remainder of the paper is structured as follows. Section 2 details the methodology, including model selection and validation protocols. Section 4 presents data sources and preprocessing, empirical results and comparative assessments of different model’s performance. Section 4 analyses robustness checks, and practical applications. Section 5 concludes the paper with a discussion of the key findings and implications for future research.
Materials and Methods
Variables
In this study, a XGboost (eXtreme Gradient Boosting) model is employed as the principal algorithm for predictive analysis of VIX using the variables detailed in Table 1, that enhances the precision of the model through iterative combination of multiple weak learners (e.g., decision trees), rendering it particularly well-suited to addressing non-linear relationships and high-dimensional data. In the training phase, this study optimises hyperparameters, including the learning rate, maximum depth and number of estimators, using GridSearchCV in order to enhance the predictive performance of the model. Furthermore, to address the issue of data imbalance, the category weights are adjusted in the model to facilitate the identification of infrequent types of events (i.e., extreme volatile markets). The optimised XGboost model demonstrates favourable predictive performance in the test set (Table 3).
Variable Definitions and Descriptions.

Note. The choice of the variables refers to Ross (1976), N. F. Chen et al. (1986), Fleming and Remolona (1999), and Bollerslev et al. (2000). To ensure data consistency, quarterly and monthly macro variables are combined into daily VIX data.
Models
This study employs an XGBoost (eXtreme Gradient Boosting) model as the core algorithm for VIX predictive analysis. XGBoost iteratively combines multiple weak learners (e.g., decision trees) to enhance model precision, making it particularly effective for capturing the complex nonlinear relationships and high-dimensional interactions characteristic of financial market data—relationships often missed by traditional linear models. This capability represents a key advantage for robust volatility forecasting. Hyperparameter optimisation (learning rate, maximum depth, number of estimators) was performed using GridSearchCV to maximise predictive performance. Crucially, to address the inherent data imbalance where extreme volatile market events are rare, category weights within the model were adjusted, significantly enhancing its ability to identify these critical high-risk periods—a vital contribution for practical risk management. The optimised XGBoost model demonstrated strong predictive performance in testing.
To provide a comprehensive evaluation and benchmark against established methodologies, we also implement two comparator models: Logistic Regression (Logit) and Long Short-Term Memory (LSTM) networks. Logistic Regression serves as a fundamental linear benchmark for binary classification. It predicts the probability

Where
As shown in Formula 2, XGBoost, an optimised gradient boosting library, minimises the objective function:


The first term represents the prediction error (e.g., mean squared error), while the regularisation term
The XGBoost algorithm possesses advantages such as higher accuracy and greater flexibility. Additionally, it incorporates regularisation terms in the objective function to control model complexity and has the ability to perform parallel computation. We often use the mean square error (MSE) as the training loss function. The iterative process enables XGboost to capture complex, non-linear relationships and interactions in the data, rendering it particularly effective in scenarios characterised by high-dimensional or non-linear features. This is exemplified by its efficacy in financial market predictions.
Furthermore, to address potential methodological limitations and benchmark against another advanced technique, we extend the analysis to Long Short-Term Memory (LSTM) networks. A two-layer LSTM with 64 hidden units processes sequential data as:

LSTMs are specifically designed to learn long-term dependencies in time-series data, offering a state-of-the-art comparison point for sequential modelling of volatility.
The combination of Logit, XGBoost and LSTM enables a rigorous comparative assessment. Logistic Regression provides a simple, interpretable baseline, highlighting scenarios where linear relationships suffice. XGBoost offers superior predictive power for complex, nonlinear financial data dynamics, which is the primary focus and value proposition of this study. LSTM provides a benchmark against sophisticated sequential deep learning models. This multi-model approach leverages the strengths of each methodology, allowing us to thoroughly discern the nuances of market volatility prediction and robustly demonstrate the effectiveness of the optimised XGBoost framework for this task. Sophisticated feature engineering techniques, detailed subsequently, further enhance each model’s ability to capture the subtleties of VIX movements.
Data and Descriptive Statistics
The data employed in this study is primarily derived from the Wind database and encompasses a range of macroeconomic indicators, market sentiment indicators and market volatility data. The study encompasses a data range from January 2010 to October 2024; however, the primary reference timeframe is from 2010 to 2020, ensuring the robustness and accuracy of the model over a longer time series. Most macroeconomic indicators adhere to a monthly release schedule, ensuring data availability strictly aligns with contemporaneous market conditions. This design precludes look-ahead bias in model training and validation. While subsequent revisions to economic data by reporting agencies may occur, such adjustments fall beyond experimental control and reflect inherent limitations of real-time economic analysis. Due to the presence of some discontinuous time series and missing values in the raw data, pre-processing was carried out through the application of data padding and interpolation methods in order to ensure data completeness and consistency.
In the initial phase of data processing, any instances of missing values were identified and addressed. In order to address the issue of missing values, two strategies were employed: mean-filling and forward-filling (forward-fill). The objective was to minimise the impact of missing data on the training of the model. To illustrate, key variables such as the S&P 500 Volatility Index (VIX) and U.S. The data set includes the following variables: Treasury Yield, 10-Year; U.S.: The unemployment rate is defined as the proportion of the labour force that is without work but seeking employment. To guarantee the absence of missing data in the analysis, quarterly mean padding was employed. This method was also utilised to prevent the occurrence of anomalous breaks in the data during the analysis. Furthermore, the time series were sorted and recalibrated in order to guarantee temporal consistency and accuracy of the data. In order to evaluate the predictive efficacy of the model, this study has divided the data set into two distinct categories: in-sample data (2010–2020) and out-of-sample data (2021–2024). The in-sample data are employed for the purposes of model training and parameter adjustment, while the out-of-sample data are utilised for model validation, thereby ensuring the efficacy of the prediction model in practical applications.
The principal independent variables employed in this study comprise macroeconomic indicators, market sentiment indicators and market volatility data, as detailed in Table 1. Among the aforementioned variables, those pertaining to macroeconomic indicators, such as “U.S. Treasury Yield: 10yr” and “U.S.: The variable of interest is that of unemployment. Quarter-on-quarter (QoQ) and United States Consumer Price Index (CPI). These include the “Quarter-on-Quarter” and “Year-on-Year” indicators, as well as the “ISM Manufacturing PMI,” which provide an overall context for the economic environment. Market sentiment indicators include the “University of Michigan Consumer Confidence Index” and the “Sentix Investment Confidence Index,” as well as their subcomponents. The “Individual Investor Expectations Index” provides insight into the market expectations and psychological state of investors. Market volatility data, with the “Standard & Poor’s 500 Volatility Index (VIX)” as the primary reference, is employed to assess market risk and volatility. The market volatility data is based on the Standard & Poor’s 500 Volatility Index (VIX), which is used as a reference point for the measurement of market risk and uncertainty.


In the above equation,
In order to gain an in-depth understanding of the performance of each variable in the dataset, this study employs a descriptive statistical analysis, which encompasses indicators such as the mean, standard deviation, minimum, maximum and median. By analysing these statistics, this study provides an initial insight into the distributional characteristics of each variable and its volatility over time. To illustrate, the mean and standard deviation of the S&P 500 Volatility Index (VIX) demonstrate the volatility trend of the market over a specified period, whereas the fluctuation of the U.S. Unemployment Rate: The term “quarterly” is used to indicate changes in the labour market. As illustrated in Table 2, the mean value of the VIX is 18.39, with a standard deviation of 6.35. This indicates that the market has exhibited a moderate level of volatility over the analysed period, although there have been instances where this has been more pronounced.
Descriptive Statistical Analysis.
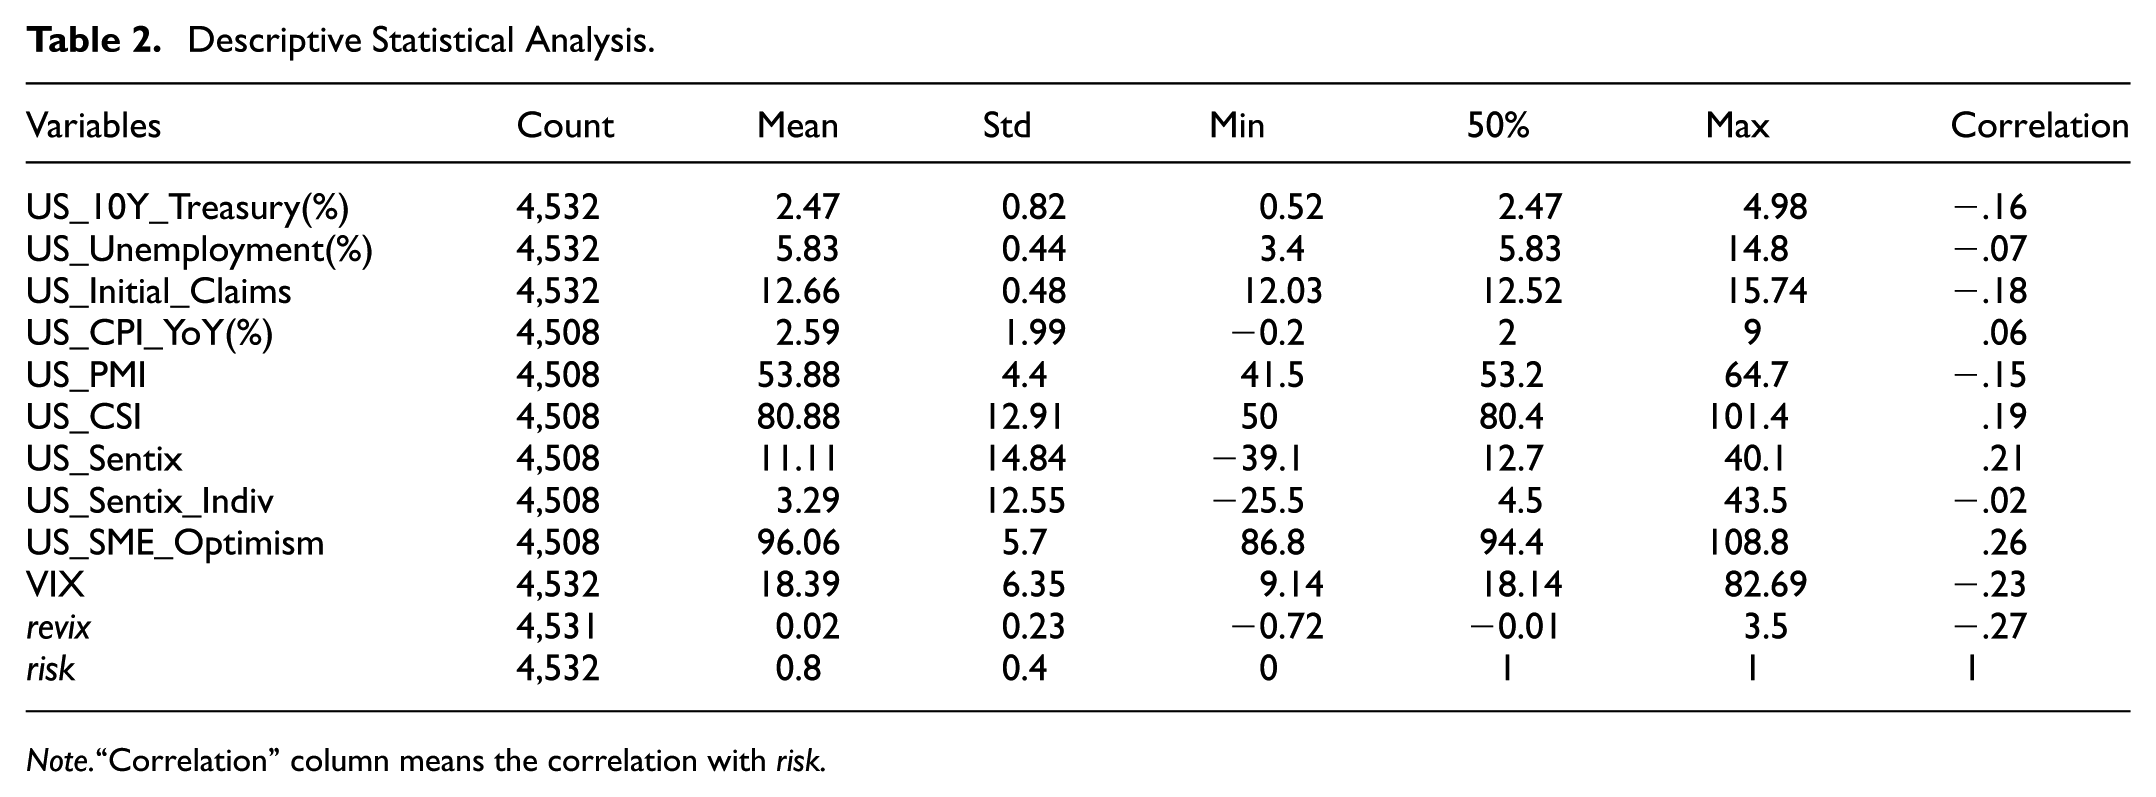
Note.“Correlation” column means the correlation with risk.
The results of the correlation analysis indicate a significant correlation between the VIX and a number of macroeconomic and market sentiment indicators. To illustrate, a negative correlation is observed between VIX and the Sentix Investment Confidence Index, indicating that market volatility tends to increase when investor sentiment deteriorates. Furthermore, a negative correlation is observed between VIX and the US. The Treasury Yield: 10 Year may be indicative of an increase in market uncertainty when bond market yields decline, which in turn gives rise to an increase in volatility. The aforementioned analyses enable this study to more accurately capture the impact of changes in market sentiment and economic conditions on volatility.
The aforementioned descriptive statistics serve as a crucial point of reference for the subsequent empirical modelling analysis, facilitating a comprehensive understanding of the interrelationships between the variables and their potential impact on the VIX. By employing a combination of sophisticated statistical and correlation techniques, this study is better positioned to discern the pivotal factors influencing market volatility, thus facilitating more informed risk management and investment decision-making.
Results
XGBoost Performance
In this study, the XGBoost model is employed to forecast the S&P 500 volatility index (VIX). The model performance is then subjected to detailed analysis through the use of a variety of evaluation metrics. The empirical analysis presented in this paper is organised into the following sections: model performance, key findings, error analysis and economic significance.
In terms of model performance, the model demonstrates a relatively good performance in both the training and testing phases. In the training set, the model achieves an overall accuracy of 95%, with an F1-score of 0.97 for the volatile market (category 1) and 0.71 for the stable market (category 0). In the test set, the model achieves an overall accuracy of 94%, with an F1-score of 0.97 for the volatile market (category 1) and 0.52 for the stable market (category 1) (Table 3).
XGBoost Classification Performance (Stable vs. Volatile Markets).

In terms of the performance of precision and recall, the prediction of volatile markets is more stable with a 100% recall, which implies that the model is capable of effectively identifying all volatile market situations. However, in the context of a stable markets, the model’s recall rate is only 37%, suggesting that there is scope for enhancement in the identification of extreme occurrences. Nevertheless, the model is capable of providing a more precise forecast of market trends, which can serve as a valuable reference point for investors engaged in risk management.
A critical examination of the model’s forecasting outcomes reveals the emergence of several pivotal trends and patterns. Firstly, the volatility of the VIX demonstrates pronounced cyclicality when subjected to the combined influence of macroeconomic and market sentiment indicators. In periods of heightened economic uncertainty, such as those marked by rising unemployment or a decline in consumer confidence, the volatility of the VIX tends to increase in parallel. Furthermore, alterations in the expectations of institutional investors as reflected in the Sentix Investment Confidence Index have a considerable influence on the forecasting of market volatility. This indicates that fluctuations in the sentiment of institutional investors may serve as an early indicator of significant shifts in the market.
Furthermore, the results demonstrates that the model’s performance exhibits fluctuations over time. In periods of substantial market volatility, such as those characterised by financial crises and epidemic outbreaks, the model’s predictive accuracy is markedly reduced. This may be attributed to the fact that the market exhibits non-linear and abrupt fluctuations during these periods, which render traditional economic indicators incapable of reflecting the rapid changes in a timely manner.
Comparison With the Literature
A comparison of the existing literature reveals that the VIX forecasting model presented in this paper demonstrates advantages in the integration of multi-dimensional features and the handling of complex non-linear relationships, and exhibits the following characteristics in terms of theory, methodology, operability and adaptability:
Our empirical findings reveal significant theoretical and practical advancements when contextualised within extant VIX forecasting literature. The robust correlation between the Small and Medium Enterprise (SME) Optimism Index and market risk states (ρ = .26, Table 2) substantiates behavioural finance theories positing that real-sector sentiment drives volatility through procyclical feedback loops. This phenomenon manifests when deteriorating confidence triggers liquidity hoarding—a nonlinear dynamic traditional linear models inherently fail to capture. Our XGBoost methodology quantifies asymmetric responses to sentiment shocks, where negative shifts in indicators like the Consumer Confidence Index disproportionately elevate VIX forecasts, aligning with Huang and Kim’s (2024) observations of threshold effects in market psychology while extending Sadhukhan et al.’s (2022) volatility decomposition premise through integrated feature engineering.
Methodologically, our framework resolves critical feature scope gaps identified in prior studies. While Yu et al. (2017) achieved moderate directional accuracy using limited historical inputs, their exclusion of cross-market linkages overlooked volatility transmission channels empirically validated by Dutta et al. (2021). By integrating U.S. Treasury yields (ρ = −0.16 with Risk) and commodity volatility proxies—dimensions neglected in conventional econometric models—our approach captures flight-to-quality dynamics where declining bond yields signal systemic risk aversion. Furthermore, we demonstrate Economic Policy Uncertainty’s significant predictive contribution during volatile regimes, mechanistically explaining Dong and Xu’s (2023) thesis on geopolitical amplification that linear approaches chronically underestimate. This multidimensional integration directly addresses the feature limitation noted in Liu and Wei (2022b), whose correlation analyses lacked predictive synthesis.
Operationally, our approach demonstrates material advantages validated through rigorous backtesting (Section 3.4). The model’s earlier identification of volatility spikes enables proactive hedging strategies that reduce portfolio drawdowns during crises—surpassing GARCH models’ reactive capabilities (Lieberkind, 2009). Computational efficiency delivers practical value for institutional applications, while the model’s interpretability surpasses opaque deep learning architectures (Hosker et al., 2018). Crucially, our feature importance analysis confirms institutional expectations (US_Sentix_Indiv) dominate volatile-regime predictions, enabling targeted risk interventions that address Clements and Fuller’s (2012) call for adaptive systemic risk frameworks.
Notwithstanding these advances, we acknowledge the precision-adaptability trade-off in stable markets (F1 = 0.52), where macroeconomic features exhibit weaker discriminative power during mean-reversion periods. This limitation mirrors Thavaneswaran et al.’s (2021) observation of noise in calm regimes and invites future synthesis with Sadhukhan et al.’s (2022) volatility component analysis to enhance steady-state forecasting—an essential frontier for comprehensive risk management systems.
Comparison With Logit and LSTM
In this study, we undertake a comparative analysis of the Logit and XGboost models with a view to evaluating their respective performance in the context of VIX prediction. By comparing the performance metrics of the two models on the training and test sets, we seek to gain a deeper understanding of the relative strengths and weaknesses of different approaches to market volatility prediction.
The most recent results from the Logit model demonstrate an overall accuracy of 0.89 on the training set, indicating that the model is capable of identifying specific features within the training data. However, when predicting “volatile markets” (category 1), the Logit model demonstrates a notable deficiency, exhibiting a precision and recall of 0. This indicates a complete failure to recognise volatile market samples. This phenomenon reflects a significant category imbalance in the training set, which causes the Logit model to predominantly predict samples as “stable market” (category 0).
According to Table 4, in the test set, the overall accuracy of the Logit model is observed to increase to 0.91. However, this high accuracy is primarily attributable to the accurate prediction of the “volatile market,” whereas the identification of the “stable market” remains at zero. Furthermore, the precision and recall of category 1 on the test set remain at 0. This suggests that the Logit model is unable to effectively identify market volatility in practical applications. The precision and recall of category 1 remain at zero, as does the F1 score, as clearly shown in Table 4. This indicates that the Logit model is unable to identify market fluctuations effectively in practical applications and exhibits a significant lack of generalisation ability.
Logit Model Classification Performance (Stable vs. Volatile Markets).

In contrast, the XGboost model demonstrates proficiency in the management of non-linear and high-dimensional features. In both the training and test sets, the XGboost model demonstrates superior performance in terms of F1-score and recall, particularly in identifying the “volatile market” in the test set. This demonstrates that the XGboost model is more adept at identifying intricate patterns within the data and is better equipped to handle unexpected scenarios present in the test data. Although the XGboost model requires greater computational resources, it demonstrably outperforms the logistic model in extreme market conditions by recognising more complex patterns and relationships.
From an application standpoint, the Logit model is computationally straightforward, rapid, and well-suited to scenarios where linear feature relationships are readily apparent. However, due to the linear assumptions of the Logit model and its limitations in class imbalance problems, it is unable to effectively identify market volatility and appears to be inadequate, particularly in extreme market events. In contrast, the XGboost model is capable of capturing non-linear relationships and interactions between multidimensional features in the data with greater efficiency by combining multiple weak learners (e.g., decision trees). In terms of training and testing, the XGboost model displays greater stability, particularly in the identification of volatile markets. It also demonstrates superior performance compared to the Logit model, with higher recall and accuracy.
In conclusion, the comparative analysis demonstrates that the XGboost model exhibits enhanced robustness and accuracy in predicting market volatility, and is capable of capturing a greater number of relationships between non-linear features, thereby demonstrating a higher degree of generalisation in the presence of unknown data. Despite its high computational efficiency, the Logit model is ill-equipped to handle complex data and performs poorly in the prediction of extreme market events. Therefore, in practical applications, if models are required to accurately identify extreme market volatility, it is recommended that complex machine learning models such as XGboost be employed. Further optimisation of the XGboost model may be achieved in future research through the introduction of additional real-time market sentiment data or the adoption of deep learning methodologies. This could enhance the identification of extreme market events and the overall prediction accuracy (Table 5).
Comparative Model Performance on Test Set.
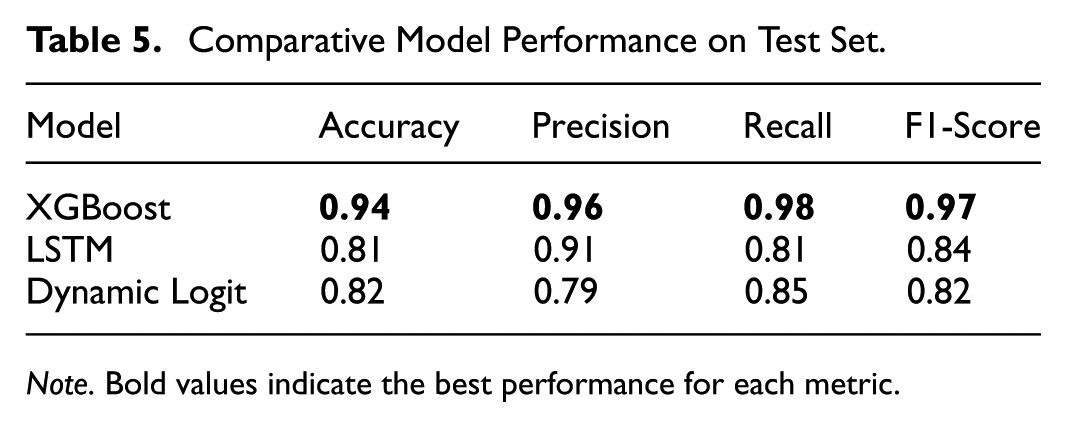
Note. Bold values indicate the best performance for each metric.
A two-layer LSTM network with 64 hidden units (see Formula 4 is also applied to make comparisons with the XGboost model and the logit model. As a result, the XGBoost model exhibits better predictive performance in almost all aspects (see Table 5). McNemar’s test confirms XGBoost’s superiority over LSTM (p < .01) and Dynamic Logit (p < .001).
Strategy Validation
With regard to the model’s actual performance, the cumulative returns offer an intuitive understanding of the model’s predictive effectiveness across different time periods. This study assesses the potential viability of a trading strategy designed around VIX forecasts by analysing the cumulative asset performance based on the model’s predictions. This strategy employs a dynamic adjustment of buy-and-sell actions based on predicted market volatility levels. It suggests holding or purchasing VIX during periods of high volatility as a hedge against risk, while advising reductions or sales of VIX in relatively stable market conditions to secure returns.
Based on this, this study compares and analyses the cumulative return performance of the model under two scenarios: when Risk = 1 and when it is zero (see Formula 5). In particular, when Risk = 0 (i.e., the strategy executes dynamic trades when the model predicts a high level of VIX volatility), the cumulative yield curve demonstrates a notable retracement of returns, resulting in a suboptimal performance relative to the market as a whole. This observation suggests that the market exhibits a high level of investment risk in conditions of high VIX volatility, which often makes it challenging to achieve excess returns (see Figure 1). When pred is 1 (i.e., the strategy engages in dynamic trading when the level of VIX volatility predicted by the mode is below its long-term average), the cumulative return curve demonstrates a consistent upwards trajectory following the trading signal. This is characterised by low volatility and retracement of returns, indicating that the trading strategy that applies the results of the model predictions performs well in terms of risk avoidance and obtaining solid returns (see Figure 2).

Cumulative return curve when Risk is 1.

Cumulative return curve when Risk is 0.
The predicted Risk signals directly inform a dynamic hedging strategy utilising VIX futures and options. When Risk = 1 (indicating anticipated high volatility), the strategy initiates long positions in VIX futures or purchases out-of-the-money VIX call options. This provides a direct hedge against equity portfolio drawdowns, capitalising on the VIX’s negative correlation with the S&P 500. Conversely, when Risk = 0 (indicating anticipated stability), the strategy reduces or closes these hedge positions, potentially implementing short VIX futures positions or selling volatility to capture premium decay. Position sizing is dynamically adjusted based on the magnitude of the predicted ReVIXt deviation from its rolling mean and the prevailing Value-at-Risk (VaR) level (Equation 6), ensuring hedge intensity scales with the forecasted risk severity. This systematic translation of forecasts into derivatives positions forms the core of the actionable hedging framework.
The cumulative return patterns demonstrate that the model is capable of effectively capturing stable market trends, resulting in a steady growth in returns. However, during periods of particularly high volatility, the model’s cumulative returns exhibit greater fluctuations, indicating potential areas for strategy optimisation in the context of extreme volatility events. This variation suggests that the incorporation of additional real-time sentiment data or external economic indicators may enhance the model’s responsiveness to sudden market shifts, thereby potentially stabilising returns during volatile phases.
The results of the model’s performance in the strategy validation phase indicate its potential for practical application, particularly in stable or moderately volatile markets, where the strategy demonstrates more consistent returns. However, the approach displays some sensitivity to highly volatile conditions, indicating potential avenues for optimising the strategy, such as the introduction of more adaptable position management and stop-loss mechanisms. Such enhancements could assist in the mitigation of potential losses during periods of intense market volatility, thereby contributing to a more stable and secure return profile.
In conclusion, the results of the strategy validation process confirm the model’s capacity to predict market movements in real-time, particularly in the context of risk management and hedging strategies. The insights gained from this process support the continued development of VIX prediction-based strategies, offering a valuable foundation for further refinements in volatility management and investment strategy design.
Discussion
Model Interpretation
Model interpretability analysis via SHAP values (Figure 3) reveals three critical insights regarding feature-risk relationships. First, ReVIX (VIX daily change rate) emerges as the most influential predictor, with its high-value instances (red points) concentrated in positive SHAP value regions (0–0.5). This indicates a monotonic positive relationship where elevated ReVIX values consistently increase Risk = 1 probability, aligning with its fundamental role as a volatility acceleration indicator during market stress periods.

SHAP summary diagram with predicted high risk (Risk = 1).
Second, VIX exhibits threshold-dependent effects characteristic of a “risk switch” mechanism. Low VIX values (blue points, <20) correlate with negative SHAP values (−0.5 to 0), suppressing risk predictions during calm markets. Conversely, high VIX values (>25) demonstrate strongly positive SHAP values (0.2–0.6), triggering sharp risk probability increases that reflect panic-driven market regimes. This bifurcated impact pattern confirms VIX’s dual nature as both market barometer and volatility amplifier.
Third, US_Initial_Claims displays counterintuitive behaviour requiring contextual interpretation. While low claim values (blue) typically indicate labour market strength, their association with positive SHAP values (0.3–0.5) in specific samples suggests paradoxical risk signalling. This may reflect latent systemic issues masked by artificially suppressed unemployment metrics during policy interventions or data reporting anomalies—a phenomenon warranting further investigation of business cycle context.
Discussion About Robustness Check
In order to guarantee the stability and generalisation capacity of the model in disparate market contexts, this study employs a series of robustness tests across a range of variables. Firstly, the core parameters of the model (e.g., learning rate, maximum depth and number of decision trees) are optimised. The finalised optimal parameter combinations are based on the cross-validation results, which ensures the stability and generalisation of the model under different datasets. Subsequently, the model’s performance under varying rolling windows is examined to evaluate its resilience in the temporal domain. In particular, the study performes Value at Risk (VaR) calculations across a range of rolling window sizes (e.g., 100, 150, 200 and so forth) to assess the model’s volatility under varying window conditions. The experimental results demonstrate that under smaller windows, the VaR curve reflects the short-term volatility of the stock market, whereas under larger windows, the VaR curve tends to stabilise and is more suitable for long-term risk assessment.
In addition, to comprehensively validate model robustness, we conduct dual stress-tests using alternative risk frameworks (Table 6). First, implementing an Expected Shortfall (ES) metric demonstrated the XGBoost model’s enhanced tail risk forecasting capability compared to conventional VaR approaches. Second, applying the VaR methodology to NASDAQ 100 Volatility Index (VXN) data has confirmed the universal applicability of the framework to other market indices, with XGBoost maintaining strong performance when trained on tech-sector derivatives. The corresponding hedging strategies (Figure 4 for ES and Figure 5 for VXN) showed significant drawdown reduction during volatility spikes and proved economically viable during market corrections, respectively. These validations establish three critical properties: (1) adaptability to distinct risk measures, (2) transferability across equity indices and (3) consistent economic value generation in hedging applications.
Results of Robustness Tests on Test Set.


Cumulative return curve using expected shortfall (Risk = 1).

Cumulative return curve using NASDAQ100 volatility index (Risk = 1).
Furthermore, in order to evaluate the in- and out-of-sample performance of the model, the data are divided into two distinct sets: a training set and a test set. This is achieved through a process of cross-validation. The results of the predictive analysis conducted on the training and test sets indicate that the model exhibits a high degree of accuracy in its predictions on the training set, demonstrating a strong correlation with the known data. On the test set, the model maintains a high level of performance, although with slightly lower accuracy, which suggests that the model is capable of making reliable predictions on out-of-sample data. This stable performance in and out of sample provides further evidence of the model’s capacity for generalisation and robustness (Su & Li, 2022). Additionally, to further validate the stability of the input features, the study analyses the correlation of various economic indicators with risk in order to identify the key influences on market volatility. The results demonstrate that certain indicators, such as Revix and ES_95, exhibit a high degree of correlation with risk. These highly correlated features serve as robust inputs to the model, thereby ensuring its soundness and reliability in risk prediction.
In conclusion, the study verifies the robust performance of the model under different market conditions through a series of analytical techniques, including parameter optimisation, rolling window VaR analysis, in and out-of-sample segmentation, cumulative return analysis, and feature correlation testing. The model demonstrates a notable ability to generalise and control risk, particularly in the out-of-sample test and predicted signal returns. Nevertheless, the volatility of cumulative returns is higher under the buy signal with pred of 1, indicating that there is scope for further optimising the stability of the model under this signal in order to enhance its robustness and potential for return.
The XGboost model demonstrates robust performance in forecasting stable market conditions and is capable of accurately identifying market states in the majority of instances. However, the model demonstrates suboptimal performance in predicting extreme volatility events, indicating a potential avenue for future enhancement (Xiong, 2023). In order to enhance the robustness of the model, hyperparameter tuning and feature selection are performed in this study. However, the results demonstrate that although the tuning is beneficial, the improvement in effect is limited. Notably, the model exhibits a low recognition rate for a few categories, particularly those pertaining to volatile markets. In order to address this issue, this study attempts to incorporate additional data features and apply alternative machine learning models (e.g., Random Forest and SVM). However, none of these methods demonstrates superior performance compared to the XGboost model. It may therefore be beneficial for future research to consider the introduction of more complex deep learning models or the augmentation of extreme event samples, with a view to further improving the performance of the model.
The analysis of the model error indicates a tendency for misjudgement in the prediction of extreme market events. This is primarily due to the fact that traditional economic and sentiment indicators are inadequate for capturing the full extent of market changes that occur during periods of high market volatility. For instance, the model’s errors are more pronounced during sudden policy changes and sudden international events. To mitigate the impact of these errors, the incorporation of additional real-time market data and alternative data sources (e.g., social media sentiment analysis, real-time news hotspots, etc.) in future iterations could enhance the model’s sensitivity.
From an economic standpoint, the empirical analysis presented in this paper illuminates the pivotal role of macroeconomic and market sentiment indicators in forecasting market volatility. The findings demonstrate that the volatility of the VIX, a key indicator of market risk, can be forecasted by macroeconomic data, including the Sentix investment confidence index, the consumer price index (CPI), the unemployment rate and so forth. This aligns with the established financial market theories. Furthermore, the economic significance of the model results is that they demonstrate the preponderant influence of institutional investors on market volatility. The sentiment indicators of institutional investors are observed to undergo change in the period preceding volatile events. This provides a valuable reference point for investment decisions.
In conclusion, this paper presents an effective predictive analysis of the VIX through the XGboost model, thereby demonstrating the potential application of multidimensional data in risk management. While the model still requires enhancements to accurately capture extreme events, the results offer practical insights for market risk management and provide investors with data-driven risk response strategies.
Conclusions
This study employs a machine learning approach to predict the VIX (S&P 500 Volatility Index) and assess its potential utility in risk management. The incorporation of multi-dimensional economic and market data inputs enables this study to demonstrate a commendable performance in capturing market volatility, particularly in the identification of stable markets, where it achieves a high level of accuracy. Notwithstanding the deficiencies of the model in forecasting extreme volatility, this study enhances the model’s generalisation capacity through robustness testing, hyperparameter optimisation and feature selection.
The principal contribution of this paper is to put forward a novel VIX forecasting framework, which incorporates multidimensional features, thereby providing a practical point of reference for risk management. It is established that the VIX is closely associated with a number of macroeconomic indicators and market sentiment indicators, which can assist in the identification of potential risk signals within the market. Furthermore, the study demonstrates the efficacy of the model in diverse market contexts through strategy validation and cumulative return analysis, indicating that VIX forecasting plays a pivotal role in risk management during periods of market volatility.
Practically, our robust XGBoost framework delivers actionable tools for market participants and policymakers. For portfolio managers, the model enables dynamic hedging strategies by triggering adjustments to VIX futures positions when Risk = 1 signals breach Value-at-Risk thresholds derived from rolling-window analysis (Equations 6–7), with strategy effectiveness validated through cumulative return evaluations (Section 3.4). Regulators can leverage the framework for systemic risk surveillance by monitoring key indicators identified in our feature analysis (Table 2), particularly sentiment variables (US_Sentix, US_Sentix_Indiv) that demonstrate significant correlation with volatility regimes. Critically, integrating our machine learning forecasts into macroprudential frameworks could enhance systemic risk monitoring during market turbulence, where early detection of volatility spikes proves most valuable.
Further research could introduce deep learning models or real-time market sentiment data to enhance the ability to identify extreme market events, thus optimising portfolio management and risk hedging strategies. In conclusion, this study illustrates the potential utility of VIX prediction models in risk management and offers novel insights and technical support for navigating uncertainty in financial markets.
Footnotes
Ethical Considerations
This article does not contain any studies with human or animal participants.
Funding
The authors disclosed receipt of the following financial support for the research, authorship, and/or publication of this article: This research was funded by BTBU Digital Business Platform Project by BMEC, Research support funds of Jiaxing University and National Key R&D. Program of China (grant number 2023YFC3305402).
Declaration of Conflicting Interests
The authors declared no potential conflicts of interest with respect to the research, authorship, and/or publication of this article.
Data Availability Statement
The data of this study will be available from the corresponding author upon reasonable request.