
Abstract
Understanding the drivers of CO2 emissions has been necessary in drafting policies to curb global warming. In this study, we examine the impact of disaggregated financial development components on CO2 emissions by taking into account the multifaceted and complicated structure of modern financial systems in 46 countries of Sub-Saharan Africa between 1991 and 2016. The empirical models are estimated using a system-GMM approach. The analysis shows that the development of financial markets and their components, including access, depth, and efficiency, contribute to CO2 emissions in the region. For financial institutions development and its sub-measures, similar effects are observed. However, financial market development has less adverse environmental effects than the development of financial institutions. Renewable energy consumption also leads to substantial reductions in CO2 emissions. The financial markets are playing an increasingly important role in complementing renewable energy for environmental improvement. The study also indicates that the relationship between these variables and CO2 emissions varies at a country-level depending on the economy of the country. The study also discusses the policy implications of these findings.
Introduction
Global warming and environmental degradation have become two of the most pressing global issues in recent decades. This can be attributed to the increasing emission of greenhouse gases. When it comes to greenhouse gas emissions, carbon dioxide (CO2) emissions are the most harmful as they have a negative impact on humans and the environment. About 76.7% of total greenhouse gas emissions are attributed to CO2 emissions (Stocker et al., 2014). Increasing use of conventional energy sources such as coal, gas, and oil is the main source of CO2 emissions, which are detrimental to the environment and human health. It is reported that polluting energy sources account for around 68% of CO2 emissions (International Energy Agency, 2019). Thus, the mitigation of CO2 emissions has received considerable attention from researchers and policy makers as it is critical that policy makers understand the main driving factors of CO2 emissions and environmental degradation.
One of the most feasible solutions to mitigate CO2 emissions while maintaining a country’s economic growth is the implementation of renewable energy sources. To this end, a number of countries are making efforts to gradually convert polluted energy sources to clean ones (biomass, hydro, geothermal, solar, and wind), as well as improving efficiency and conserving energy. Consequently, the share of renewable energy in the total energy consumption in developed and developing economies has increased over the past few years (see, Alizadeh et al., 2020; Baul et al., 2018; Farhani & Shahbaz, 2014; Kung et al., 2017; Praveen et al., 2020; Sinha et al., 2018). There are two main advantages to using renewable energy over nonrenewable energy. First, renewable energy is considered to be an innovative solution for controlling environmental degradation because it emits less CO2 when compared with conventional energy, and second, it provides high energy security for meeting the increasing energy demand (Paramati et al., 2017). In light of renewable energy’s importance, its adoption can reduce CO2 emissions as well as other pollutants significantly.
Similarly, the existing literature argues that financial development also contributes significantly in CO2 emissions. Theoretically, there are two types of effects of changes in financial development on CO2 emissions. Firstly, an increase in direct financing across the entire financial sector contributes to CO2 emissions. A trade-off theory of corporate finance (Myers, 1984) suggests that there are tax shield benefits, a cost of financial distress, and a cost of debt agency (Jensen & Meckling, 1976; Yao & Tang, 2021). In general, the conventional industrial sector, which is energy intensive and polluting is characterized by high leverage ratios (Gokmenoglu et al., 2015). Direct financing provides companies with a way to expand when debt financing runs out. Expanding direct financing on such a scale may not be environmentally friendly, as is often the case in manufacturing, specifically in developing countries where institutions may be of poor quality (Yao & Tang, 2021). Therefore, this could lead to an increase in energy consumption and CO2 emissions.
Secondly, when direct to indirect funding is higher, CO2 emissions decrease. As described by pecking-order theory (Myers & Majluf, 1984), companies first prefer internal financing, then external debt, and finally equity due to asymmetry of information and profitability. The technology effect, which is promoted by the stock market over the credit market, has the potential to increase energy efficiency (Mahalik & Mallick, 2014; Tamazian et al., 2009). Listed companies must provide more information and their social responsibility is more influenced by investors (Mishra, 2017), thus environmentally friendly firms have a higher estimated value (Bardos et al., 2020). Under this scenario, along with publicly traded companies that are environmentally-friendly, the direct/indirect funding ratio would be negatively related to CO2 emissions. Recent studies have included financial development as a core explanatory variable in their empirical models. However, the findings of existing empirical studies on the effect of financial development on environmental degradation are mixed and unclear. For instance, one segment of existing literature shows that financial development has a positive effect on CO2 emissions (Ali et al., 2019; Al-Mulali, Ozturk et al., 2015; Boutabba, 2014; Kayani et al., 2020; Zhang, 2011), while others suggest opposing influence on environmental degradation (Abbasi & Riaz, 2016; Al-Mulali, Tang et al., 2015; Gill et al., 2019; Tamazian et al., 2009; Xing et al., 2017).
In this context, there have been few studies investigating the effect of financial development on CO2 emissions. Based on the conflicting results of these few investigations, Zhang (2011), Haseeb et al. (2018) and Acheampong et al. (2020) suggested that more empirical research is needed in order to clarify these contradictory findings. Therefore, additional research is required to understand the impact of financial development on CO2 emissions. Additionally, most of the studies measure financial development through aggregating different measures (e.g., Boutabba, 2014; Shahbaz et al., 2018; Yao & Tang, 2021) while some existing studies measured financial development by combining variables of stock market and financial intermediation (Abbasi & Riaz, 2016; Zhang, 2011). To the best of our knowledge, no study has investigated the impact of financial development on CO2 emissions through a disaggregated analysis, and that is where our study contributes. In comparison to the role played by the development of financial markets, financial institutions may have a different impact on CO2 emissions. To validate our argument empirically, we disaggregate the effects of financial institutions and financial markets development, as well as sub-indices of these (depth, access, efficiency) on CO2 emissions in Sub-Saharan Africa. Furthermore, empirical evidence is lacking on how financial development moderates renewable energy consumption to impact on CO2 emissions. Lastly, there is limited information regarding how financial development impacts CO2 emissions in Sub-Saharan Africa. In light of these knowledge gaps and the lack of consistency in the literature, this study examines the effects of financial markets and financial institutions development and their sub-indices (depth, access, efficiency) on CO2 emissions in Sub-Saharan Africa countries.
For this study, 46 Sub-Saharan African (SSA) countries are considered to determine the impact of disaggregate components of financial development on CO2 emissions. What motivated the choice of Sub-Saharan Africa? It is important to understand how financial development affects CO2 emissions in SSA because SSA is the region that contributes the least to global CO2 emissions. Despite that, CO2 emissions in the region continue to rise. For instance, during the decade from 2000 to 2010, CO2 emissions increased from 550 million to 708 million tons, and then increased more to 738 million tons in 2012 (see Adams & Klobodu, 2018). A number of adverse effects of climate change are already affecting SSA, including droughts, hunger, conflicts, disease spread, and flooding (Serdeczny et al., 2017). To this end, we need to identify the underlying factors that are driving carbon emission increases in SSA in order to formulate policies to mitigate it before it becomes uncontrollable.
SSA also has one of the world’s most underdeveloped financial systems. Allen et al. (2011) claim, for instance, that SSA had poorer financial inclusion and domestic credit access prior to the 2008 financial crisis. The SSA financial system has recently improved, but it remains the least developed among developing regions (Allen et al., 2013). Thus, investigating how financial development impacts CO2 emissions in SSA can have implications for climate change policy and sustainable development. Hence, if financial development reduces CO2 emissions, SSA will be better equipped to achieve sustainable development goals. In contrast, if financial development increases CO2 emissions, then the models for forecasting emissions and the climate change policies in SSA may be affected.
The current paper extends the literature in a number of ways. (1) To the best of our knowledge, no study distinguishes between financial markets and financial institutions to measure financial development in SSA. (2) A vast body of literature has focused on a simple and one-dimensional indicator of financial development. Based on Sadorsky (2011) and Kakar (2016), a variety of financial development measures may demonstrate different relationships between financial development and energy consumption, which implies that these different proxies may impact environmental quality in different ways. Most importantly, financial systems have developed globally and now exhibit a greater level of complexity and multidimensionality. For instance, besides banks, a range of other financial institutions also play an important role in economic development, such as insurance companies, investment banks, venture capital firms, pension funds, and mutual funds. Similar to this, the financial markets have become more advanced in many ways which help businesses and individuals diversify their savings through bonds, stocks, and wholesale money markets (Aizenman et al., 2015). Due to the diversity of financial systems across nations, financial development needs to be measured with multiple indicators. Therefore, in order to overcome the limitation of using a single measure, an array of measures for financial development are used in order to explore the relationship between financial development and CO2 emissions, which was recently developed by the International Monetary Fund (IMF) by utilizing a multi-dimensional approach. (3) Renewable energy use is included in the CO2 emissions function to investigate the nexus between it and environmental degradation. (4) The study also examines the moderating effect of each sub-measure of financial development and renewable energy consumption on CO2 emissions. (5) To add more insight to our empirical analysis, we divide a panel of Sub-Saharan Africa countries into high-income and low-income groups. In addition, we apply a dynamic system generalized-method-of-moment (SYS-GMM) to estimate the empirical models, which reduces the possibility of endogeneity. The study also suggests policies to reduce CO2 emissions from a perspective of financial development.
The remainder of the paper is as follows: An overview of the literature is presented in section 2. Section 3 presents the methods, models, and data. In section 4, empirical findings and their discussion are presented. In section 5, conclusions and policy implications are discussed.
Literature Review
Financial Development and Environment Degradation
Many empirical studies have used single and different simple proxies of financial development to explore its impact on environmental quality. The findings, however are mixed across countries and regions. A group of existing literature uses a single and simple proxy for measuring financial development and reports a positive link between financial development and CO2 emissions. For instance, Boutabba (2014) explored the relationship between carbon emissions and financial development along with other variables for the Indian economy over the period 1971 to 2008. The author found that financial development measured by domestic credit to private sector increases environmental degradation. Al-Mulali, Ozturk et al. (2015) investigated the link between CO2 emissions and financial development (domestic credit to private sector) in Europe by using the cointegration test and fully modified ordinary least square (FMOLS) model. Their empirical findings revealed that the financial development effect worsens environmental quality. In the case of 29 China provinces, Hao et al. (2016) employed system-GMM to investigate the effect of financial development on CO2 emissions and indicated a positive effect of financial depth measured by loans and deposits to GDP ratio on emissions of CO2. For Malaysian economy, Maji et al. (2017) used a proxy of domestic credit to private sector by banks for financial development to examine its impact on sectoral CO2 emissions and reported a positive relationship between financial development and CO2 emissions in caseof transportation, oil and gas sector. Using the autoregressive distributed lag (ARDL) technique, Ali et al. (2019) investigated the connection between the development of the financial sector and carbon dioxide emissions in Nigeria for the period of 1971 to 2010. The empirical findings found that financial development measured through domestic credit to the private sector as a share of GDP increases CO2 emissions. More recent study by Kayani et al. (2020) found that financial development measured by domestic credit to private sector as a share of real GDP has a positive relationship with environmental degradation in the case of the top 10 CO2 emitter economies.
Another group of empirical studies uses individual and simple indicators of financial development and reports a negative nexus between development of the financial sector and CO2 emissions. Tamazian and Rao (2010) checked the influence of financial development measured by financial liberalization on CO2 emissions by using a random effect and GMM model for 24 transitional economies and found that financial liberalization improves the quality of the environment. For South Africa, Shahbaz et al. (2013) revealed that financial development through domestic credit to private sector ratio reduces CO2 emissions. Similarly, Dogan and Seker (2016) employed a panel econometric model to investigate the determinants of CO2 emissions in OECD countries for the period 1975 to 2011. They used the domestic credit to private sector to GDP ratio as an indicator of financial development. The empirical results indicated that development of the financial sector reduces environmental degradation. Using the Johansen cointegration technique, Paramati et al. (2017) examined the relationships among stock market growth, foreign direct investment, renewable energy and carbon emissions across developed and developing economies of G20 over the period 1991 to 2012. The empirical results reported that stock market capitalization reduces environmental degradation in developed economies. Using first-generation and second-generation estimation procedures, Ehigiamusoe and Lean (2019) examined the effect of financial development on CO2 emissions for 122 countries. They divided the data into groups of high-income countries, upper-middle-income countries, lower-middle-income countries, and low-income countries, and their results showed that financial development as measured by domestic credit to the private sector as a ratio of GDP reduces CO2 emissions in high-income and upper-middle-income countries. A study by Ehigiamusoe et al. (2019) concluded that the structure of the financial system matters in safeguarding environmental quality by analyzing 58 countries. For G20 countries, Yao and Tang (2021) examined the connection between financial structure and CO2 emissions by employing two-way fixed effects for the period 1971 to 2014. They measured financial structure (FS) by stock market value to domestic credit and their findings demonstrated that FS has a negative correlation with per capita CO2 emissions in developed countries of the G20. However, some studies employ the same measure and reveal an insignificant relationship between CO2 emissions and financial development (see, Dogan & Turkekul, 2016; Omri et al., 2015; Ozturk & Acaravci, 2013; Seetanah et al., 2019).
A couple of empirical studies employ different simple proxies of financial development to investigate its impact on environmental quality. Tamazian et al. (2009) examined the connection between environmental degradation and financial development using a random effect model in BRICS countries. They used financial liberalization, financial openness, FDI, deposit money bank assets as percent of GDP and stock market value as proxies for measuring financial development. They reported that the development of the financial sector helps to mitigate environmental degradation. Using ARDL and VECM approaches, Abbasi and Riaz (2016) studied the effect of financial and economic development on environmental quality in a small emerging economy (Pakistan) over the period 1971 to 2011. Their study results showed that financial development (ratio of private sector credit to GDP, stock market capitalization, and stock market turnover) improves the quality of environment during the period of financial liberalization. In case of Turkey, Katircioğlu and Taşpinar (2017) used different measures of financial development (liquid liabilities to GDP, broad money supply to GDP, domestic credit provided to the private sector, and domestic credit by the financial sector) and found that financial development is negatively correlated with CO2 emissions. Recently, Shoaib et al. (2020) studied the financial development effect on the level of emissions across developed and developing countries by using the panel-ARDL technique. They employed different measures of financial development (bank Z-score, stock market capitalization, ratio of stock market turnover, and domestic credit to private sector as percent of GDP) and show a positive connection between development of the financial sector and CO2 emissions.
Renewable Energy Consumption and Environment Degradation
A number of studies have explored the dynamics of the relationship between disaggregated energy consumption (renewable and non-renewable) and emissions of CO2 across countries and regions around the globe. For example, Apergis et al. (2010) reported nuclear energy consumption reduces CO2 emissions, while utilization of renewable energy increases CO2 emissions across developed and developing economies during the 1984 to 2007 period. They argue that electricity generators have to rely on fossil fuel energy sources to meet high demand for energy due to lack of appropriate storage technology. By using the Augmented Mean Group (AMG) approach, Shafiei and Salim (2014) explored the correlation between CO2 emissions and disaggregated energy consumption for OECD countries and data 1980 to 2011. Their empirical results revealed that renewable energy consumption improves the environment quality whereas non-renewable energy consumption deteriorates the environment quality. Conversely, Farhani and Shahbaz (2014) suggested that the utilization of renewable energy consumption has a positive relationship with environmental degradation in MENA countries by using panel cointegration techniques. In the case of USA, Bilgili et al. (2016) confirmed that the usage of fossil fuel energy greatly contributes to the emissions of CO2 whereas environmental quality increases with renewable energy consumption over the period 1981 to 2015. A recent study by Belaïd and Zrelli (2019) explored the effects of renewable and non-renewable electricity consumption on degradation of the environment in a panel of nine Mediterranean countries using panel econometric methods for the period 1980 to 2014. Their results reported the consumption of non-renewable energy stimulates the level of emissions while renewable energy consumption has a negative impact on the environment.
With the growing importance of renewable energy consumption to reduce emissions of CO2 and to meet the energy demand, some empirical studies have examined the role of renewable energy consumption in affecting the quality of the environment. Salim and Rafiq (2012) employed FMOLS and DOLS approaches to analyze the determinants of renewable energy consumption for six major emerging countries (Brazil, China, India, Indonesia, Philippines, and Turkey). They reported that consumption of renewable energy has a positive relationship with pollutant emissions and income. Later for the US, Jaforullah and King (2015) found that the usage of renewable energy is effective at mitigating environmental pollutants. Similarly, Rafiq et al. (2016) investigated the impact of renewable energy on energy intensity and emissions with other controlling variables for 22 urbanized emerging economies. Their study findings showed that renewable energy consumption has a negative impact on energy intensity and emissions. Further, Paramati et al. (2017) also concluded that the consumption of renewable energy significantly improves the quality of the environment in a panel of G20 economies. The findings of another study by Bhattacharya et al. (2017) also revealed that the significant growth of renewable energy consumption reduced environmental degradation in developed and developing countries across the world during 1991 to 2012. More recently, Khan et al. (2020) investigated the association between renewable energy uses and carbon dioxide emissions in a global panel of 192 nations and found a negative impact of renewable energy on emissions of CO2. For 25 African countries, Ehigiamusoe (2020a) used estimation techniques such as AMG, FMOLS, and DOLS to explore the effects of electricity consumption and generation on CO2 emissions. The results showed that electricity generated from oil, coal, and natural gas has detrimental effects on CO2 emissions, but electricity generated from hydro has the opposite effect.
Methodology and Data
Empirical Models and Research Method
The main objective of this article is to explore the role of financial markets and financial institutions development and their sub-indices on emissions of CO2 in SSA countries. In order to accomplish this objective, this study uses the extended stochastic influences by regression on the population, affluence and technology (STIRPAT) model. The IPAT model was proposed by Ehrlich and Holden in the early 1970s (Ehrlich & Holdren, 1971), has been regarded as an easily understandable, widely utilized theoretical framework for inspecting human drivers of environmental change. The IPAT model considers environmental impacts as resulted from three drivers: population, affluence, and technology. The IPAT model could be expressed as:

Where, I refers to the environmental impact, which is caused by the population size (P), per capita affluence (A), and technology involved in supporting each unit of consumption (T). Later, Dietz and Rosa (1994, 1997) extended IPAT as STIRPAT, acronym of Stochastic Impact on Population, Affluence and Technology, which is as follows:

Where i and t refer to the countries and time periods, respectively. Parameter α is the constant term. Parameters b, c and d are underestimated coefficients, and the random error term is denoted by ε. By transforming equation (2) into logarithmic form, equation (3) can be expressed as follows:

STIRPAT model allows not only estimating coefficients but also decomposing each factor, so the model framework can be amended to incorporate new factors based on individual study characteristics. Now-a-days, IPAT and STIRPAT are the most widely used and classic models for studying the effects of CO2 emissions. Our study extends the STIRPAT theoretical model to provide theoretical support for our design requirements based on the literature available. We modified and extended the STIRPAT model as follows in equation (3):

Where i and t refer to countries and period, respectively; α denotes coefficient slope; vi is the individual effect; ε represents the stochastic error term; CO2, PI, TO, URB, FDI, REC, FMD, and FID indicate carbon emissions per capital, per capita income, trade openness, urbanization, foreign direct investment, renewable energy consumption, financial market development and financial institution development, respectively. Further, we extend the equations (4) and (5) to investigate the interaction effect between disaggregate indicators of financial development and renewable energy consumption on CO2 emissions, which are given as:


Using Ordinary Least Squares (OLS) to estimate the above equations could result in inaccurate estimates. A simulation study by Judson and Owen (1999) shows that OLS can produce significant bias in estimation models with fixed effects even when T is large. In this case, standard estimation methods would not be reliable because the lag of the independent variable correlated with the unobserved fixed effect (Arellano & Bond, 1991). Considering such constraints, Arellano and Bond (1991) proposed a method known as the generalized method of moments (GMM) that eliminates the sample country-specific unobserved heterogeneities using the first differencing transformation. However, in the case of small time series observations and large autoregression parameters (Blundell & Bond, 1998), a first difference GMM is inaccurate in simulation studies and exhibits a large finite sample bias. In order to overcome the limitations of the first-difference GMM, Blundell and Bond (1998) developed a System-GMM) which uses lagged differences of the dependent variable as instruments when solving equations in levels, and it also uses lagged levels of the dependent variable when solving equations in first differences. To determine whether instruments are valid, the Sargan test is used. This study also tests autocorrelation at both the first and second orders. On the regression residual term, the study also conducts cross-sectional dependency tests and stationarity tests. If the residual term of the regression is stationary, the model can be fitted (Sadorsky, 2013). Therefore, in order to obtain reliable results, the above equations are estimated using the robust two-step system-GMM.
Data and Variables Description
In order to conduct our research, we use the annual data for 46 SSA countries as a sample, ranging from 1991 to 2016 (See Appendix Table A for a list of countries). Two databases are used to collect the data. We begin with the World Development Indicators (WDI), which provides data on a range of macroeconomic variables, including the dependent and control variables. For the main interest variable, we use the Financial Development Index Database by the IMF to calculate the financial development indices developed by Svirydzenka (2016) for financial institution development and financial market development. Unlike conventional research, which measures financial development by assessing either the ratio of private credit to GDP or stock market capitalization to GDP, these indices measure financial development by evaluating separately the development of financial institutions and financial markets. In both segments, the development is based on the access to that segment (the ability of individuals and companies to access the services of the segment), the depth of the segment (size and liquidity), and the efficiency (the ability of the institutions to provide financial services at low cost and with sustainable revenues or the level of activity in the capital markets). Table 1 below identifies the variables adopted in this paper, the complete name of the variable, unit of measurement, and source as well as the variable reference. The existing variable references justify a variable’s inclusion in the study.
Detailed Description of Variables.

Table 2 provides descriptive statistics for the variables selected. CO2 emissions are on average 8.342 tons; per capita income is on average 0.778; the total urban population is on average 5.744; FDI net inflows are on average 0.613; renewable energy consumption is on average 4.235; and overall financial market index, access, depth, and efficiency are on average 0.304, 0.252, 0.281, 0.385, 0.377, 0.315, 0.207, and 0.584, respectively. Additionally, descriptive statistics show that the average values for financial institution development and its sub-measures are greater than those for financial market development and its sub-measures except for financial institution depth in SSA countries. Standard deviations of variables indicate that renewable energy consumption is more volatile than other control variables. Measures of financial institution development and their sub-measures are less volatile than those of financial market development during the study period.
Variables Descriptive Statistics.

The correlation matrix is shown in Table 3. It is noteworthy that the estimated coefficient of renewable energy consumption, FDI, and urbanization are negatively correlated with CO2 emissions per capita, which indicates that these indicators have a significant influence on improving environmental quality. Among the indicators of financial development, it is found that financial markets development, the depth of financial markets, the efficiency of financial markets, and the efficiency of financial institutions, are negatively correlated with CO2 emissions. Further, the correlation matrix indicates that the explanatory variables are not strongly related to the indicators of financial development. However, we find that a strong correlation exists between some indicators of financial development. Therefore, we estimate separate models of each indicator of financial development, as using all the indicators in the same equation for estimation would produce inconsistent results due to multicollinearity.
Correlation Matrix.

Note. *, **, *** signify significance at 10%, 5%, and 1% levels, respectively.
Hypothesis Testing
Our investigation is framed by the following multiple hypotheses;
Null hypothesis 1: Overall financial market development reduces CO2 emissions.
Null hypothesis 2: Financial market access reduces CO2 emissions.
Null hypothesis 3: Financial market depth reduces CO2 emissions.
Null hypothesis 4: Financial market efficiency reduces CO2 emissions.
Null hypothesis 5: Overall financial institution development reduces CO2 emissions.
Null hypothesis 6: Financial institution access reduces CO2 emissions.
Null hypothesis 7: Financial institution depth reduces CO2 emissions.
Null hypothesis 8: Financial institution efficiency reduces CO2 emissions.
All empirical models reject the null hypothesis based on the coefficient of the primary interest variable. If the coefficient is significant, alternative hypotheses can be considered if the estimated coefficient is positive.
Empirical Findings and Discussions
Our study examines how disaggregated components of financial development and their sub-measures along with renewable energy consumption, per capita income, FDI, urbanization, and trade openness affect CO2 emissions using the SYS-GMM estimator. Table 4 presents the estimated results for a panel of the full sample. In Table 4, models 1 to 4 present the results of equation (1), whereas models 5 to 8 present the results based on equation (2). Both the Sargan test of valid instruments and the serial correlation test are passed by the models. Using Pesaran (2015) cross-sectional dependence test, we find that residuals are cross-sectionally independent. For all models, the p-values in the bottom of the table show that the unit root tests of the SYS-GMM residuals are also stationary in levels, indicating good model fitness. As can be seen from the results, the main interest variables of all disaggregated components of financial development are all significant and positive at the level of 1%, with the exception of the financial market access sub-index. These results suggest that the increasing role of financial markets, institutions, and their sub-indicators has a considerable positive impact on CO2 emissions in these countries. Further, the results indicate that financial institution development, access, depth, and efficiency are higher than financial market development and its sub-measures indicating that financial institution development has a greater influence on environmental degradation than their counterparts. This implies that these countries’ financial markets promoted environmental policies by ensuring all listed companies conformed to them. Thus, they may have implemented eco-friendly production and consumption methods in order to conserve energy and reduce CO2 emissions. This result is similar to that of Paramati et al. (2018), who found that financial market development results in a reduction in environmental degradation. The positive impact of financial institution development and its sub-indices on CO2 emissions implies that financial development through the banking sector causes environmental damage. For instance, the banking sector provides and allocates financial resources at low costs to their customers, firms, and also to households for large ticket items that consume a lot of energy. Furthermore, auto financing is a profitable production of consumer finance, and because there are no environmental regulations, outdated technology increases pollution and energy consumption. The results support the finding of Zafar et al. (2019) that increased banking sector development leads to increased energy consumption and, ultimately, CO2 emissions. It is imperative that policymakers and other relevant authorities establish environmentally friendly policies related to the financial sector utilizing energy-efficient greener technologies.
SYS-GMM Estimates for the Full Sample.

Note. Standard errors that are robust to heteroscedasticity are shown in brackets. *, **, *** signify significance at 10%, 5%, and 1% levels, respectively.
The results further reveal that renewable energy consumption is significantly and negatively correlated with CO2 emissions at the 1% level in all the models. The estimated coefficient ranges from −0.541 to −0.557. This evidence shows that the quality of the environment can improve with the increased investment in renewable energy. This finding is consistent with the findings of Khan et al. (2020), Khoshnevis Yazdi and Ghorchi Beygi (2018), and Paramati et al. (2017), who reported that the renewable energy consumption contributes to the reduction in CO2 emissions. In order to encourage the investment in renewable energy, policymakers should formulate policies that offer tax relief and financial incentives to investors. Additionally, the use of renewable energy reduces the dependency on conventional fossil fuels, which can contribute to sustainable development.
For other control variables, the growth of per capita income has a positive and significant relationship with CO2 emissions at the 1% level, which suggests that economic growth contributes to environmental degradation. To be more specific, a 1% increase in per capita income would reduce environmental quality between the ranges of 0.073 and 0.069. This evidence supports the argument that when income grows, consumers tend to purchase heavy vehicles which demand more energy and thus contribute to increasing the level of emissions. This is similar to the findings of Wang et al. (2011).
The results further show that trade openness has a significant and positive impact on CO2 emissions at the 5% and 10% levels in seven specifications. The estimated coefficients of trade openness range between 0.028 and 0.029. This evidence implies that as trade openness boosts, economic growth raises in these economies and therefore degrading the environment. This empirical finding is inconsistent with the findings of Abid (2017) who indicated that trade openness decreases CO2 emissions but consistent with the findings of Tamazian and Rao (2010) and Acheampong et al. (2020). It is found that urbanization exerts an insignificant effect on CO2 emissions in SSA countries. In addition, the results of this study demonstrate that FDI has a significant impact on reducing CO2 emissions at the 1% and 5% levels in all the specifications. The estimated coefficient of FDI ranges between −0.032 and −0.055. This suggests that the quality of the environment improves with the increase in FDI inflows. This evidence is aligned with the argument that FDI inflows bring advanced technology and innovative methods for production activities in the host country which help to reduce the level of CO2 emissions. This finding is consistent with the empirical findings of existing studies, which confirm that the impact of FDI inflows on CO2 emissions is negative (Jiang et al., 2019; Solarin & Al-Mulali, 2018; Zhang & Zhou, 2016).
Additional Analysis
This section conducts additional analysis to avoid the homogeneity assumption among the full sample as the dynamic relationships among disaggregated financial deepening, renewable energy, other variables and CO2 emissions could vary across countries due to different levels of economic development. According to the classification of the World Bank (2015), this study splits a panel of SSA countries into high-income and low-income countries to investigate whether the results differ across these groups.
With respect to high-income countries, the results reported in Table 5 demonstrate that the development of financial markets and sub-measures such as their depth, access, and efficiency negatively impact CO2 emissions. Thus, a 1% increase in overall, access, depth and efficiency of financial market development reduces CO2 emissions by −0.536%, −0.436%, −0.424%, and −0.391% respectively. This evidence implies that the development of financial markets improves the quality of the environment in high-income countries of Sub-Saharan. These results indicate that financial markets in high-income economies offer incentives for firms to develop technological innovations that reduce CO2 emissions (Zagorchev et al., 2011). Alternatively, the development of financial institutions, depth and efficiency have a positive impact on the level of CO2 emissions, while financial institution access has no significant link with the level of emissions. The results suggest that the expansion of the financial sector and its sub-measures degrade the environment. This result align with Sehrawat et al. (2015), Shahbaz et al. (2016), and Maji et al. (2017), which show that bank-based financial development reduces the environment quality by increasing CO2 emissions. Conversely, this finding contradicts the findings of Shahbaz et al. (2013), Abbasi and Riaz (2016), and Shahbaz et al. (2018), which noted that financial institution-based development reduces CO2 emissions. The plausible explanation is that the financial system of Sub-Saharan Africa has poor liberalization which is one of the critical factors to impede financial institutions’ ability to facilitate environmentally friendly projects. The results further indicate that renewable energy consumption decreases CO2 emissions in high-income countries, and this is consistent with the findings of full sample analysis. This evidence suggests that renewable energy can help in order to address environmental degradation and energy security related issues. For FDI inflow, the results show that it reduces environmental degradation in high-income countries of SSA, as all models estimated coefficients are negative and significant at 1%. The results further reveal that urbanization contributes to CO2 emissions in high-income countries, this implying that urbanization in these economies helps to facilitate economies of scale for urban infrastructure that could degrade the environment quality by increasing prosperity. Additionally, per capita income and trade openness have no effect on CO2 emissions in case of high-income countries.
Interaction Effect Between Renewable Energy Consumption and Different Financial Development Indicators on CO2 Emissions.

Note. Standard errors that are robust to heteroscedasticity are shown in brackets. *, **, *** signify significance at 10%, 5%, and 1% levels, respectively.
Now, let us move toward low-income countries. The results reported in Table 6 reveal that financial market development, access and depth have positive and significant effects on CO2 emissions at 1% level, while financial market efficiency has the same effect at 5% level. Thus, a 1% increase in financial market development, access, depth and efficiency increases the level of emissions by 1.835%, 2.468%, 1.574%, and 1.026% respectively. These findings suggest that the financial markets inlow-income countries are underdeveloped and inefficient, which makes it difficult for industries to adopt green technologies without adequate regulation, and prevents them from investing in environmentally friendly initiatives. On the other hand, the estimated coefficient on financial institution development and its sub-measures have an insignificant relationship with CO2 emissions. The similar finding is reported by Abbasi and Riaz (2016), who indicated that financial institution-based development exerts an insignificant impact on CO2 emissions. Furthermore, the findings show that the effect of renewable energy usage on CO2 emissions is negative and statistically significant; this is in line with the findings of the full sample and the high-income group. The implication is that renewable energy consumption mitigates environmental degradation in low-income countries of SSA. The current study also finds that FDI inflows exert a negative and significant impact on CO2 emissions, which imply that FDI brings innovation and advanced technologies from developed countries to developing countries and further reduces environmental pollution. Further, it is found that urbanization exerts an insignificant effect on CO2 emissions. For trade openness, the estimated coefficient is positive and significant in all the models at 1%. The finding indicates that trade openness contributes to CO2 emissions and will worsen the environment quality in low-income countries. The results further reveal that per capita income growth has a positive and statistically significant influence on CO2 emissions. Thus, the increase in economic growth reduces the quality of the environment in these economies.
SYS-GMM Estimates for High-Income Countries.
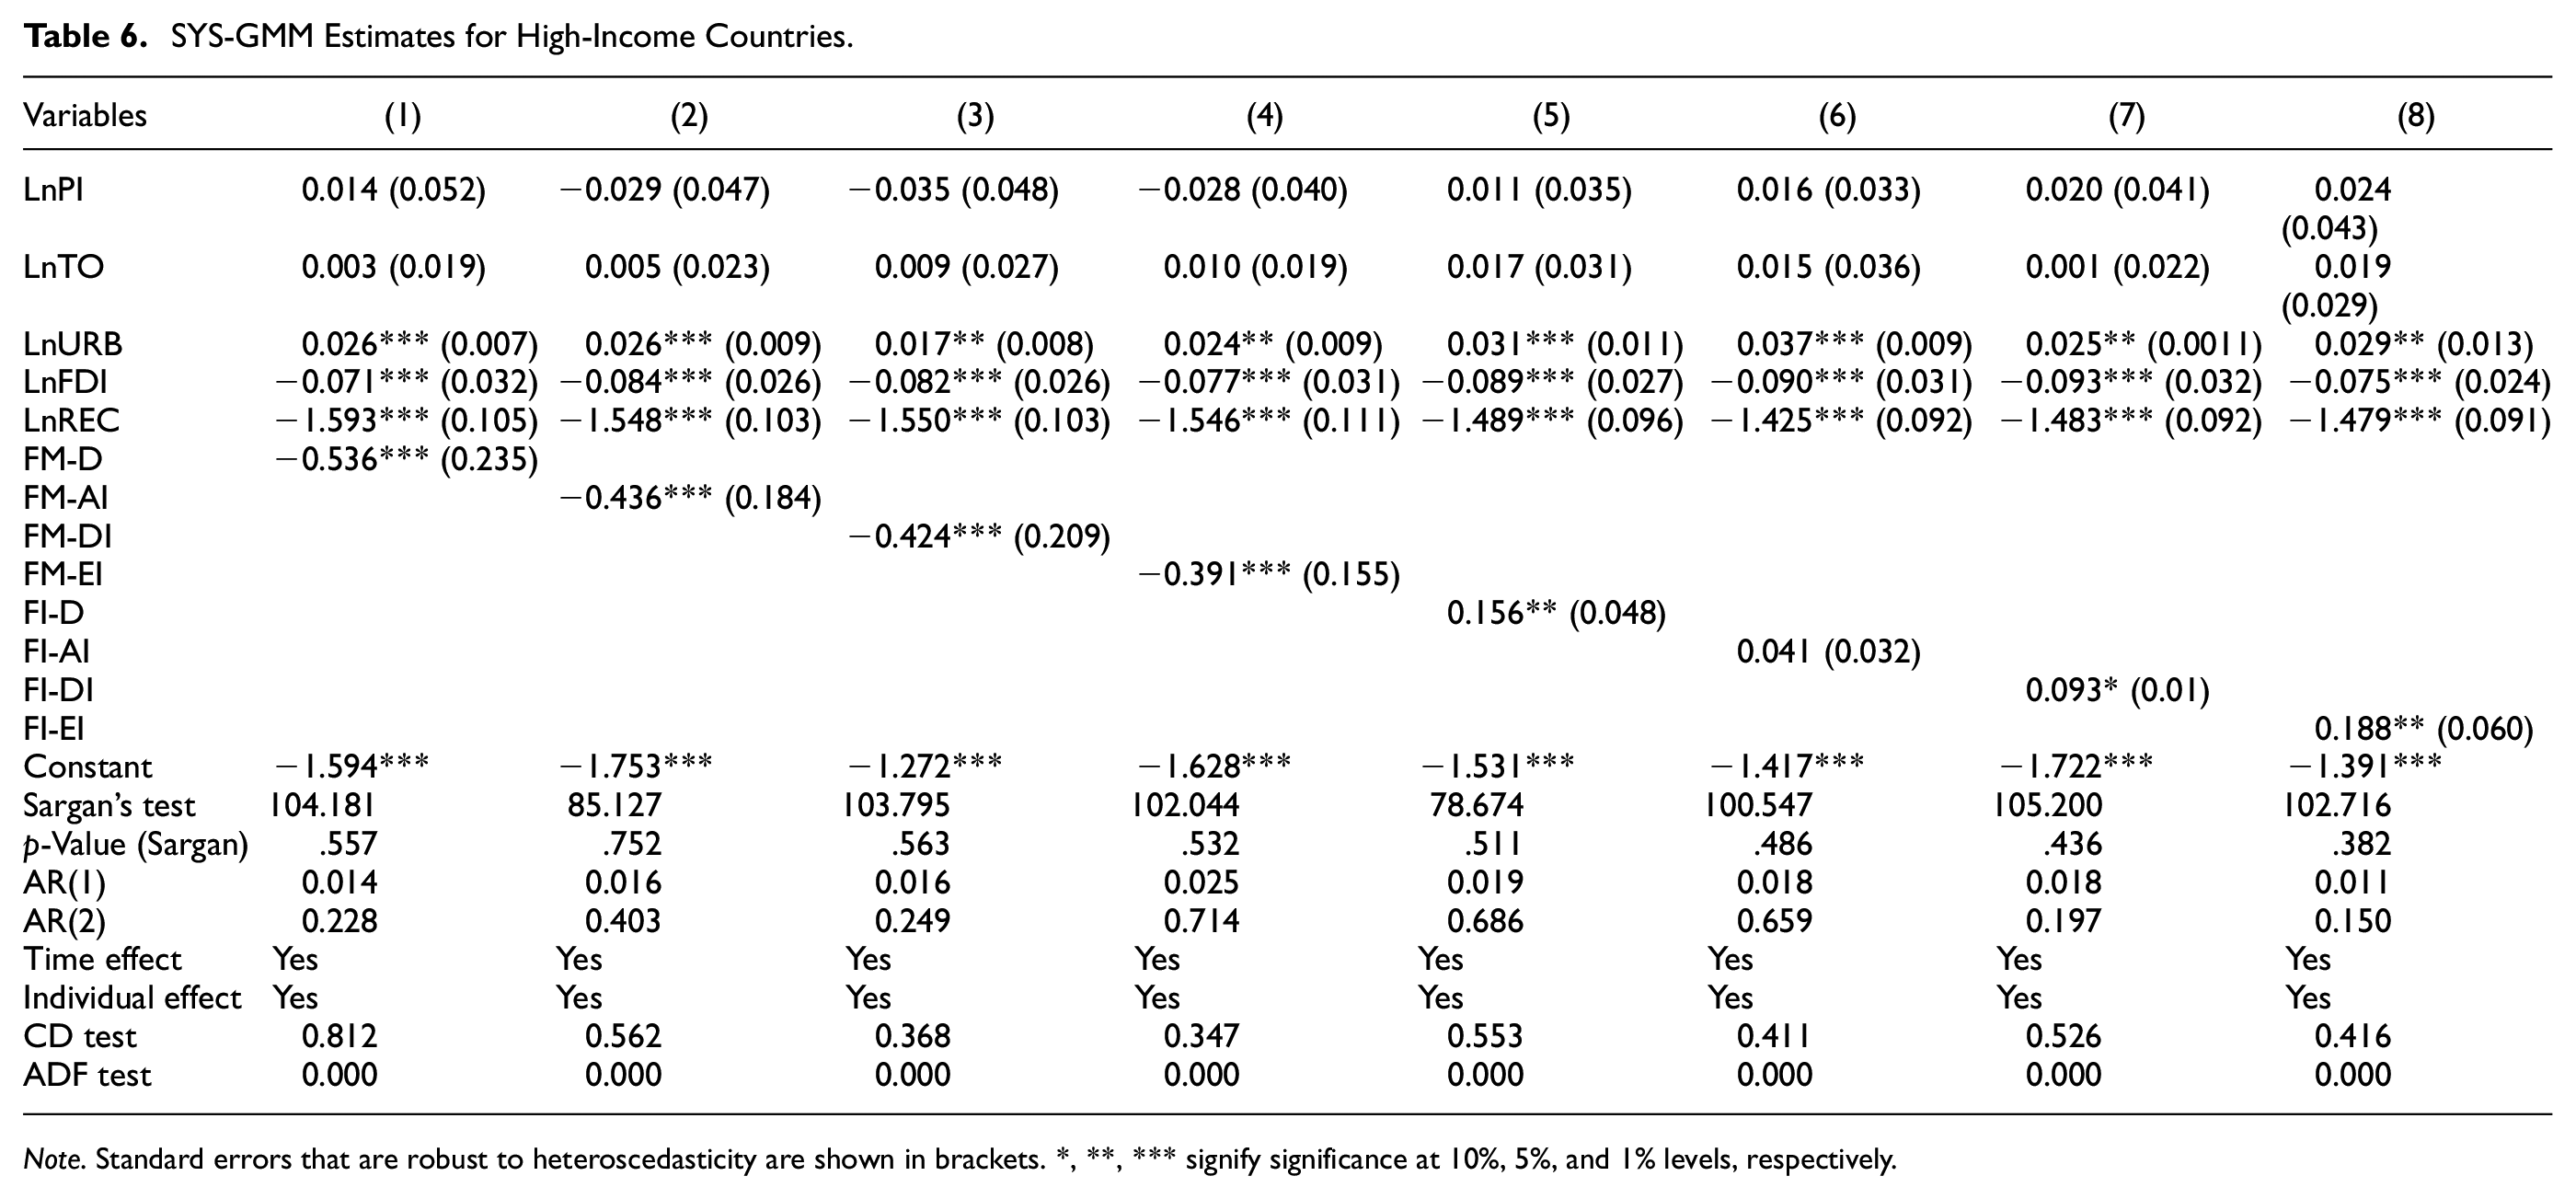
Note. Standard errors that are robust to heteroscedasticity are shown in brackets. *, **, *** signify significance at 10%, 5%, and 1% levels, respectively.
Interactive Effects
Recent empirical studies have demonstrated that renewable energy can provide a number of environmental and economic benefits. These benefits include reducing greenhouse gas emissions from fossil fuel combustion, reducing air pollution, diversifying energy supply, and stimulating economic growth (Habiba & Xinbang, 2022; Zeqiraj et al., 2020). However, one of the biggest obstacles to the deployment of renewable energy is capital costs. A sound and well-developed financial system is needed in order to finance the sector of renewable energy at lower rates. In the long-run, capital markets offer firms an effective way to minimize liquidity risks and obtain the funds they need to develop green technology (Anton & Afloarei Nucu, 2020). Thus, an efficient financial system can facilitate more investment in renewable energy technology at low costs, resulting in increased investment in energy-efficient technologies, which reduces the amount of CO2 emissions.
Using the interaction terms between disaggregate components of financial development and renewable energy consumption, it is analyzed whether financial market and financial institution developments and their sub-measures influence CO2 emissions in SSA countries. Table 7 presents the results on the basis of equations (3) and (4). The results reveal that the interaction terms of financial market development, access, depth, efficiency and renewable energy consumption have a significant negative impact on CO2 emissions (see models 1–4). It is consistent with the findings of Habiba et al. (2021), who found that a highly developed and efficient stock market influences CO2 emissions through renewable energy. These findings indicate that financial market development could indirectly contribute to improved environmental quality by increasing renewable energy in these economies. However, the interaction terms of financial institution development, access, depth, efficiency and renewable energy consumption have insignificant effect on CO2 emissions (see models 5–8). This evidence suggests that improvement in financial institutions do not complement renewable energy consumption to influence the environmental quality in these countries. This could be explained by the fact that although the financial sector in most SSA countries has undergone extensive reforms over the past two decades to the same extent as the financial sectors in other developing countries, the SSA countries still have the least developed financial systems compared to other developing and emerging countries (Allen et al., 2013).
SYS-GMM Estimates for Low-Income Countries.

Note. Standard errors that are robust to heteroscedasticity are shown in brackets. *, **, *** signify significance at 10%, 5%, and 1% levels, respectively.
Robustness Check
We use fixed-effect estimator to test the robustness of our estimated results by examining the impact of disaggregated financial development components on CO2 emissions for the entire sample. Table 8 reports the estimated results of the static panel model. The results confirm the validity of our findings from the SYS-GMM estimator as our main interest factors, the development of financial markets and its sub-measures, such as financial market depth and efficiency, have a positive impact on CO2 emissions at the 1% significance level. However, the impact of financial market access is negligible in model (2). In terms of financial institution development, the results show that financial institution development, access, depth, and efficiency have a statistically significant positive impact on the CO2 emissions. The results further reveal that the coefficients of renewable energy consumption across all models are negative and statistically significant.
Fixed-effect Estimates for the Full Sample.

Note. Standard errors that are robust to heteroscedasticity are shown in brackets. *, **, *** signify significance at 10%, 5%, and 1% levels, respectively.
Conclusions and Policy Implications
A large body of literature has investigated the impact of financial development on CO2 emissions by using two measures of financial development- the ratio of stock market capitalization to GDP or private credit to GDP. However, these measures are simple in nature and do not take into consideration the complex stages of financial development. Furthermore, the modern financial systems across nations have become multilayered, making it necessary to examine the effect of disaggregating components of financial development using multiple indicators of environmental quality. This study employs dynamic generalized-method-of-moment (SYS-GMM) to explore the impact of financial markets and financial institutions development on CO2 emissions for 46 countries in Sub-Saharan Africa during the period 1991 to 2016. In this paper, we also investigate the impact of renewable energy consumption along with other factors such as per capita income, trade openness, urbanization and FDI on CO2 emissions.
The findings of the study show that an increasing role of financial market development and its sub-measures further raise CO2 emissions in SSA countries. Likewise, we find out that improvement in financial institutions and its sub-measures increase CO2 emissions. However, we observe that the impact of financial institution development is greater to deteriorate the quality of the environment than the development of financial markets in SSA countries. The impact of disaggregate components of financial development on CO2 emissions is different across income groups in Sub-Saharan. For instance, we identify that financial market development and its sub-measures reduce CO2 emissions in high-income countries while increasing in low-income countries. On the other hand, financial institution development, depth and efficiency have a significant and positive relationship with CO2 emissions in high-income countries while these indicators including financial institution access have an insignificant impact on CO2 emissions in low-income countries. The findings further reveal that renewable energy consumption has a significant negative effect on CO2 emissions and are consistent with the findings of sub-panels for high-income and low-income countries. This result implies that an increased use of renewable energy contributes to improving the environmental quality in the region. In addition, the estimated interactive effects between financial market development, access, depth, efficiency and renewable energy consumption reveal that improvement in financial market complements renewable energy to mitigate the level of emissions. We also find out that FDI inflows contribute to CO2 emissions reduction in the region. As a result of these findings, policymakers should eliminate barriers that impede FDI inflows. Through FDI, the domestic country will receive energy-efficient technologies, innovative production techniques, and advanced skills that will improve the efficiency of energy use, a primary cause of environmental pollution (Nguyen et al., 2018, 2020). However, trade openness and economic growth may boost environmental degradation.
In light of the above findings, this study has important policy implications for Sub-Saharan Africa. In the current paper, it is found that financial markets and institutions have a detrimental effect on the environment. Our recommendation is that policy authorities should encourage listed firms and industries to invest in greener technologies and increase shares in projects that reduce CO2 emissions in Sub-Saharan Africa. Future environmental policies should mandate that industries disclose their environmental performance. To reduce CO2 emissions, policymakers may also utilize other instruments such as emissions trading or caps and carbon emissions taxes. There are no environmental policies in financial institutions, which result in high carbon emissions. Thus, it is recommended to strengthen institutions and implement eco-friendly policies in order to ensure low CO2 emissions. Financial institutions should offer cheap loans to companies or industries that invest in eco-friendly projects and push them to adopt eco-friendly policies to reduce CO2 emissions. As a way of reducing CO2 emissions and ensuring sustainable development, countries need financial institutions that adopt green growth strategies through promotion of cleaner production processes. Also, the positive impacts of renewable energy consumption on CO2 emissions suggest that Sub-Saharan Africa should invest substantially in renewable energy in order to strengthen their low carbon economies. A sustainable environment can be achieved by introducing renewable energy into their production methods, investing in research and development, upgrading outdated technologies with FDI, and implementing carbon pricing for polluting listed companies. Other developing regions can also benefit from these policies, as the implications apply not only to SSA countries. This study may be extended by incorporating panel data from other developing nations. Further research could be conducted to determine the effect of financial deepening on CO2 emissions with the role of technology innovation and institutional development for the same region or for different regions.
Footnotes
Appendix
List of Countries Covered in the Study.

| Countries | |
|---|---|
| 1 | Angola |
| 2 | Benin |
| 3 | Botswana |
| 4 | Burkina Faso |
| 5 | Burundi |
| 6 | Cabo Verde |
| 7 | Cameroon |
| 8 | Central African Republic |
| 9 | Chad |
| 10 | Comoros |
| 11 | Congo (Brazzaville) |
| 12 | Congo (Democratic Republic) |
| 13 | Cote d’Ivoire |
| 14 | Equatorial Guinea |
| 15 | Eritrea |
| 16 | Ethiopia |
| 17 | Gabon |
| 18 | The Gambia |
| 19 | Ghana |
| 20 | Guinea |
| 21 | Guinea-Bissau |
| 22 | Kenya |
| 23 | Lesotho |
| 24 | Liberia |
| 25 | Madagascar |
| 26 | Malawi |
| 27 | Mali |
| 28 | Mauritania |
| 29 | Mauritius |
| 30 | Mozambique |
| 31 | Namibia |
| 32 | Niger |
| 33 | Nigeria |
| 34 | Rwanda |
| 35 | Sao Tome and Principe |
| 36 | Senegal |
| 37 | Seychelles |
| 38 | Sierra Leone |
| 39 | South Africa |
| 40 | Sudan |
| 41 | Swaziland |
| 42 | Tanzania |
| 43 | Togo |
| 44 | Uganda |
| 45 | Zambia |
| 46 | Zimbabwe |
Declaration of Conflicting Interests
The author(s) declared no potential conflicts of interest with respect to the research, authorship, and/or publication of this article.
Funding
The author(s) received no financial support for the research, authorship, and/or publication of this article.
Availability of Data and Materials
Data used in this study can be found in IMF and World Development Indicators (WDI) databases.