
Abstract
This study analyzed whether students’ learning behaviors in mathematics classrooms could be classified into distinct patterns, defined by their expectancy for success in mathematics, perception of the value of mathematics, and a supportive or unsupportive environment, using data from the United States and Finland in the PISA 2022 survey. The findings revealed that the six distinct patterns of learning behaviors (motivated, defiant, hopeless, fragile, evading, rejecting) were evident in Finland, while in the United States, some but not all of these patterns were present. These results have significant implications for lesson planning and instructional design. Teachers should select learning content that is meaningful and valuable, design lessons with appropriate levels of difficulty and suitable instructional methods to foster students’ expectancy for success, and cultivate a supportive classroom environment to enhance their engagement and motivation.
Keywords
Introduction
Motivation is key to enhancing students’ self-efficacy and behavioral engagement during mathematics learning. Motivation in mathematics learning positively predict students’ behavioral engagement (Hidayatullah et al., 2024). The importance of motivation on student behaviors in class cannot be overstated (Ames, 1990). More than 32 theories or models have been proposed to explain human behavior in various disciplines (M. E. Ford, 1992), and many of these suggest motivation as a major factor. Motivation is the driving force behind an individual’s actions in order to reach an expected or desirable state or outcome (Maehr & Meyer, 1997). Student motivation generates, directs, and sustains what he or she does to learn (Ambrose et al., 2010). In the context of learning, motivation influences student engagement. Specifically, it impacts the direction, intensity, persistence, and quality of learning behaviors (Ambrose et al., 2010). Motivation drives student behavior. It is important to understand what motivates a student to take certain actions, especially when there are multiple competing goals and circumstances. Many theories point to the subjective value of goals and the expectation of achieving them as key factors in explaining student motivation to learn (Atkinson, 1957, 1964; Cook & Artino, 2016; Wigfield & Eccles, 1992, 2000). The subjective value that students place on goals plays a crucial role in explaining their motivation for learning behavior. If students do not perceive the value of learning content, they will not be interested in a lesson and this will lead to non-participative or even disruptive behavior. On the other hand, if students perceive the importance of the content, they will be interested in a lesson or class activity, resulting in engaged learning behavior.
However, the expectancy–valence model has a limitation in that it overlooks the influence of the learning environment on individual motivation when explaining student learning behavior. Therefore, to explain learning behaviors in the classroom, it is necessary to consider together the effects of value perception, expectancy for success, and the learning environment on individual motivation. Ambrose et al. (2010) proposed various patterns of students’ learning behavior that resulted from the interaction of three variables: expectancy for success, value perception, and a supportive or unsupportive environment (see Table 1).
Six Patterns of Learning Behavior.

Ambrose et al. presented this framework for understanding students’ learning behavior patterns, but did not present experimental data. They asserted that the aforementioned framework (Table 1) for students’ learning behavior patterns was based on the theories of Hansen (1989) and M. E. Ford (1992), but this is not an accurate representation. In fact, Hansen (1989) only proposed four types of lesson tact: lesson evading, lesson dissembling, lesson engaging, and lesson rejecting, using only expectancy for success and perception of value, while excluding environmental influences. Hansen (1989) specifically proposed “dissembling” as an alternative to “fragile.” Furthermore, his work was based on a small study (8 classes, 193 elementary school students) in the United States (Hansen, 1989). M. E. Ford (1992) also abstractly emphasized the importance of the environment in explaining the motivation of human behavior, but he did not propose learning behavior types with environmental influences, value perception, and expectancy for success as independent variables.
Research Purpose
The purpose of this study is to examine whether students’ learning behaviors in mathematics classrooms could be classified into distinct patterns, defined by their expectancy for success in mathematics, their perception of the value of mathematics, and a supportive or unsupportive environment. To achieve this research purpose, this study analyzed patterns of learning behaviors using data from the United States and Finland in the PISA 2022 dataset.
Expectancy–Valence Model of Motivation
Expectancy theory is a theory of motivation based on the belief that an individual’s effort to achieve depends on their expectation of rewards. Atkinson (1964) proposed a motivation theory as Motivation = Perceived Probability of Success × Incentive Value of Success. The formula is referred an expectancy model or expectancy–valence model because it depends largely on an individual’s expectation of rewards (Wigfield & Eccles, 2000). This theory implies that an individual's motivation is determined by the product of their perceived probability of success and the incentive value they place on success.
An individual’s subjective view of goal value comes from several sources. Wigfield and Eccles (1992, 2000) proposed three broad factors that determine an individual’s subjective value of achievement behaviors and goals. Firstly, attainment value refers to the satisfaction derived from achieving goals or mastering tasks. Students find satisfaction from solving complex mathematical problems, in which case they will invest a lot of time and effort into their behavior to demonstrate their ability to solve the problems. Attainment value concerns the satisfaction gained from the outcome. According to Putwain et al. (2019), “Higher attainment value protected performance from low expectancy of success by increasing behavioural engagement. The compensatory role of high attainment value diminished at higher levels of expectancy of success.” Another factor that determines an individual’s subjective perception of the value of achievement behaviors and goals is intrinsic value. This refers to the satisfaction derived from simply performing tasks or achieving goals, rather than the outcome. Students with intrinsic value are more likely to focus and work hard simply because they enjoy a task or learning activity itself. Intrinsic value is what is traditionally called intrinsic motivation (Ambrose et al., 2010). The final factor that determines an individual’s subjective perception of the value of achievement behaviors and goals is instrumental value. An example of instrumental value is when a student thinks, “If I work hard at maths now, I can get good grades in college later, or I can get the job I want later.” Instrumental value is related to extrinsic rewards (Ambrose et al., 2010).
Not all three values are required to foster student’s engagement. Intrinsic value is desirable, but recognizing instrumental value alone can enhance student’s engagement (Ambrose et al., 2010). Instrumental value plays an important role in motivation in educational contexts. The perception of task values is correlated with interest and performance (Hulleman et al., 2010). Students who perceived that the task or course material was relevant or useful to their lives showed increased task interest in mathematics, greater interest in reengaging in future tasks, and improved performance. These effects were especially pronounced among students with low performance expectations (Hulleman et al., 2010). A student may perceive multiple values when he or she participates in class. These values may compete with each other, unite with each other, or transform from one into another. A case in point is when the desire to participate in class, the desire to play with a friend, and the desire to work on another task at that time are in conflict. In this case, a student will pursue the behavior that has the most value to him or her (Ambrose et al., 2010). A confluence of values occurs when a student’s desire to show off in class by solving a problem that no one else can solve is mixed with a desire to participate because he or she simply enjoys solving problems, and a desire to get a good grade and be recognized by the teacher for solving the problem. In this case, the values are not in opposition to each other; rather, they reinforce each other. Indeed, intrinsic and instrumental values are often not so clearly dichotomous (Ambrose et al., 2010). An illustrative example is a student who is initially uninterested in a task but then becomes interested in it as a result of doing it to get a good grade (Hidi & Renninger, 2006).
Expectancy for Success in Classroom
Value perception alone is insufficient to induce student motivation for learning behavior. Even if a student recognizes the importance of learning objectives or content, if they have doubts, such as “Can I really be able to accomplish it?,” the student will be reluctant or hesitant to actively participate in class activities. Students are motivated to participate in class activities when they recognize the value of goals and at the same time have the expectation that if they work hard, they will be able to achieve the objectives. Students are motivated when they expect that they can successfully accomplish goals or tasks, and they are not motivated when they believe that they are not capable of accomplishing them. Expectancy of success is positively related to students’ subsequent achievement, mediated by their behavioral engagement (Putwain et al., 2019). So, what kind of expectations do students need to have in order to be motivated? The expectancies that influence student motivation are positive outcome expectancies and efficacy expectancies (Ambrose et al., 2010). Outcome expectancies are the belief that “if I perform tasks or make an effort, I will achieve the expected outcome” (Carver & Scheier, 1998). When a student with positive outcome expectancies engages in classroom activities or tasks and achieves the goal, it reinforces the student’s expectancy. Conversely, when a student with positive outcome expectancies engages in classroom activities but fails to achieve the goal, this actually lowers their outcome expectancies. In this case, they develop negative outcome expectancies. A student with negative outcome expectancies will then have a negative belief that they will not be able to achieve goals or tasks even if they works hard. In order to have positive expectations of achieving goals, it is not enough to have positive outcome expectancies; we also need to believe that we have the ability to achieve goals. These are efficacy expectancies. Efficacy expectancies or self-efficacy refer to beliefs in one’s capabilities to organize and execute the courses of action required to produce given attainments (Bandura, 1997). Self-efficacy in mathematics learning positively predicts students’ behavioral engagement and also mediates the relationship between motivation toward mathematics and behavioral engagement during mathematics learning (Hidayatullah et al., 2024).
So how can we help students develop expectancy for success? There are many factors that influence expectancy for success, but one of the most important is the prior experience of success in a similar vein. If a student has tried in the past with positive outcome expectancies and positive efficacy expectancies and has experienced success as a result, this reinforces the student’s expectancy for success, and the student will expect to succeed in similar contexts or activities in the future. Conversely, if a student tries with positive outcome expectancies and positive efficacy expectancies but experiences failure, this leads to negative outcome expectancies and negative efficacy expectancies, and the student then believes, “I can’t do it even if I try.” However, according to attribution theory, where a student attributes past successes or failures to has a greater impact on the student’s expectation of success or failure than simple experiences of success or failure in similar contexts or activities in the past (Weiner, 2000).
Environmental Influences on Student Learning Behavior
Perceiving the value of goals and expectancy for success alone are not enough to explain student learning behavior. Expectancy for success and value perception are personal variables of motivation, but they lack environmental variables. A supportive classroom environment significantly influences students’ behavioral and emotional engagement. Students who perceived that their teachers used effective feedback viewed the classroom environment as supportive, and in such cases, they demonstrated higher levels of engagement (Monteiro et al., 2021). According to Lee (2012), “supportive teacher–student relationships were significantly related to behavioral and emotional student engagement, and only the teacher–student relationship was a significant predictor of reading performance.” When students perceive the classroom environment as supportive, it strengthens their motivation to engage in classroom activities. Conversely, when they perceive the classroom environment as unsupportive, it weakens their motivation to engage in classroom activities.
D. H. Ford (1987) also argued that a person always functioned as a unit in coordination with the environments in which they functioned (the principle of unitary functioning). Effective functioning requires a motivated, capable person whose behavioral capabilities support relevant interactions with the environment to facilitate (or at least enable) goal attainment. If any of these components are absent or inadequate, achievements will be limited (M. E. Ford, 1992). Therefore, student learning behavior is a function of the interaction of expectancy for success, perception of the value of goals, and classroom environment.

(Note. B = human behavior, V = perception of the value of goals, Ey = expectancy for success, En = environmental influences.)
Methods
The study proceeded as follows:
(Dataset) The data used in this study were obtained from the PISA 2022 dataset. The original dataset is publicly accessible on the PISA 2022 website (OECD, n.d.). The PISA dataset was chosen because it is collected using identical items and sampling designs for 15-year-old students, thereby ensuring measurement equivalence of variables across countries (OECD, 2025). PISA 2022 data for Finland and the United States were employed in this study. Finland was selected because it has consistently demonstrated high performance in PISA and has been frequently examined in international comparative studies, whereas the United States was chosen because the theoretical framework of this study is grounded in prior studies (Ambrose et al., 2010; Hansen, 1989) conducted with U.S. elementary school students. Samples with missing responses on either independent or dependent variable items were removed, reducing the samples from 14,791 to 11,359. The ambiguous middle responses of “Disagree” or “Agree” to the item (ST268Q07JA; N = 6,346) were excluded for a clearer comparison between the two extreme groups (Buckley, 2009), and only participants who selected either “Strongly disagree” or “Strongly agree” (N = 5,013) were included in the final analysis (2,714 for Finland and 2,299 for the United States).
(Variables) To analyze the diverse patterns of learning behaviors in mathematics classrooms, three explanatory variables (perception of the environment [S], expectancy for success in mathematics [E], and perceived value of mathematics [ST268Q07JA]) and one outcome variable (motivation levels for learning behaviors in mathematics classrooms [ST293Q]) were employed. Detailed descriptions of the variable construction are provided in the Variables section.
(Analysis) The analysis was conducted in two stages: behavioral pattern classification and statistical comparison. For behavioral pattern classification, the distribution plots, frequencies, proportions, and frequency distributions of the outcome variable (ST293Q) were analyzed across eight quadrant groups derived from the combinations of the three explanatory variables. For statistical comparison, differences among the eight quadrant groups were tested using descriptive statistics, followed by multiple comparisons and post hoc comparison. All analyses were conducted in Python 3.8, with the corresponding code provided in Supplemental File S1.
Variables
The three explanatory variables and a outcome variable, which were analyzed in this study, are as follows.
Explanatory Variable 1: Perception of the Environment (Hereafter Referred to as S)
Perception of a supportive or unsupportive environment (S) is a composite variable that is the sum of five standardized variables. According to Ley (1972, as cited in Song et al., 2013), “a composite variable is a variable made up of two or more variables or measures that are highly related to one another conceptually or statistically.”Song et al. (2013) noted that “composite variables provide the greatest increases in power when the original variables have similar associations with the external outcome variable.” They also stated that “the use of composite variables is a common practice for controlling Type I error rate, addressing multicollinearity in regression analysis, or organizing multiple highly correlated variables into more interpretable or meaningful information.” In this study, the composite variable (C) is computed by summing the z-scores of the original variables:

Standardization is required when the original variables differ in variance, ensuring that the relationship between the composite variable and external variables is not unduly influenced by a single original variable with a large variance (Song, et al., 2013). The five variables that comprise S are as follows.
1-1) Teacher Interest, Helpfulness, Enthusiasm, Etc (ST270Q)
The classroom environment variable assessing teacher interest, helpfulness, and enthusiasm consists of four sub-items: “The teacher shows an interest in every student’s learning” (reverse-coded); “The teacher gives extra help when students need it” (reverse-coded); “The teacher helps students with their learning” (reverse-coded); and “The teacher continues teaching until the students understand” (reverse-coded; OECD, n.d.). Each sub-item is rated on a 4-point scale (1 = Every lesson, 2 = Most lessons, 3 = Some lessons, 4 = Never or almost never). Cronbach’s α: Finland = .90, United States = .91. These coefficients were calculated from the present study’s sample (the same applies hereafter).
1-2) Teacher Hospitality, Interest, Friendliness, Etc (ST267Q)
The classroom environment variable assessing teacher warmth, interest, friendliness, and other related qualities consists of eight sub-items: “The teachers at my school are respectful towards me”; “If I walked into my classes upset, my teachers would be concerned about me”; “If I came back to visit my school 3 years from now, my teachers would be excited to see me”; “I feel intimidated by the teachers at my school” (reverse-coded); “When my teachers ask how I am doing, they are really interested in my answer”; “The teachers at my school are friendly towards me”; “The teachers at my school are interested in students’ well-being”; and “The teachers at my school are mean towards me” (reverse-coded; OECD, n.d.). Each sub-item is rated on a 4-point Likert scale, from strongly disagree (1) to strongly agree (4). Cronbach’s α: Finland = .84, United States = .80.
1-3) Feeling Like an Outsider, Belonging, Awkwardness, Loneliness, and Making Friends at School (ST034Q)
The school environment variable assessing feeling like an outsider, belonging, awkwardness, loneliness, and making friends at school consists of six sub-items: “I feel like an outsider (or left out of things) at school” (reverse-coded); “I make friends easily at school”; “I feel like I belong at school”; “I feel awkward and out of place in my school” (reverse-coded); “Other students seem to like me”; and “I feel lonely at school” (reverse-coded; OECD, n.d.). Each sub-item is rated on a 4-point Likert scale, from strongly disagree (1) to strongly agree (4). Cronbach’s α: Finland = .85, United States = .84.
1-4) Bullying, Teasing, Threats, Having Things or Money Taken Away, Assaults, Fights, and a Lack of Safety at School (ST038Q)
The school environment variable, which assesses bullying, teasing, threats, having things or money taken away, assaults, fights, and a lack of safety at school, consists of nine sub-items: “During the past 12 months, how often have you had the following experiences at school? Some experiences can also happen on social media.”“Other students left me out of things on purpose”; “Other students made fun of me”; “I was threatened by other students”; “Other students took away or destroyed things that belonged to me”; “I got hit or pushed around by other students”; “Other students spread nasty rumors about me”; “I was in a physical fight on school property”; “I stayed home from school because I felt unsafe”; and “I gave money to someone at school because they threatened me” (OECD, n.d.). Each sub-item is rated on a 4-point scale (1 = Never or almost never, 2 = A few times a year, 3 = A few times a month, 4 = Once a week or more), and these nine sub-items are all reverse-scored items. Cronbach’s α: Finland = .83, United States = .81.
1-5) Parental (or Family) Interest, Encouragement, or Communication About Child’s School, Academics, or Friendships (ST300Q)
The family environment variable, which assesses parental (or family) interest, encouragement, or communication regarding child’s school, academics, or friendships, consists of seven sub-items: “How often do your parents or someone in your family do the following things with you?”“Discuss how well you are doing at school”; “Talk to you about any problems you might have at school”; “Ask you about how well you are getting along with other students at school”; “Encourage you to get good marks”; “Take an interest in what you are learning at school”; “Talk to you about your future education”; and “Ask you what you did in school that day” (OECD, n.d.). Each item is rated on a 5-point scale (1 = Never or almost never, 2 = About once or twice a year, 3 = About once or twice a month, 4 = About once or twice a week, 5 = Every day or almost every day). Cronbach’s α: Finland = .92, United States = .89.
The composite variable S was constructed using the following procedure: First, the sub-items comprising each variable were summed. Negatively worded items were reverse-coded prior to summation.

Next, the mean and standard deviation of ST270Q were calculated using the each country’s sample. Then, using this mean and standard deviation, ST270Q was standardized to obtain ZST270Q.

Z ST267Q, ZST034Q, ZST038Q, and ZST300Q were standardized in the same way. The composite variable S consists of the sum of the five standardized variables. The mean of S is 0 for both countries, with standard deviations of 2.30 for Finland and the United States.

Explanatory Variable 2: Expectancy for Success in Mathematics (Hereafter Referred to as E)
Expectancy for success in mathematics (E) is a composite variable constructed as the sum of three standardized variables. The three constituent variables of E are as follows:
2-1) Confidence in Mathematics 1 (ST290Q)
This variable, assessing students’ confidence in mathematics, consists of nine sub-items: “Working out from a <train timetable> how long it would take to get from one place to another”; “Calculating how much more expensive a computer would be after adding tax”; “Calculating how many square meters of tiles you need to cover a floor”; “Understanding scientific tables presented in an article”; “Solving an equation like 6x2 + 5 = 29”; “Finding the actual distance between two places on a map with a 1:10,000 scale”; “Solving an equation like 2(x + 3) = (x + 3) (x − 3)”; “Calculating the power consumption of an electronic appliance per week”; and “Solving an equation like 3x + 5 = 17” (OECD, n.d.). Each sub-item is measured on a 4-point Likert scale (1 = Not at all confident, 2 = Not very confident, 3 = Confident, 4 = Very confident). Cronbach's α: Finland = .93, United States = .90.
2-2) Confidence in Mathematics 2 (ST291Q)
This variable, assessing students’ confidence in mathematics, consists of ten sub-items: “Extracting mathematical information from diagrams, graphs, or simulations”; “Interpreting mathematical solutions in the context of a real-life challenge”; “Using the concept of statistical variation to make a decision”; “Identifying mathematical aspects of a real-world problem”; “Identifying constraints and assumptions behind mathematical modelling”; “Representing a situation mathematically using variables, symbols, or diagrams”; “Evaluating the significance of observed patterns in data”; “Coding/programming computers”; “Working with computer mathematics systems”; and “Calculating the properties of an irregularly shaped object” (OECD, n.d.). Each sub-item is measured on a 4-point Likert scale (1 = Not at all confident, 2 = Not very confident, 3 = Confident, 4 = Very confident). Cronbach’s α: Finland = .94, United States = .92.
2-3) Confidence in Mathematics 3 (ST268Q04JA)
This variable, assessing students’ confidence in mathematics, consists of a single item: “Mathematics is easy for me.” This item is measured on a 4-point Likert scale, from strongly disagree (1) to strongly agree (4).
The composite variable E was constructed using the following procedure: First, the sub-items of ST290Q and ST291Q were summed, respectively. There were no reverse-scored items. ST268Q04JA is a single-item variable with no sub-items, thus no summation is required.


Next, the mean and standard deviation of ST290Q were calculated using the each country’s sample. Then, using this mean and standard deviation, ST290Q was standardized to obtain ZST290Q.

Z ST291Q, ZST268Q04JA were standardized in the same way. The composite variable E consisted of the sum of the three standardized variables. The mean of E is 0 for both countries, with standard deviations of 2.55 for Finland, and 2.46 the United States.

Explanatory Variable 3: Perceived Value of Mathematics (ST268Q07JA)
This item, which assesses students’ perception of the value of mathematics, consists of a single question: “I want to do well in my mathematics class.” The scale for this item is a 4-point scale, from strongly disagree (1) to strongly agree (4). To provide a clearer analysis of the research question, this study selected only the samples that responded with “Strongly disagree” or “Strongly agree,” excluding those who answered “Disagree” or “Agree.” This study aims to compare differences in students’ motivation levels for mathematics learning behaviors based on their perception of the value of mathematics (ST268Q07JA). Excluding the ambiguous middle responses enables a clearer comparison between the two extreme groups (Buckley, 2009).
Outcome Variable: Students’ Motivation Levels for Learning Behaviors in Mathematics Classrooms (ST293Q)
This construct, assessing students’ motivation levels for learning behaviors in mathematics classrooms, comprises eight sub-items: “This school year, how often did you do each of the following?”“I actively participated in group discussions during mathematics class”; “I paid attention when my mathematics teacher was speaking”; “I put effort into my assignments for mathematics class”; “I gave up when I did not understand the mathematics material that was being taught” (reverse-coded); “I made time to learn the material for mathematics class”; “I asked questions when I did not understand the mathematics material that was being taught”; “I lost interest during mathematics lessons” (reverse-coded); and “I tried to connect new material to what I have learned in previous mathematics lessons” (OECD, n.d.). Each sub-item was measured on a 5-point Likert scale (1 = Never or almost never, 2 = Less than half of the time, 3 = About half of the time, 4 = More than half of the time, 5 = All or almost all of the time). Cronbach’s α: Finland = .77, the United States = .78. ST293Q was constructed by summing the eight sub-items, with reverse-coded items reversed before summation;

ST293Q was not standardized. The mean of ST293Q is 14.69 for Finland, and 15.96 for the United States, with standard deviations of 3.94, and 4.07, respectively. The minimum score is 4 and the maximum score is 25 for both countries.
Results
Distribution and Intergroup Differences in Finnish Students’ Motivation Levels for Learning Behaviors in Mathematics Classrooms
Figure 1 presents two scatter plots of Finnish students’ motivation levels for learning behaviors in mathematics classrooms (ST293Q) with their perception of the environment (S) and expectancy for success in mathematics (E) as axes. As students’ perception of the value of mathematics (ST268Q07JA) is measured on a binary scale consisting of 1 (Strongly disagree) and 4 (Strongly agree), it is visualized on two separate planes. Although students’ motivation levels (ST293Q) are a continuous variable ranging from 4 to 25, the data points of ST293Q are represented using varying shapes and colors across arbitrary intervals to visually highlight intergroup differences.

Scatter plots of Finnish students’ motivation levels for learning behaviors in mathematics classrooms.
In the left panel (ST268Q07JA = 4) of Figure 1, a notable concentration of scatter points representing high ST293Q values, depicted as ☆ and ◯, is observed in the first quadrant (S > 0, E > 0). Conversely, the third quadrant (S < 0, E < 0) predominantly exhibits scatter points representing low ST293Q values, depicted as ×, ▽, and △. In the right panel (ST268Q07JA = 1), ◯ markers indicating high ST293Q values appear in the first quadrant, while ×, ▽, and △ markers representing low ST293Q values are more prevalent in the third quadrant.
Distribution and Intergroup Differences in Finnish Students' Motivation Levels for Learning Behaviors in Mathematics Classrooms for Students With a Strongly Positive Perception of the Value of Mathematics
The intergroup differences among Finnish students observed in the left panel of Figure 1 are further confirmed by the frequencies and proportions of ST293Q across different intervals. When students have a strongly positive perception of the value of mathematics (ST268Q07JA = 4), the frequencies and proportions of ST293Q across intervals, divided into four quadrants based on the E = 0 and S = 0 axes, are presented in Table 2 below.
Frequencies and Proportions of Finnish Students’ Motivation Levels for Learning Behaviors in Mathematics Classrooms by Quadrant (When ST268Q07JA = 4, N, %).
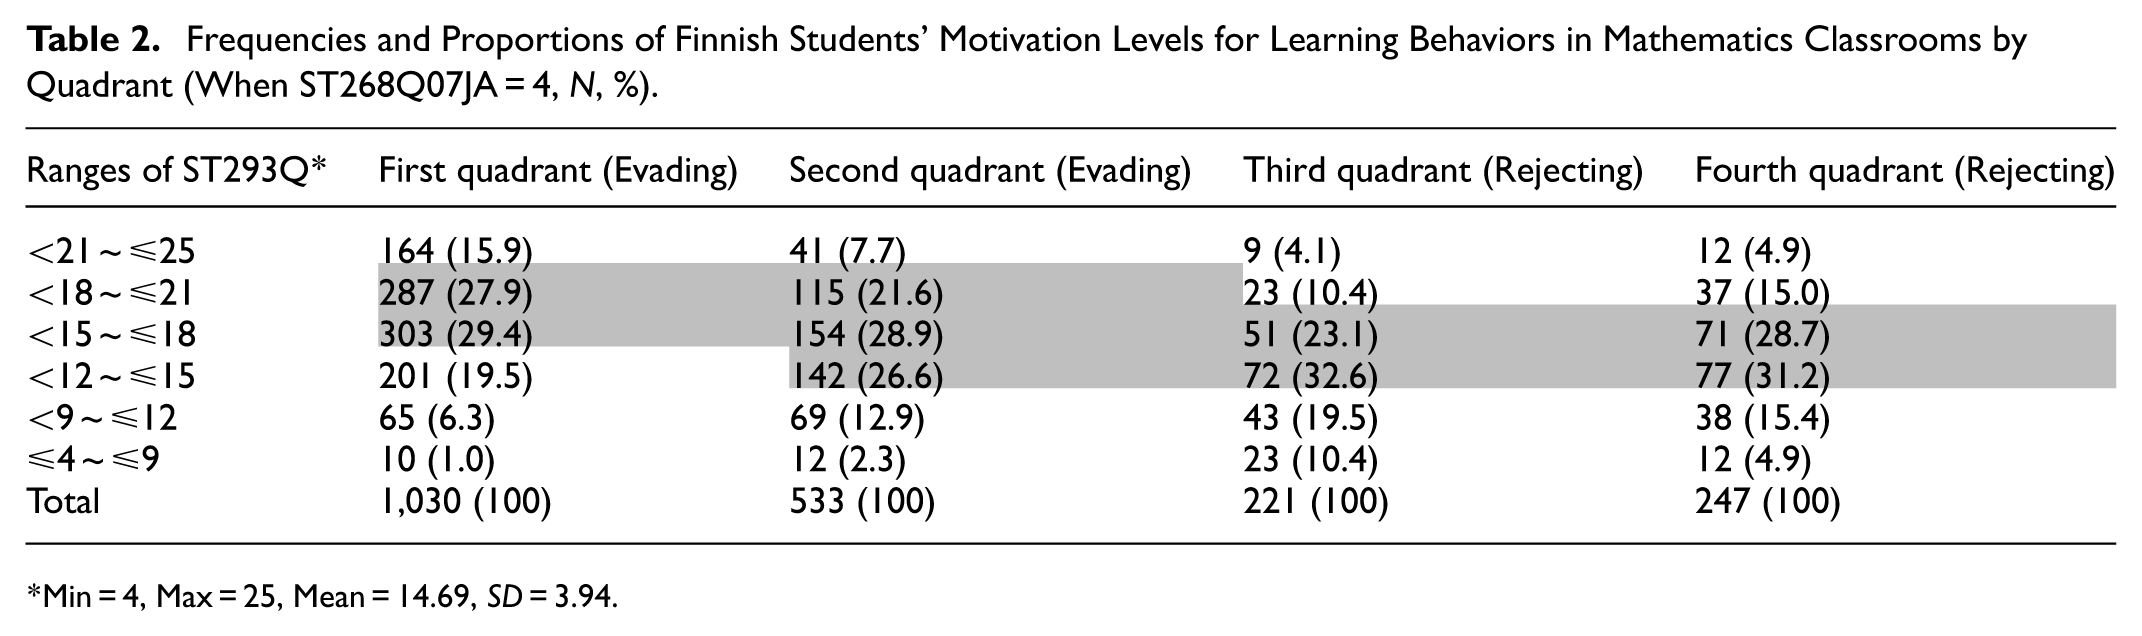

Min = 4, Max = 25, Mean = 14.69, SD = 3.94.
When students have a strongly positive perception of the value of mathematics, the frequency distributions of ST293Q in each of the four quadrants based on the E = 0 and S = 0 axes are shown in Figure 2 below.

Frequency distributions of Finnish students’ motivation levels for learning behaviors in mathematics classrooms (when ST268Q07JA = 4).
The frequency distribution of the first quadrant is substantially right-skewed relative to the mean (14.69), while those of the second, third, and fourth quadrants are approximately symmetrical around the mean. The mean, standard deviation, and quartiles of each quadrant group further support the observed differences in the distributions. The following table presents the mean, standard deviation, and quartiles of ST293Q in the four quadrants defined by E = 0 and S = 0 when ST268Q07JA = 4 (see Table 3). The first quadrant exhibits the highest mean (17.87) and quartiles, while the third quadrant shows the lowest mean (14.43) and quartiles. The means and quartiles of the second and fourth quadrants fall between those of the first and third quadrants.
Mean, Standard Deviation, and Quartiles of Finnish Students’ Motivation Levels for Learning Behaviors in Mathematics Classrooms by Quadrant (When ST268Q07JA = 4).

Min = 4, Max = 25, Mean = 14.69, SD = 3.94.
Levene’s test indicated that the assumption of homogeneity of variances was met, F(3, 2027) = 0.45, p = .719. An ANOVA reveals significant differences in the means among the four quadrant groups (p < .01; see Table 4).
One-Way ANOVA Results for Differences in Finnish Students’ Motivation Levels for Learning Behaviors in Mathematics Classrooms Among the Four Quadrant Groups (When ST268Q07JA = 4).


p < .01.
Post hoc comparisons using Tukey’s HSD test reveal statistically significant differences between the means of all four groups (p < .01; see Table 5).
Tukey HSD for ST293Q Among Finnish Students (When ST268Q07JA = 4).
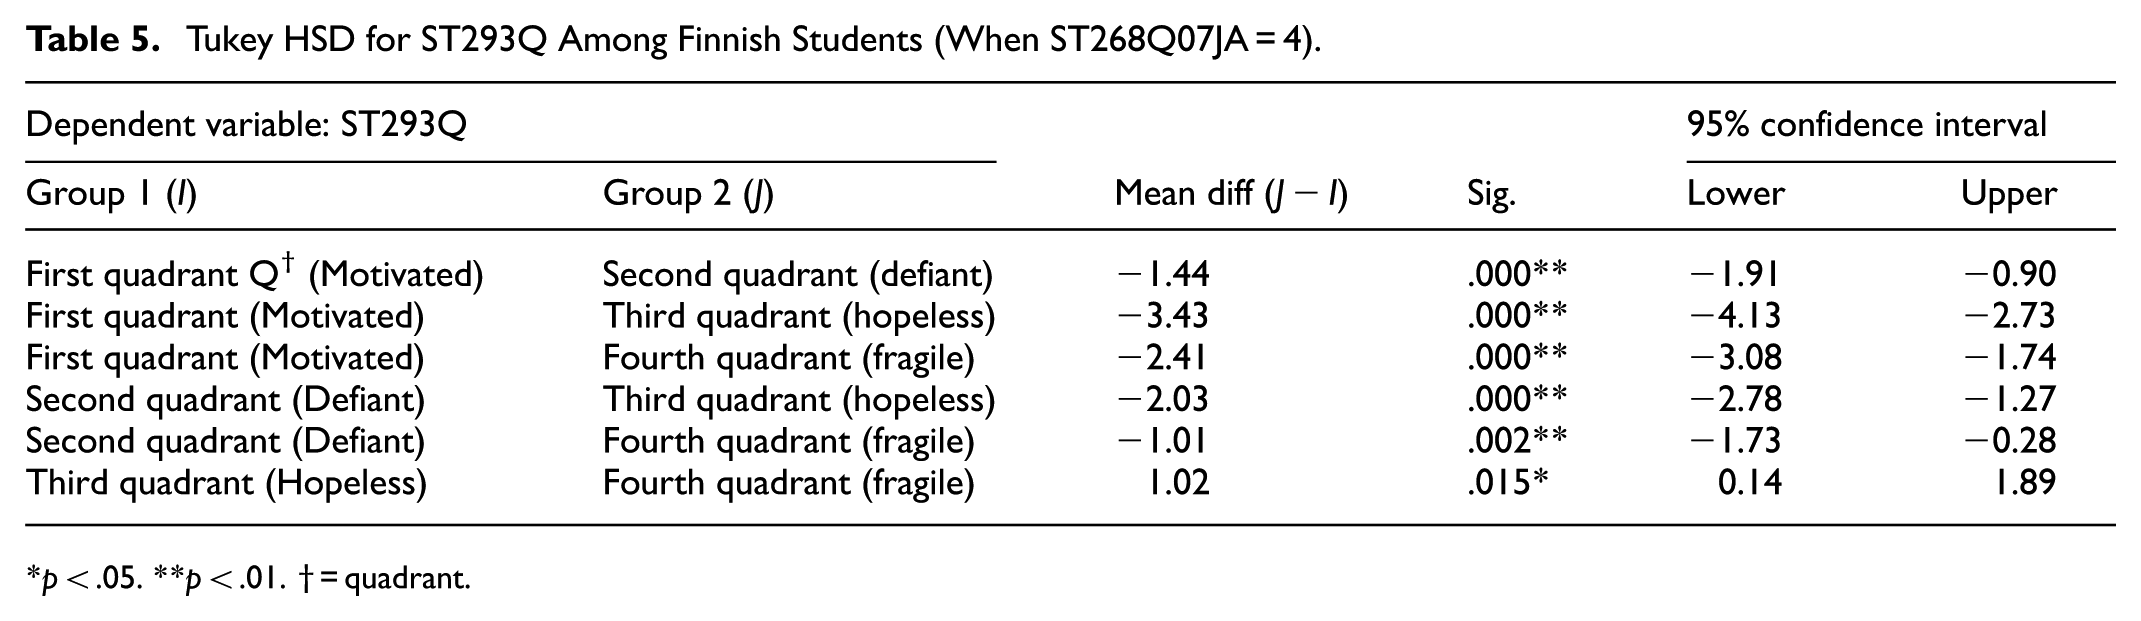
p < .05. **p < .01. † = quadrant.
Distribution and Intergroup Differences in Finnish students’ Motivation Levels for Learning Behaviors in Mathematics Classrooms for Students With a Strongly Negative Perception of the Value of Mathematics
The intergroup differences among Finnish students observed in the right panel of Figure 1 are further confirmed by the frequencies and proportions of ST293Q across different intervals. When students have a strongly negative perception of the value of mathematics (ST268Q07JA = 1), the frequencies and proportions of ST293Q across intervals, divided into four quadrants based on the E = 0 and S = 0 axes, are presented in Table 6 below.
Frequencies and Proportions of Finnish Students’ Motivation Levels for Learning Behaviors in Mathematics Classrooms by Quadrant (When ST268Q07JA = 1, N, %).


Min = 4, Max = 25, Mean = 14.69, SD = 3.94.
When students have a strongly negative perception of the value of mathematics (ST268Q07JA = 1), the frequency distributions of ST293Q in each of the four quadrants based on the E = 0 and S = 0 axes are presented in Figure 3 below.
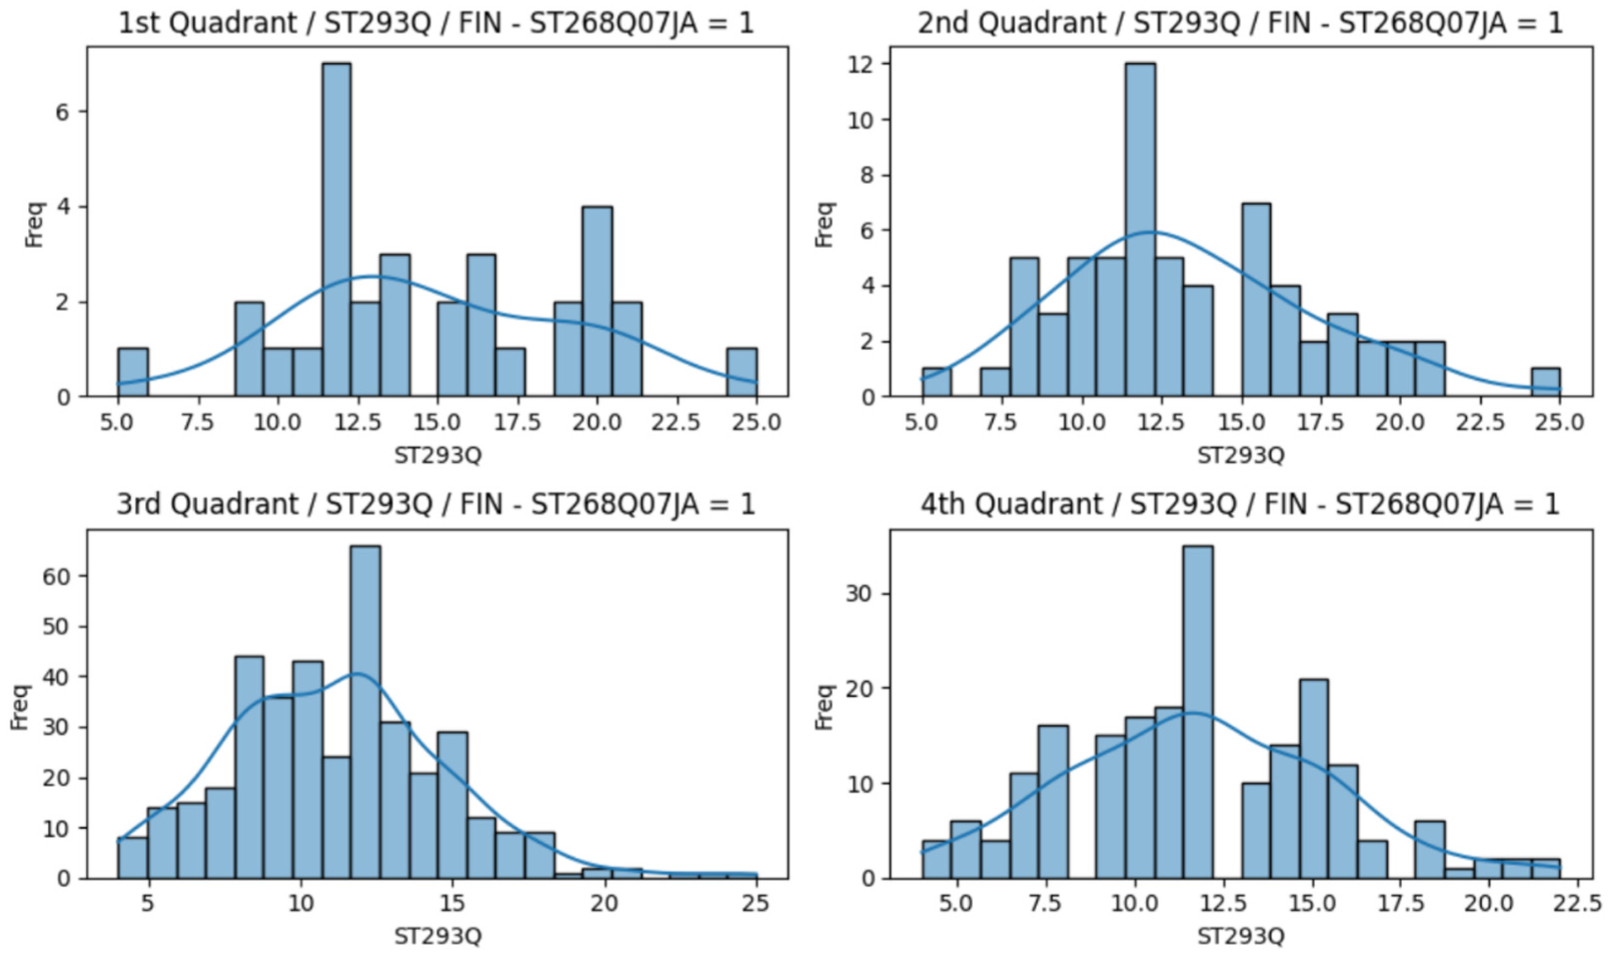
Frequency distributions of Finnish students’ motivation levels for learning behaviors in mathematics classrooms (when ST268Q07JA = 1).
The frequency distributions of the third and fourth quadrants are substantially left-skewed relative to the mean (14.69), and those of the first and second quadrants are similar in shape. The mean, standard deviation, and quartiles of each quadrant group further support the observed differences in the distributions. The following table presents the mean, standard deviation, and quartiles of ST293Q in the four quadrants defined by E = 0 and S = 0 when ST268Q07JA = 1 (see Table 7). The first quadrant exhibits the highest mean (14.88) and quartiles, while the third quadrant shows the lowest mean (11.09) and quartiles. The mean and quartiles of the second quadrant are closer to those of the first quadrant, whereas the mean and quartiles of the fourth quadrant are closer to those of the third quadrant.
Mean, Standard Deviation, and Quartiles of Finnish Students’ Motivation Levels for Learning Behaviors in Mathematics Classrooms by Quadrant (When ST268Q07JA = 1).
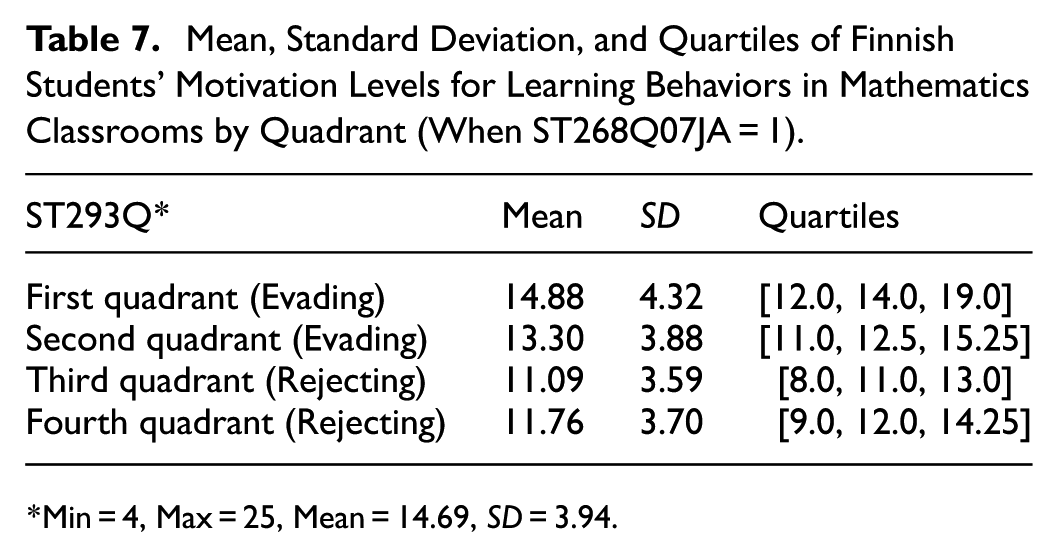
Min = 4, Max = 25, Mean = 14.69, SD = 3.94.
Levene’s test indicated that the assumption of homogeneity of variances was met, F(3, 679) = 1.43, p = .233. An ANOVA reveals significant differences in the means among the four quadrant groups (p < .01; see Table 8).
One-Way ANOVA Results for differences in Finnish Students’ Motivation Levels for Learning Behaviors in Mathematics Classrooms Among the Four Quadrant Groups (When ST268Q07JA = 1).


p < .01.
Post hoc comparisons using Tukey’s HSD test indicate no significant difference between the first and second quadrants (p > .05), and also no difference between the third and fourth quadrants (p > .05). All other pairwise comparisons between the quadrant groups demonstrate statistically significant differences (p < .01; see Table 9).
Tukey HSD for ST293Q Among Finnish Students (When ST268Q07JA = 1).


p < .05. **p < .01. † = quadrant.
Distribution and Intergroup Differences in U.S. Students’ Motivation Levels for Learning Behaviors in Mathematics Classrooms
Figure 4 presents two scatter plots of U.S. students’ motivation levels for learning behaviors in mathematics classrooms (ST293Q) with their perception of the environment (S) and expectancy for success in mathematics (E) as axes. As students’ perception of the value of mathematics (ST268Q07JA) is measured on a binary scale consisting of 1 (Strongly disagree) and 4 (Strongly agree), it is visualized on two separate planes. Although students’ motivation levels (ST293Q) are a continuous variable ranging from 4 to 25, the data points of ST293Q are represented using varying shapes and colors across arbitrary intervals to visually highlight intergroup differences.
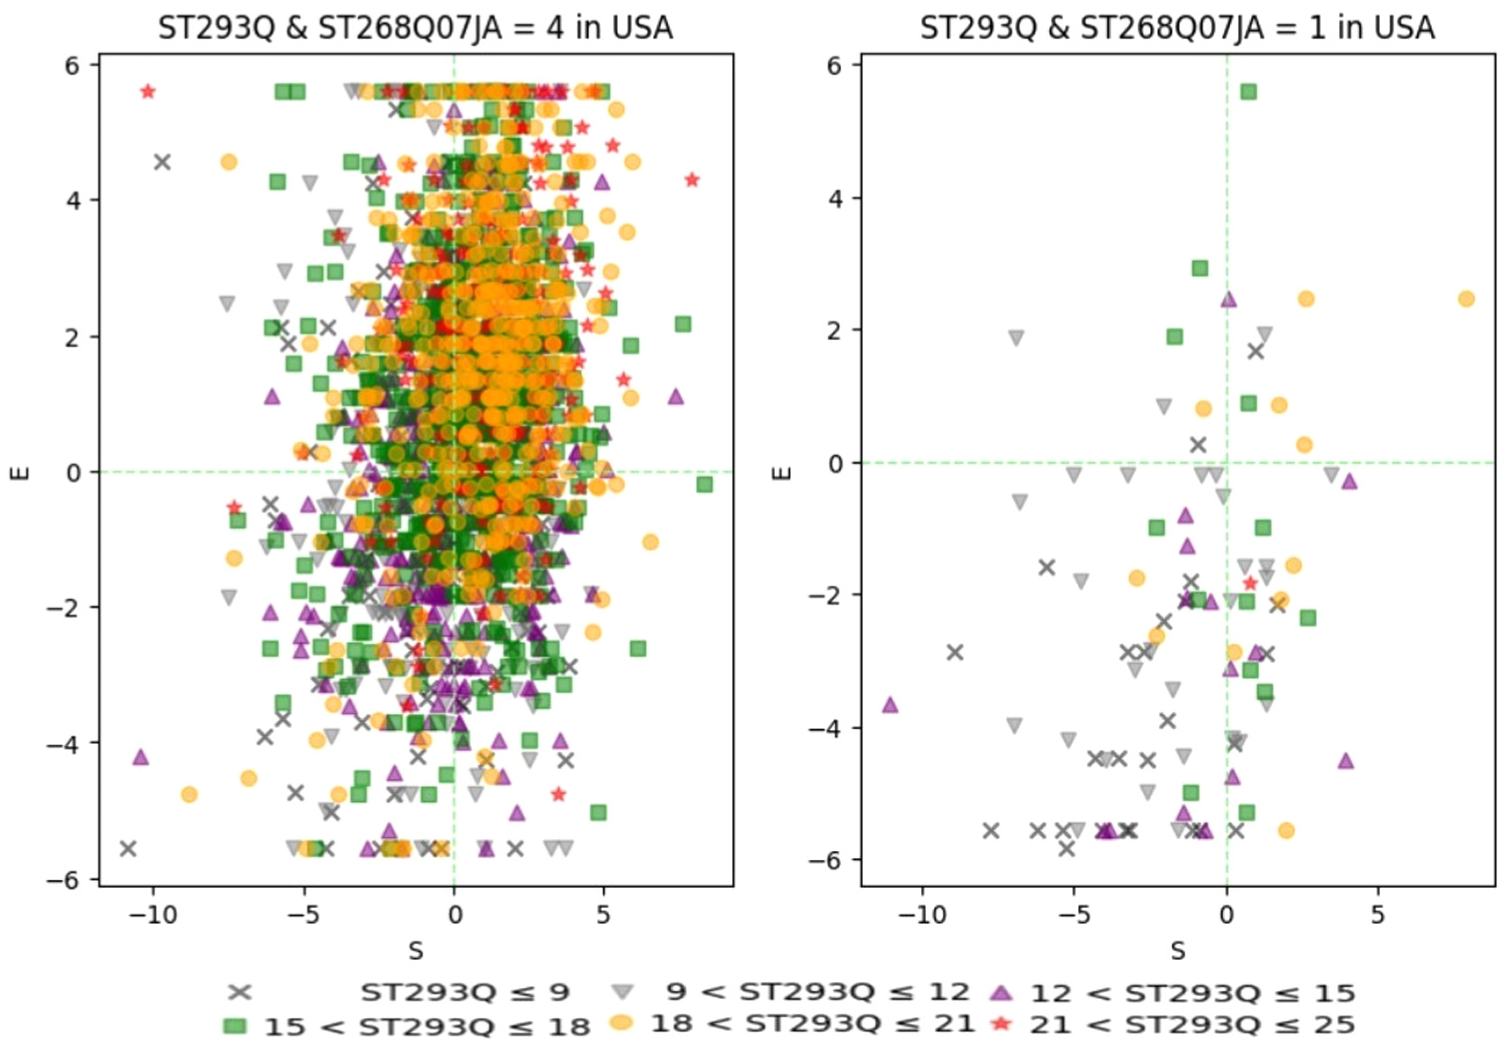
Scatter plots of U.S. students’ motivation levels for learning behaviors in mathematics classrooms (ST293Q).
In the left panel (ST268Q07JA = 4) of Figure 4, scatter points representing high ST293Q values, depicted as ☆ and ◯, are predominantly observed in the first quadrant (S > 0, E > 0), while scatter points representing low ST293Q values, depicted as ×, ▽, and △, are commonly observed in the third quadrant (S < 0, E < 0). In the right panel (ST268Q07JA = 1), ×, ▽, and △ markers representing low ST293Q values are prevalent in the third quadrant.
Distribution and Intergroup Differences in U.S. Students’ Motivation Levels for learning Behaviors in Mathematics Classrooms for Students With a Strongly Positive Perception of the Value of Mathematics
The intergroup differences among U.S. students observed in the left panel of Figure 4 are further confirmed by the frequencies and proportions of ST293Q across different intervals. When students have a strongly positive perception of the value of mathematics (ST268Q07JA = 4), the frequencies and proportions of ST293Q across intervals, divided into four quadrants based on the E = 0 and S = 0 axes, are presented in Table 10 below.
Frequencies and Proportions of U.S. Students’ Motivation Levels for Learning Behaviors in Mathematics Classrooms by Quadrant (when ST268Q07JA = 4, N, %).


Min = 4, Max = 25, Mean = 15.96, SD = 4.07.
When students have a strongly positive perception of the value of mathematics, the frequency distributions of ST293Q in each of the four quadrants based on the E = 0 and S = 0 axes are presented in Figure 5 below.

Frequency distributions of U.S. students’ motivation levels for learning behaviors in mathematics classrooms (when ST268Q07JA = 4).
The frequency distribution of the first quadrant is substantially right-skewed relative to the mean (15.96), while that of the third quadrant is slightly left-skewed. The frequency distributions of the second and fourth quadrants are approximately symmetrical around the mean. The mean, standard deviation, and quartiles of each quadrant group further support the observed differences in the distributions. The following table presents the mean, standard deviation, and quartiles of ST293Q in the four quadrants defined by E = 0 and S = 0 when ST268Q07JA = 4 (see Table 11). The first quadrant exhibits the highest mean (18.23) and quartiles, while the third quadrant shows the lowest mean (14.72) and quartiles. The means and quartiles of the second and fourth quadrants fall between those of the first and third quadrants.
Mean, Standard Deviation, and Quartiles of U.S. Students’ Motivation Levels for Learning Behaviors in Mathematics Classrooms by Quadrant (when ST268Q07JA = 4).

Min = 4, Max = 25, Mean = 15.96, SD = 4.07.
Levene’s test indicated a violation of the homogeneity of variances assumption, F(3, 2201) = 5.21, p = .001. Therefore, Welch’s ANOVA was conducted, revealing a significant difference among groups, F(3, 939.76) = 95.64, p < .001. Post hoc comparisons using the Games–Howell procedure revealed significant differences between all group pairs (see Table 12).
Games–Howell Post Hoc Comparisons for ST293Q Among U.S. Students (When ST268Q07JA = 4).

p < .05. **p < .01. † = quadrant.
Distribution and Intergroup Differences in U.S. Students’ Motivation Levels for Learning Behaviors in Mathematics Classrooms for Students With a Strongly Negative Perception of the Value of Mathematics
The intergroup differences among U.S. students observed in the right panel of Figure 4 are further confirmed by the frequencies and proportions of ST293Q across different intervals. When students have a strongly negative perception of the value of mathematics (ST268Q07JA = 1), the frequencies and proportions of ST293Q across intervals, divided into four quadrants based on the E = 0 and S = 0 axes, are presented in Table 13 below.
Frequencies and Proportions of U.S. Students’ Motivation Levels for Learning Behaviors in Mathematics Classrooms by Quadrant (When ST268Q07JA = 1, N, %).


Min = 4, Max = 25, Mean = 15.96, SD = 4.07.
When students have a strongly negative perception of the value of mathematics, the frequency distributions of ST293Q in each of the four quadrants based on the E = 0 and S = 0 axes are shown in Figure 6 below.

Frequency distributions of U.S. students’ motivation levels for learning behaviors in mathematics classrooms (when ST268Q07JA = 1).
The frequency distributions of the first and second quadrants are difficult to identify clear patterns due to the small sample size, while that of the third quadrant is substantially left-skewed relative to the mean (15.96) and that of the fourth quadrant is slightly left-skewed. The mean, standard deviation, and quartiles of each quadrant group further support the observed differences in the distributions. The following table presents the mean, standard deviation, and quartiles of U.S. students’ motivation levels (ST293Q) in the four quadrants defined by E = 0 and S = 0 when ST268Q07JA = 1 (see Table 14). The first quadrant exhibits the highest mean (16.13) and quartiles, while the third quadrant shows the lowest mean (10.75) and quartiles. The means and quartiles of the second and fourth quadrants fall between those of the first and third quadrants.
Mean, Standard Deviation, and Quartiles of U.S. Students’ Motivation Levels of Learning Behaviors in Mathematics Classrooms by Quadrant (When ST268Q07JA = 1).

Min = 4, Max = 25, Mean = 15.96, SD = 4.07.
Levene’s test indicated that the assumption of homogeneity of variances was met, F(3, 90) = .94, p = .426. An ANOVA reveals significant differences in the means among the four quadrant groups (p < .01; see Table 15).
One-Way ANOVA Results for Differences in U.S. Students’ Motivation Levels for Learning behaviors in Mathematics Classrooms Among the Four Quadrant Groups (When ST268Q07JA = 1).


p < .01.
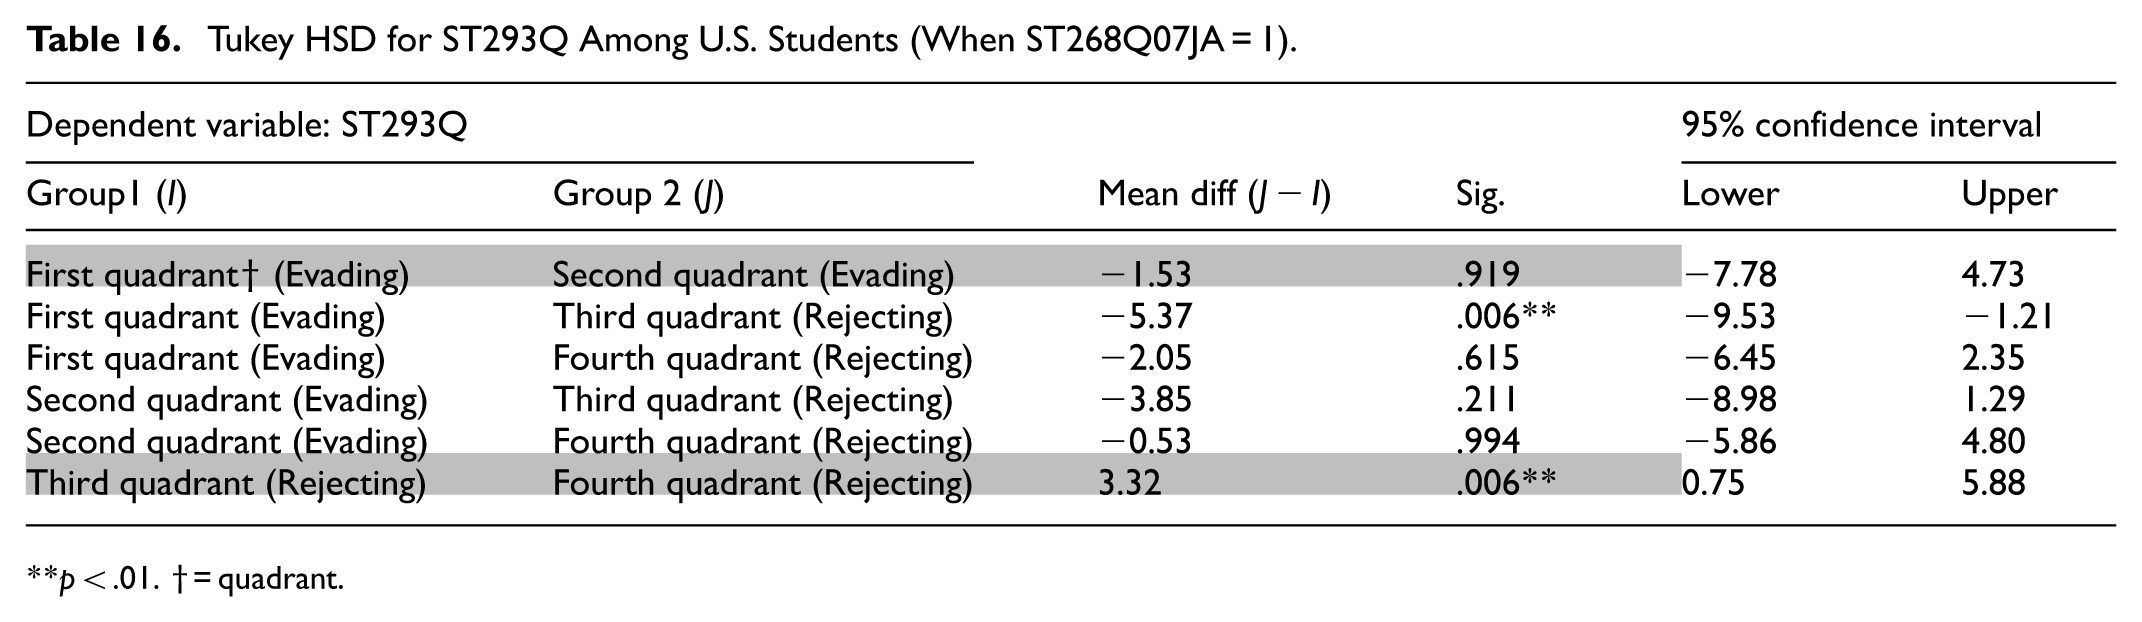
Post hoc comparisons using Tukey’s HSD test reveal no significant difference between the first quadrant group (Evading) and second quadrant group (Evading; p > .05), while a significant difference is observed between the third quadrant group (Rejecting) and fourth quadrant group (Rejecting; p < .01). This difference between Rejecting groups may be attributed to the smaller sample size in the United States (see Table 16).
Tukey HSD for ST293Q Among U.S. Students (When ST268Q07JA = 1).

p < .01. † = quadrant.
Discussion
When Students Place a Very Positive Value on Mathematics
Students who see value in a task and have strong confidence in their abilities and perceive the environment as supportive tend to be motivated (Ambrose et al., 2010). Supportive classroom environments, such as teacher-student closeness, enhance students’ engagement (Engels et al., 2021; Söderholm et al., 2023). Motivated students seek to learn, integrate, and apply new knowledge and view learning situations as opportunities to extend their understanding (Ambrose et al., 2010). Therefore, it is reasonable that the motivated group exhibits the highest motivation level for learning behaviors in mathematics classrooms among the groups.
Students who think the task is important and have strong confidence in their abilities but perceive little or no support from the environment tend to be defiant (Ambrose et al., 2010). Defiant students become less engaged in lessons as environmental support decreases (Flamant et al., 2023). However, negative activating emotions, such as those observed in defiant behavior, may also elicit extrinsic motivation to exert effort to avoid failure (Pekrun et al., 2011; Shao et al., 2023). They may adopt an “I will show you” or “I will prove you wrong” attitude in response to the lack of environmental support (Ambrose et al., 2010). Defiant students may put effort into class assignments, not give up when they do not understand the material, make time to learn the material, and try to connect new material with what they have learned in previous lessons. However, they may not hold interest during lessons, not actively participate in group discussions, not pay attention when the teacher is speaking, and refrain from asking questions when they do not understand. Accordingly, the defiant group exhibits the second-highest motivation level for learning behaviors in mathematics classrooms, just behind the motivated group.
Students who see value in a goal but lack confidence in their ability and perceive little or no support from the environment tend to be hopeless (Ambrose et al., 2010). Negative deactivating emotions, such as hopelessness, have negative effects on motivation and performance (Shao et al., 2023). As such, these students appear to have no expectation of success and demonstrate very low levels of motivation, exhibiting helpless behaviors (Ambrose et al., 2010). Therefore, these students are unlikely to hold interest during lessons, participate in group discussions, pay attention when the teacher is speaking, or ask questions when they do not understand. They also tend not to put effort into class assignments, do not make time to learn the material, and are likely to give up easily when they do not understand the material. Consequently, this group exhibits the lowest motivation level for learning behaviors in mathematics classrooms among the four groups.
When students perceive a supportive environment and see value in a goal but lack confidence in their ability to achieve it, they tend to be fragile (Ambrose et al., 2010). Although these students want to succeed, they are doubtful about their own abilities. As a result, they may try to protect their sense of self-esteem by feigning understanding, avoiding situations that require overt performance, denying difficulty, and making excuses to explain poor performance (Ambrose et al., 2010). Fragile pattern represents a maladaptive approach students use to protect their self-image in anticipation of academic failure (Schwinger et al., 2022). Hansen (1989) referred to fragile as “dissembling” and conceptualized it as follows:
Lesson dissembling. The task is situationally valent and self-expectancies are low: the individual-in-situation sees a relative value in the assignment but lacks confidence in his or her ability to meet lesson demands. The student is in a learning quandary, wanting to do the lesson, but uncertain of what to do, or how to do it, or whether it can be done. In the desire to avert threats to identity and self-esteem, the person dissembles, pretending to understand, making excuses, denying, distorting, or engaging in undifferentiated thinking that includes elements that do not seem pertinent to the task. (Hansen, 1989, p. 191)
According to Hansen (1989), dissembling students responded to ill-understood or overly demanding assignments by appearing busy and seeming to be actively involved with the tasks. They acted as if they knew or understood more than they actually did. Often they seemed to be actively participating in the lesson and managed to finish enough of the work to make the teacher believe they were trying. This tactic often worked. They often made greater efforts, but not in the ways their teachers expected. When confronted with inconsistent demands, they tended to adapt rather than challenge. They tended to concentrate even more on the context of the lesson, barely encountering the lesson itself. They usually reacted more productively to encouragement than to discipline. By trying to behave appropriately instead of focusing on completing the lesson, they were reinforced for an unproductive “performance” orientation rather than a “learning” orientation. Considering these characteristics of the dissembling students, it is reasonable that the motivation level for mathematics learning behaviors of the fragile group is higher than that of the hopeless group but lower than those of the motivated and defiant groups.
When Students Place a Very Negative Value on Mathematics
Students, in both supportive and unsupportive environments, who see little value in a goal but are confident in their ability to achieve it tend to be evading (Ambrose et al., 2010). Since they see the task as doable but unimportant, they often have difficulty paying attention and are frequently preoccupied with social distractions or daydreaming. Often, in an attempt to avoid overt disapproval and pressure from the teacher, or the stigma associated with a poor grade, they may do the minimum amount of work that is needed just to get by (Ambrose et al., 2010). Hansen (1989) conceptualized evading as follows:
Lesson evading. Situated self-expectancies are high, but task valence is low. The individual-in-situation feels confident of his or her ability to meet the demands of the assignment but sees little reason to do so. The student is in a learning bind, feeling ready and able to take on a challenge but unable to identify a goal of sufficient value. Constrained by the demands of the lesson and of the classroom, the student may go through the motions, perhaps even accomplishing the required tasks. However, the individual is removed from the learning situation; attention is scattered, given only partially to the lesson and to “managing the situation” in order to avoid uncomfortable levels of teacher intervention. In more important part, attention is turned or drifts to competing interests such as daydreaming, teasing a neighbor, worrying about lack of money, planning a party, recalling a television drama, or even mentally rehearsing another more compelling lesson in an area that is found challenging. (Hansen, 1989, p. 192)
According to Hansen (1989), evading students behaved as if they were indifferent to the assignment, even though they understood it well. They often worked haphazardly, seldom asking for help or feedback from the teacher, and when called upon, they tended to give irrelevant answers or try to change the subject. They were usually more responsive to discipline than support. Most teachers viewed evading as the most frequent type of disengagement in classrooms. Both evading and dissembling expressed ego defenses. Evading would also surface in response to boredom. Evading students would continue to monitor the activity and adjust their behavior according to that of the teacher. However, when in situations involving boring tasks, such as familiar rote drills, they would turn to other interests or entertainment (Hansen, 1989). Considering these characteristics of evading, it is reasonable that the motivation levels for mathematics learning behaviors of the evading groups are low, though higher than those of the rejecting groups.
Students, in both supportive and unsupportive environments, who see little value in a goal and lack confidence in their ability to successfully achieve it tend to be rejecting (Ambrose, et al., 2010). These students are prone to disengage from learning situations and may experience apathy, general passivity, alienation, or even a sense of anger if, in the case of a supportive environment, support is perceived as coercive or pressuring (Ambrose, et al., 2010). Considering the characteristics of rejecting, it is reasonable that their motivation levels for mathematics learning are the lowest among all six groups. Hansen (1989) conceptualized rejecting as follows:
Lesson rejecting. Both situated self-expectancies and task valence are low: the individual-in-situation lacks confidence in his or her ability and sees little value in the assigned task. The student is in a learning malaise, having neither a clear and valued goal nor feeling able to move toward any goal. In a state of psychological withdrawal, the student neither actively engages with the lessons nor defends against them, but simply rejects them. The student, who often appears passive and at times smoldering in anger, is working within a closed system of understandings that are unresponsive to the present challenges of the lesson. (Hansen, 1989, p. 192)
The distinction among fragile (or dissembling), evading, and rejecting: Teachers frequently confuse fragile with evading, possibly because the two strategies often seem similar in outward behavior, especially when evading or fragile behavior develops into lesson rejection. For some, when yet another meaningless and random task seems unworthy of effort, engaging would quickly shift to evading and, later, temporarily to rejection. More frequently, students would decide that both effort and pretending are useless, as they simply cannot complete the lesson in the way the teacher expects. In such instances, engaging is almost immediately substituted with dissembling and, later, temporarily with rejecting (Hansen, 1989). The majority of teachers seem to be more responsive to evading and pay little systematic attention to fragile and its treatment (Hansen, 1989). This represents one of the main reasons fragile often remains unnoticed in classrooms.
Conclusions
This study analyzed students’ motivation levels for learning behaviors in mathematics classrooms across eight groups, defined by expectancy for success in mathematics, perception of the value of mathematics, and a supportive or unsupportive environment. The study found that students’ engagement with mathematics lessons spans the spectrum from full engagement (Motivated) to Defiant, Fragile, Hopeless, Evading, and Rejecting. When students place a very positive value on mathematics, their learning behavior patterns fall into four types defined by their perceptions of the environment and their expectancy for success in mathematics: Motivated (supportive environment and high self-efficacy), Defiant (non-supportive environment and high self-efficacy), Hopeless (non-supportive environment and low self-efficacy), and Fragile (supportive environment and low self-efficacy). The motivated group exhibited the highest mean and quartiles for these motivation levels, followed by the defiant, fragile, and hopeless, respectively. This pattern was consistent across both countries. Students’ motivation levels differed across the four groups, and post hoc comparisons indicated significant differences between all four groups within each country.
When students place a very negative value on mathematics, their learning behavior patterns fall into two types defined by their perceptions of the environment and their expectancy for success in mathematics: Evading (supportive or unsupportive environment and high self-efficacy) and Rejecting (supportive or unsupportive environment and low self-efficacy). The mean and quartiles of the motivation levels were higher for the evading than for the rejecting, and these patterns were consistent across both countries. No significant differences were found between the two evading groups in any of both countries. However, for the rejecting groups, no significant differences were found in Finland, while a significant difference was observed in the United States. This difference may be attributed to the smaller sample size in the United States.
These findings which demonstrate that students’ patterns of learning behaviors vary based on expectancy for success, value perception, and a supportive or unsupportive environment, have significant implications for lesson planning and instructional design. Teachers should select learning content that is meaningful and valuable, while ensuring that students recognize its value. Additionally, lessons should be designed at appropriately tailored levels of difficulty and with suitable instructional methods to foster students’ expectancy for success. Especially given that self-efficacy is a key factor in promoting students’ engagement, mathematics educators should design math classes to foster students’ positive self-efficacy. Lastly, building a supportive classroom environment is required to encourage student engagement and motivation, which requires supportive teacher–student relationships and teachers’ effective feedback practices.
Limitations and Implications for Future Research
Due to the restricted PISA items, students’ perceived value of mathematics was measured with a single item and may not fully capture the scope of the intended construct. Further research should employ multi-item scales to enhance explanatory power. Students’ learning behaviors in classrooms are shaped by classroom culture. Future studies should examine whether similar patterns of learning behavior emerge among Asian students, whose classroom contexts differ substantially. Finally, this study focused on mathematics, and future research is needed to investigate whether these patterns generalize to other subject areas.
Supplemental Material
sj-ipynb-1-sgo-10.1177_21582440251395780 – Supplemental material for Patterns of Students’ Learning Behavior in Mathematics Classrooms, Depending on Expectancy for Success, Perceived Value, and Classroom Environment: A Focus on the United States and Finland
Supplemental material, sj-ipynb-1-sgo-10.1177_21582440251395780 for Patterns of Students’ Learning Behavior in Mathematics Classrooms, Depending on Expectancy for Success, Perceived Value, and Classroom Environment: A Focus on the United States and Finland by Daeseok Kim in SAGE Open
Footnotes
Ethical Considerations
Not applicable. Please note that this study does not require approval from an ethics committee, as it does not involve human participants or human participants’ data. Specifically, the author did not collect human participants or human participants’ data for the study. The data (PISA data) used for analysis in this study were provided by a third party and are publicly available. The data underlying the results presented in the study are freely available from the PISA 2022 Database website (![]() ). The author does not have permission to share the data. All samples in the open-access data used in this study are fully anonymized, and no information that can identify individual participants is included. The author did not prospectively recruit human participants for the study. That is, the author did not conduct a clinical trial, distribute questionnaires, or obtain tissues, data, or samples for the purposes of this study. Since the author did not collect human participants or human participants’ data for the study, there is no need to provide additional details regarding participant consent for the study. Because all samples in the open-access data used in this study are fully anonymized, and contain no information that can identify individual participants, the author is inherently restricted from accessing such identifying information during or after the study. Studies published in Sage Open that used the same PISA data were not required to submit IRB or ethics committee approval documents. Research using open-access data, such as PISA data, is generally not subject to IRB or ethics committee approval, and the requirement for informed consent is typically waived by the IRB or ethics committee.
). The author does not have permission to share the data. All samples in the open-access data used in this study are fully anonymized, and no information that can identify individual participants is included. The author did not prospectively recruit human participants for the study. That is, the author did not conduct a clinical trial, distribute questionnaires, or obtain tissues, data, or samples for the purposes of this study. Since the author did not collect human participants or human participants’ data for the study, there is no need to provide additional details regarding participant consent for the study. Because all samples in the open-access data used in this study are fully anonymized, and contain no information that can identify individual participants, the author is inherently restricted from accessing such identifying information during or after the study. Studies published in Sage Open that used the same PISA data were not required to submit IRB or ethics committee approval documents. Research using open-access data, such as PISA data, is generally not subject to IRB or ethics committee approval, and the requirement for informed consent is typically waived by the IRB or ethics committee.
Consent to Participate
As this study did not involve human participants, the provision of informed consent was not applicable.
Funding
The author disclosed receipt of the following financial support for the research, authorship, and/or publication of this article: This work was supported by the research grant of the Kongju National University in 2023.
Declaration of Conflicting Interests
The author declared no potential conflicts of interest with respect to the research, authorship, and/or publication of this article.
Code Availability
Supplemental Material
Supplemental material for this article is available online.
References
Supplementary Material
Please find the following supplemental material available below.
For Open Access articles published under a Creative Commons License, all supplemental material carries the same license as the article it is associated with.
For non-Open Access articles published, all supplemental material carries a non-exclusive license, and permission requests for re-use of supplemental material or any part of supplemental material shall be sent directly to the copyright owner as specified in the copyright notice associated with the article.