
Abstract
This study assesses renewable energy efficiency and resilience in the European Union (EU), comparing the Baltic Sea Region (BSR) and non-BSR (NBSR). It explores how efficiency and resilience are related and identifies financial factors that can strengthen both, in line with COP29 climate finance goals. Results show that climate risk reduces efficiency more severely in the BSR, while the NBSR demonstrates stronger resilience. Research and development (R&D) alone does not improve renewable energy efficiency resilience (REER), but when combined with foreign direct investment (FDI), outcomes improve, particularly in the NBSR. Other interactions, such as those involving green insurance, may instead weaken resilience. By incorporating these interaction effects, the model better captures complex relationships and improves performance. The study suggests that future research should integrate interaction terms and refine resilience indicators to reflect real-world dynamics, supporting more effective policies for renewable energy transitions under climate risk.
Introduction
Global warming and climate change have turned climate volatility into an unpredictable threat to economic activities. Renewable energy is key to reducing carbon emissions, yet climate risks challenge its production. In the UN’s 2015 Sustainable Development Goals, Goal 7 promotes access to sustainable energy, while Goal 13 urges action on climate change. These goals reveal a dilemma: climate risks undermine renewable energy output, but delaying its development may worsen the intensity and frequency of those risks.
Since Hu and Wang (2006) introduced the method for measuring Total-Factor Energy Efficiency (TFEE), the measurement of energy use efficiency has become a prominent issue, primarily viewed from the demand side. In contrast, renewable energy is inherently a supply-side issue, as its use depends on its production. However, renewable energy production is highly susceptible to climate risks. Relevant studies on renewable energy and climate risk include those by Shang et al. (2024), Olabi and Abdelkareem (2022), and Solaun and Cerdá (2019). Efficiency and resilience in renewable energy production are equally critical as humanity confronts climate-related threats. The concept of resilience, originally from engineering to describe material elasticity and recovery, was adapted by Holling (1973) to explain ecological systems’ resistance and recovery from stress. Despite its importance, the relationship between renewable energy output efficiency and production resilience under climate risks has been rarely explored. This study aims to fill that gap.
The Data Envelopment Analysis (DEA) approach offers a significant advantage in assessing energy efficiency. Hu and Chang (2023) and Chang (2024) applied the DEA method to explore energy resilience. The former examines energy resilience from environmental, social, and governance (ESG) perspectives, while the latter defines it through energy trade dynamics. Unlike Hu and Chang (2023), and Chang (2024), which applied DEA solely to evaluate resilience, our study develops an integrated framework that simultaneously measures both efficiency and resilience under climate risks. We also introduce two novel indicators, that is, the Renewable Energy Efficiency Resilience (REER) index and the Resilience Vulnerability (REERV) measure, which extend the conventional DEA-Tobit framework by capturing dynamic adaptation to climate shocks. Thus, DEA can be used not only to assess the energy efficiency of decision-making units (DMUs) but also to evaluate energy resilience. The innovation of this study lies in identifying the relationship between production efficiency and production resilience through the lens of renewable energy production. It is expected that these two dimensions are complementary.
To achieve net-zero emissions by 2050, the European Union (EU) will implement the Carbon Border Adjustment Mechanism (CBAM) in 2026. Despite ongoing climate risks, carbon reduction and net-zero goals remain essential. As a climate policy leader, the EU’s 27 member states are ideal for examining the impact of climate risks on renewable energy production efficiency and resilience. The paper is structured as follows: Section 2 reviews relevant literature; Section 3 outlines the methodology; Section 4 presents the empirical analysis; Section 5 provides the policy implications; and the final section provides concluding remarks.
Literature Review
The production of renewable energy is similar to agricultural production in that it is highly dependent on weather conditions. In other words, renewable energy generation is significantly affected by extreme weather events, making climate a key risk factor (Meenal et al., 2022; Osman et al., 2023). For instance, in 2023, Typhoon Doksuri swept through the Beijing-Tianjin-Hebei region of China, causing substantial damage to power infrastructure, leading to electricity supply shortages and threatening energy security (Nepal et al., 2024). Another example is the extreme cold weather in Texas, USA, in February 2021, which resulted in a historic peak in electricity demand for heating and nearly caused a power outage that would have left households without adequate heating. Post-event analysis indicated that if the energy efficiency of household heating systems had been improved during construction, the resilience of the power supply could have been enhanced (Wood et al., 2021). Carvallo et al. (2022) argue that improving energy efficiency is a key strategy to address extreme weather and strengthen energy resilience. Similarly, Aldieri et al. (2021) contend that enhancing both energy efficiency and resilience is essential to preventing energy vulnerability. Therefore, it is crucial for energy production systems to maintain high levels of efficiency and resilience to withstand the impacts of extreme climate events.
Gatto and Drago (2020) define resilience as a framework that can enhance and strengthen performance. Carvallo et al. (2022) argue that improving energy efficiency can enhance energy resilience; however, a unified standard for measuring resilience is still lacking. Chang et al. (1995) and Lee et al. (2022) employed the DEA method to calculate optimal output levels and then compared these with actual outputs to determine the efficiency-based resilience of production. Hu and Chang (2023) also used the DEA model, incorporating three dimensions, environmental, social, and governance, to assess energy resilience across 26 countries in Europe, the Americas, and the Asia-Pacific region. Chang (2024) posits that energy imports have a significant impact on energy resilience. From this perspective, he applied the DEA method to evaluate the energy resilience of the 27 EU member states and compared the differences in resilience between the Baltic Sea Region (BSR) and the Non-Baltic Sea Region (NBSR) within the EU. In this study, resilience is defined in an efficiency-based sense, measuring the extent to which renewable energy efficiency is maintained under climate risk. Our indicator of renewable energy efficiency resilience captures efficiency differences with and without shocks, emphasizing the system’s capacity to sustain performance (Folke, 2006; Walker et al., 2004). Moreover, this study also examines the vulnerability of renewable energy efficiency resilience by observing changes across consecutive periods. By contrast, sensitivity refers to the immediate degree of response to external shocks (IPCC, 2007). Thus, while related, sensitivity denotes short-term susceptibility, whereas resilience reflects a system’s capacity to absorb shocks while maintaining function.
In the field of energy efficiency research, various factors contributing to improved efficiency have been extensively examined. These studies commonly employ the DEA model to calculate energy efficiency, followed by the use of the Tobit regression model to identify significant influencing factors. Notable examples include studies by Qi et al. (2015), Aldieri et al. (2021), and Wang and Wang (2022). However, relatively few studies have applied the Tobit regression model to identify the determinants of energy resilience.
Moreover, the 29th Conference of the Parties (COP29) has been designated the “Climate Finance COP,” emphasizing the critical role of financial mechanisms in climate change adaptation and in achieving net-zero targets. Greenwood and Jovanovic (1990) found that financial systems can enhance energy production efficiency. The adoption of advanced production technologies can contribute to both energy savings and carbon emissions reduction, thereby improving energy efficiency. However, implementing such technologies requires substantial financial investment. Levine (2005) argued that financial markets can facilitate technological innovation by providing necessary capital to firms. Given the limited body of literature on this topic, the present study employs the DEA model to measure energy resilience and uses the Tobit regression model to identify financial factors that may enhance energy resilience.
Su et al. (2023) argue that the efficient development of renewable energy not only stimulates economic activity and generates employment but also enhances energy resilience. Chen and Deng (2020) found that green credit plays a key role in promoting renewable energy development. Renewable energy is closely linked to green finance, and financial instruments such as sustainable investment funds, carbon markets, and green bonds provide vital momentum for its advancement (Dźwigoł et al., 2019; Miśkiewicz, 2020; Miśkiewicz et al., 2022; Prokopenko & Miśkiewicz, 2020; Saługa et al., 2020). Recent studies have extended this perspective to new technological domains. For instance, Gu and Javed (2025) analyzed E-7 countries and demonstrated that energy structure, financial inclusion, and carbon emissions significantly shape artificial intelligence adoption, underscoring the intertwined role of finance, energy systems, and sustainability. The strong relationship between renewable energy development and finance is well established in the literature.
Li et al. (2022) employed the DEA method to evaluate the efficiency of renewable energy production. Jomthanachai et al. (2022) applied DEA to assess the resilience of global trade supply chains, while Hu and Chang (2023) and Chang (2024) used it to evaluate energy resilience. Building on this body of research, the present study first applies the DEA method to assess both the production efficiency and resilience of renewable energy. It then employs the Tobit regression model to identify financial factors that enhance the dimension of resilience of renewable energy. The goal is to leverage financial mechanisms to improve the efficiency and resilience of renewable energy systems, thereby mitigating climate risks and strengthening climate adaptation efforts.
Xu et al. (2025) examined solar energy consumption in G-20 nations and found that tourism and carbon emissions positively influence solar energy adoption, while trade and industrialization exert negative effects. Their analysis highlights the heterogeneity of these relationships across different levels of economic development, underscoring the importance of sector-specific policies in shaping renewable energy transitions. Li and Haneklaus (2022) found that in G-7 economies, increased clean energy consumption and trade openness are associated with lower CO2 emissions, while economic growth remains strong. This underlies the importance of joint policy emphasis on renewable energy and globalization for sustainable growth.
Recent EU initiatives further underscore the policy dimension of climate resilience. The EU Green Deal (European Commission, 2019) sets a long-term vision of achieving climate neutrality by 2050, placing strong emphasis on sustainable land use and energy transition. Complementarily, the Fit-for-55 package (European Commission, 2021) operationalizes this vision by establishing intermediate targets for 2030, aiming to reduce net greenhouse gas emissions by at least 55% compared to 1990 levels. Both frameworks directly shape the landscape of resilience research, reinforcing the need to integrate policy-driven approaches into empirical analyses.
Countries are increasingly facing the adverse impacts of climate-related disasters, which continue to disrupt economic production. Renewable energy is crucial for net-zero goals but remains vulnerable to climate risks. This study examines the production efficiency and resilience of renewable energy and their interrelation. Following COP29, global focus on climate finance has grown, prompting this study to also explore financial factors affecting renewable energy efficiency and resilience.
Methodology
This study employs the Data Envelopment Analysis model under the assumption of constant returns to scale, as developed by Charnes et al. (1978), commonly known as the CCR-DEA model, to assess production efficiency. Additionally, the concept of disaggregated efficiency proposed by Hu and Wang (2006) is adopted to evaluate renewable energy production efficiency. Furthermore, we examine the resilience of renewable energy production and identify factors that may enhance it. The CCR-DEA model, incorporating the impact of climate risks, is specified as follows:
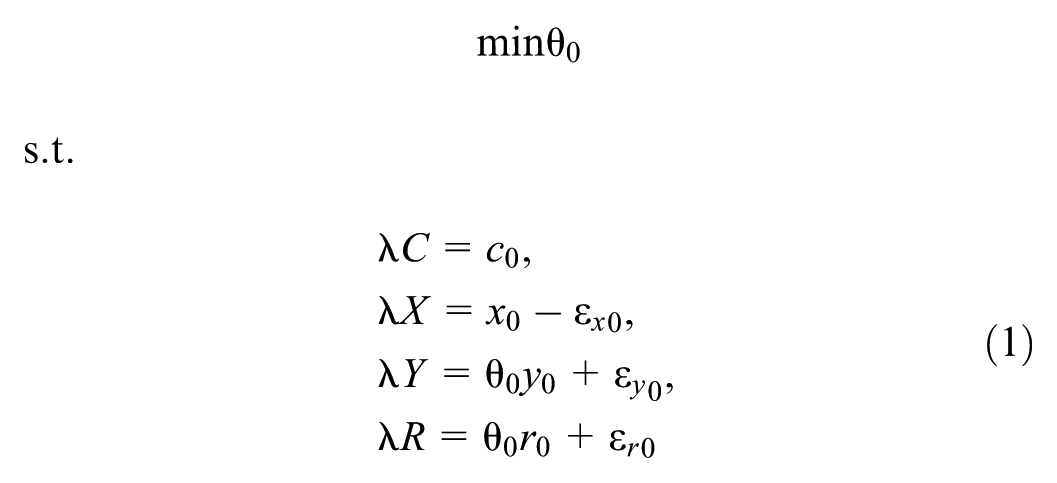
Model (1) calculates the production efficiency, denoted as θ0, for DMU 0, which is subject to damage losses caused by climate risk. Since climate risk is considered an input factor, c0 represents the inverse of climate damage loss. In addition to climate risk, x0 is also treated as an input used to produce the output y0, such as Gross Domestic Product (GDP), along with renewable energy r0. The slack variables εx0, εy0, and εr0 represent the excesses in input factors and the shortfalls in output factors. The vectors C, X, Y, and R represent climate risk, input factors, output factors, and renewable energy, respectively, while the vector λ denotes the weights that link the input and output factors.
By setting the first constraint in Model (1) to 1, that is, c0 = 1, the production efficiency is calculated without considering climate risk. Accordingly, Model (2) represents the CCR-DEA model excluding the impact of climate risk, as shown below:

The symbols θ0′, εx0′, εy0′, and εr0′ represent the production efficiency and the slack variables of input and output factors for DMU 0 in the model that does not consider climate risk. In this study, climate risk is represented by climate-related economic losses and ranked accordingly. Countries with smaller losses are ranked higher, indicating lower climate risk, whereas larger losses correspond to greater risk. Within this framework, the DEA model takes climate-related losses as a given input and evaluates the efficiency of transforming resources into desirable outputs under these conditions. This specification is consistent with the Climate Risk Index (Adil et al., 2025), which measures realized climate-related damages in both economic and human terms.
We then calculate the efficiency score of renewable energy production (REE) considering climate risk using Equation 3, and without considering climate risk using Equation 4, as follows:


The difference between REE0 and REE0′ highlights the impact of climate risk on renewable energy production efficiency. If REE0 > REE0′, it indicates that the renewable energy resilience of DMU 0 is strengthened; conversely, if REE0 < REE0′, it implies that the resilience is weakened. Therefore, the difference between REE0 and REE0′ can be expressed as D0 = REE0−REE0′. Based on this, an index is constructed to evaluate the renewable energy efficiency resilience (REER) score, as follows:

where Dall represents the REER difference across all DMUs. The REER score ranges from 0 to 1, where 0 indicates the weakest energy resilience and 1 indicates the strongest. In addition, Equation 6 can be used to estimate the rate of REER vulnerability (REERV) for DMU 0 at time t + 1, as follows:

The concept of REERV is illustrated in Figure 1. At period t, the resilience score for the DMU is 1, represented by point a. At period t + 1, climate risk affects the DMU’s production, causing its resilience score (as calculated by Equation 5) to drop below 1, as shown by point b′. Note that the potential improvement path for the DMU at t + 1 should move from point b′ to point b, reflecting the fragility induced by the climate shock. At period t + 2, if the resilience score rises to point c, it indicates that the impact of the climate shock has dissipated and the DMU has successfully adapted. However, if the resilience score declines from point b′ to point c′, it reflects vulnerability (as measured by Equation 6), indicating that the DMU’s resilience has been further compromised. If the DMU then strengthens its resilience by moving from point c′ to point d, it demonstrates a process of re-adaptation to climate stressors. To help readers better understand the efficiency–resilience metrics (Equations 3–6), this paper provides an illustrative example in Appendix A.

Resilience, fragility and vulnerability.
The Tobit model is commonly applied when the dependent variable is censored. In this study, the efficiency and resilience scores are bounded between 0 and 1, making the Tobit framework well-suited for handling corner solutions at these limits. We therefore adopt the Tobit regression model developed by Tobin (1958) to identify the factors influencing renewable energy efficiency resilience. Drawing on the financial indicators proposed by Wang and Wang (2022) and Su et al. (2023), this study analyzes the financial determinants of renewable energy efficiency resilience. The Tobit regression models are specified as follows:
Model 1 (without interaction terms):

Model 2 (with interaction terms):
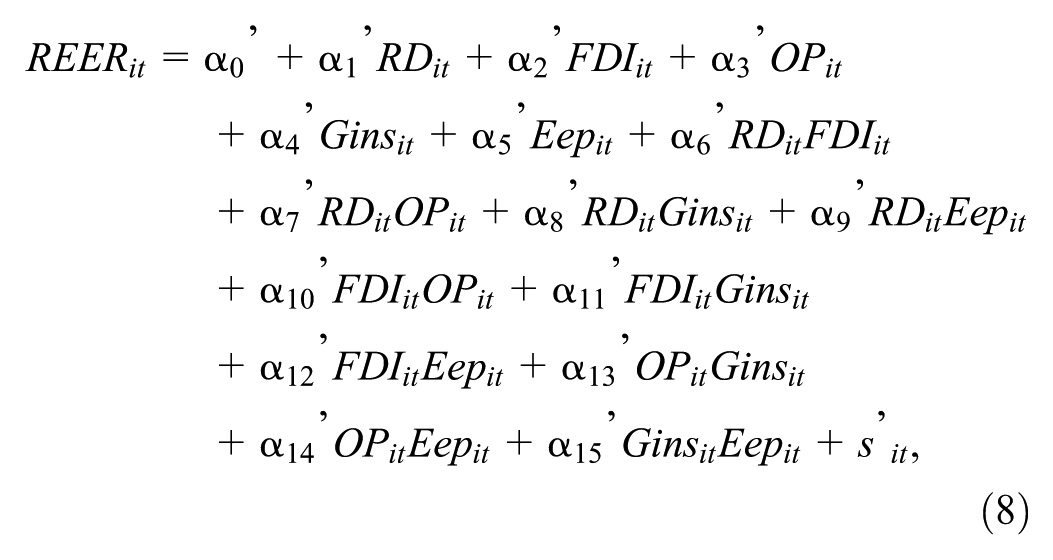
where i represents the ith DMU, and t refers to the data for the tth year. Models (7) and (8) align with the principles of climate finance, aiming to examine the effects of financial factors on the resilience of renewable energy efficiency. The variables used in Models (7) and (8) are explained in Table 1, as follows:
Explanation of Variables in Tobit Regression for Models (7) and (8).

The interaction terms included in Model (8) are grounded in the climate finance and energy resilience literature, where complementary or offsetting effects between innovation, foreign investment, risk-sharing instruments, and public environmental spending are frequently emphasized (Su et al., 2023; Wang & Wang, 2022). Additional interaction terms were initially tested, but those lacking statistical or theoretical support were excluded to maintain model parsimony and interpretability.
To provide a clearer overview of our study design, Figure 2 presents the conceptual framework. First, renewable energy efficiency with and without climate risk is evaluated using the DEA model. Second, the difference in efficiency is operationalized into indicators of resilience and vulnerability. Third, these indicators are examined in relation to financial drivers through Tobit regression, linking the analysis to climate finance. This integrated framework highlights the sequential and interconnected steps of the methodology.
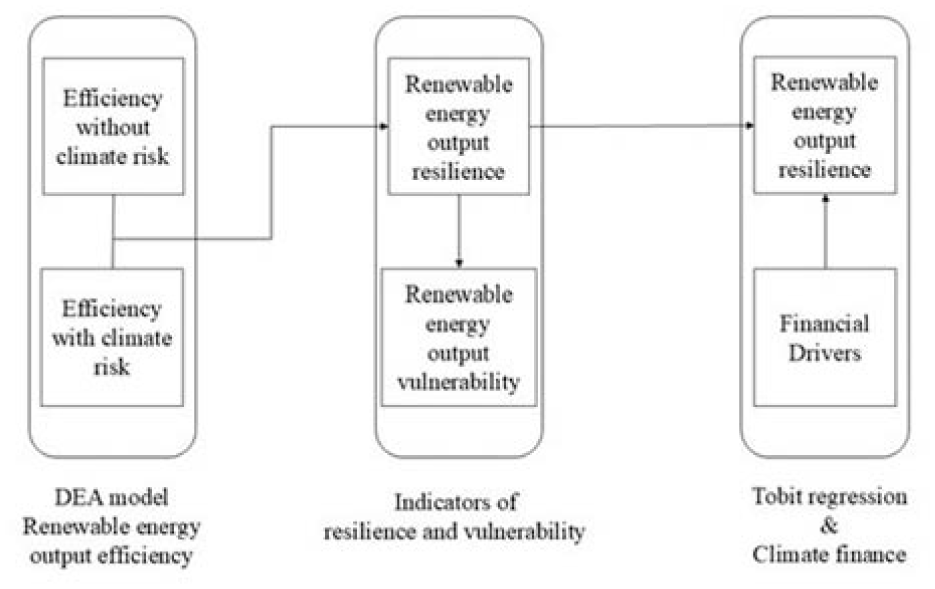
The framework figure on efficiency, resilience measure, and financial factors.
Empirical Study
This study aims to analyze the efficiency and resilience of renewable energy production in EU member states. The data are obtained from the World Bank Database and the Climate Risk Index website (https://www.germanwatch.org/en/cri). The final dataset covers the period from 2015 to 2019 and includes 23 EU member states; data for Cyprus, the Czech Republic, Malta, and Slovakia are excluded due to missing values. Hereafter, this paper uses regional and country codes to abbreviate the full names. The abbreviations are presented in Appendix B.
The analysis period from 2015 to 2019 was selected due to the availability of consistent and comparable data across EU countries. Starting from 2015, complete datasets on renewable energy, financial indicators, and climate risk became accessible. The cut-off at 2019 avoids distortions caused by the COVID-19 pandemic. Importantly, this period also corresponds to the initial phase of the Paris Agreement, making it especially relevant for analyzing the early impacts of climate neutrality efforts.
All nominal data are converted into real terms based on 2010 price levels to eliminate the effects of inflation. The descriptive statistics of the variables used in the DEA model are presented below.
Table 2 presents the mean, standard deviation, and coefficient of variation (CV) for each variable across the three groups of observation. The variables under analysis include the inverse CRI score, real capital stock (million US$), and labor force (1,000 persons) as input factors, and real GDP (million US$) and renewable energy consumption (TWh) as output factors. Since a higher CRI score indicates better performance, whereas input factors are expected to be minimized in efficiency analysis, the inverse CRI score is used to align with the characteristics of an input variable.
The Descriptive Statistics of Variables in DEA Model.

“EU” refers to the European Union as represented by the 23 included countries; “BSR” refers to the Baltic Sea Region, comprising eight countries; and “NBSR” refers to the Non-Baltic Sea Region, consisting of 15 countries.
The BSR exhibits the highest CV in real GDP, while both the EU and the NBSR show the highest CV in real capital stock. All regions display the lowest CV in the CRI score. Compared to the NBSR, the BSR demonstrates a higher CV in the CRI score. Similarly, in terms of renewable energy consumption, the BSR also presents a higher CV than the NBSR. These results suggest that: (a) the BSR and the NBSR have distinct characteristics, and (b) climate risk may influence renewable energy development, as indicated by the high variability in climate risk corresponding to high variability in renewable energy consumption and production. Therefore, it is meaningful to conduct a comparative analysis between the BSR and the NBSR, as well as to examine the relationship between climate risk, and renewable energy consumption and production.
Table 3 presents an analysis of production efficiency across multiple countries and years, comparing scenarios with and without the inclusion of climate risk (CR). Notably, certain countries such as Germany (DEU), Estonia (EST), and Sweden (SWE) consistently achieve an efficiency score of 1 in several years, indicating optimal performance. However, differences in production efficiency between the “with CR” and “without CR” scenarios are observed, and the “Change” column quantifies these discrepancies.
Production Efficiency.
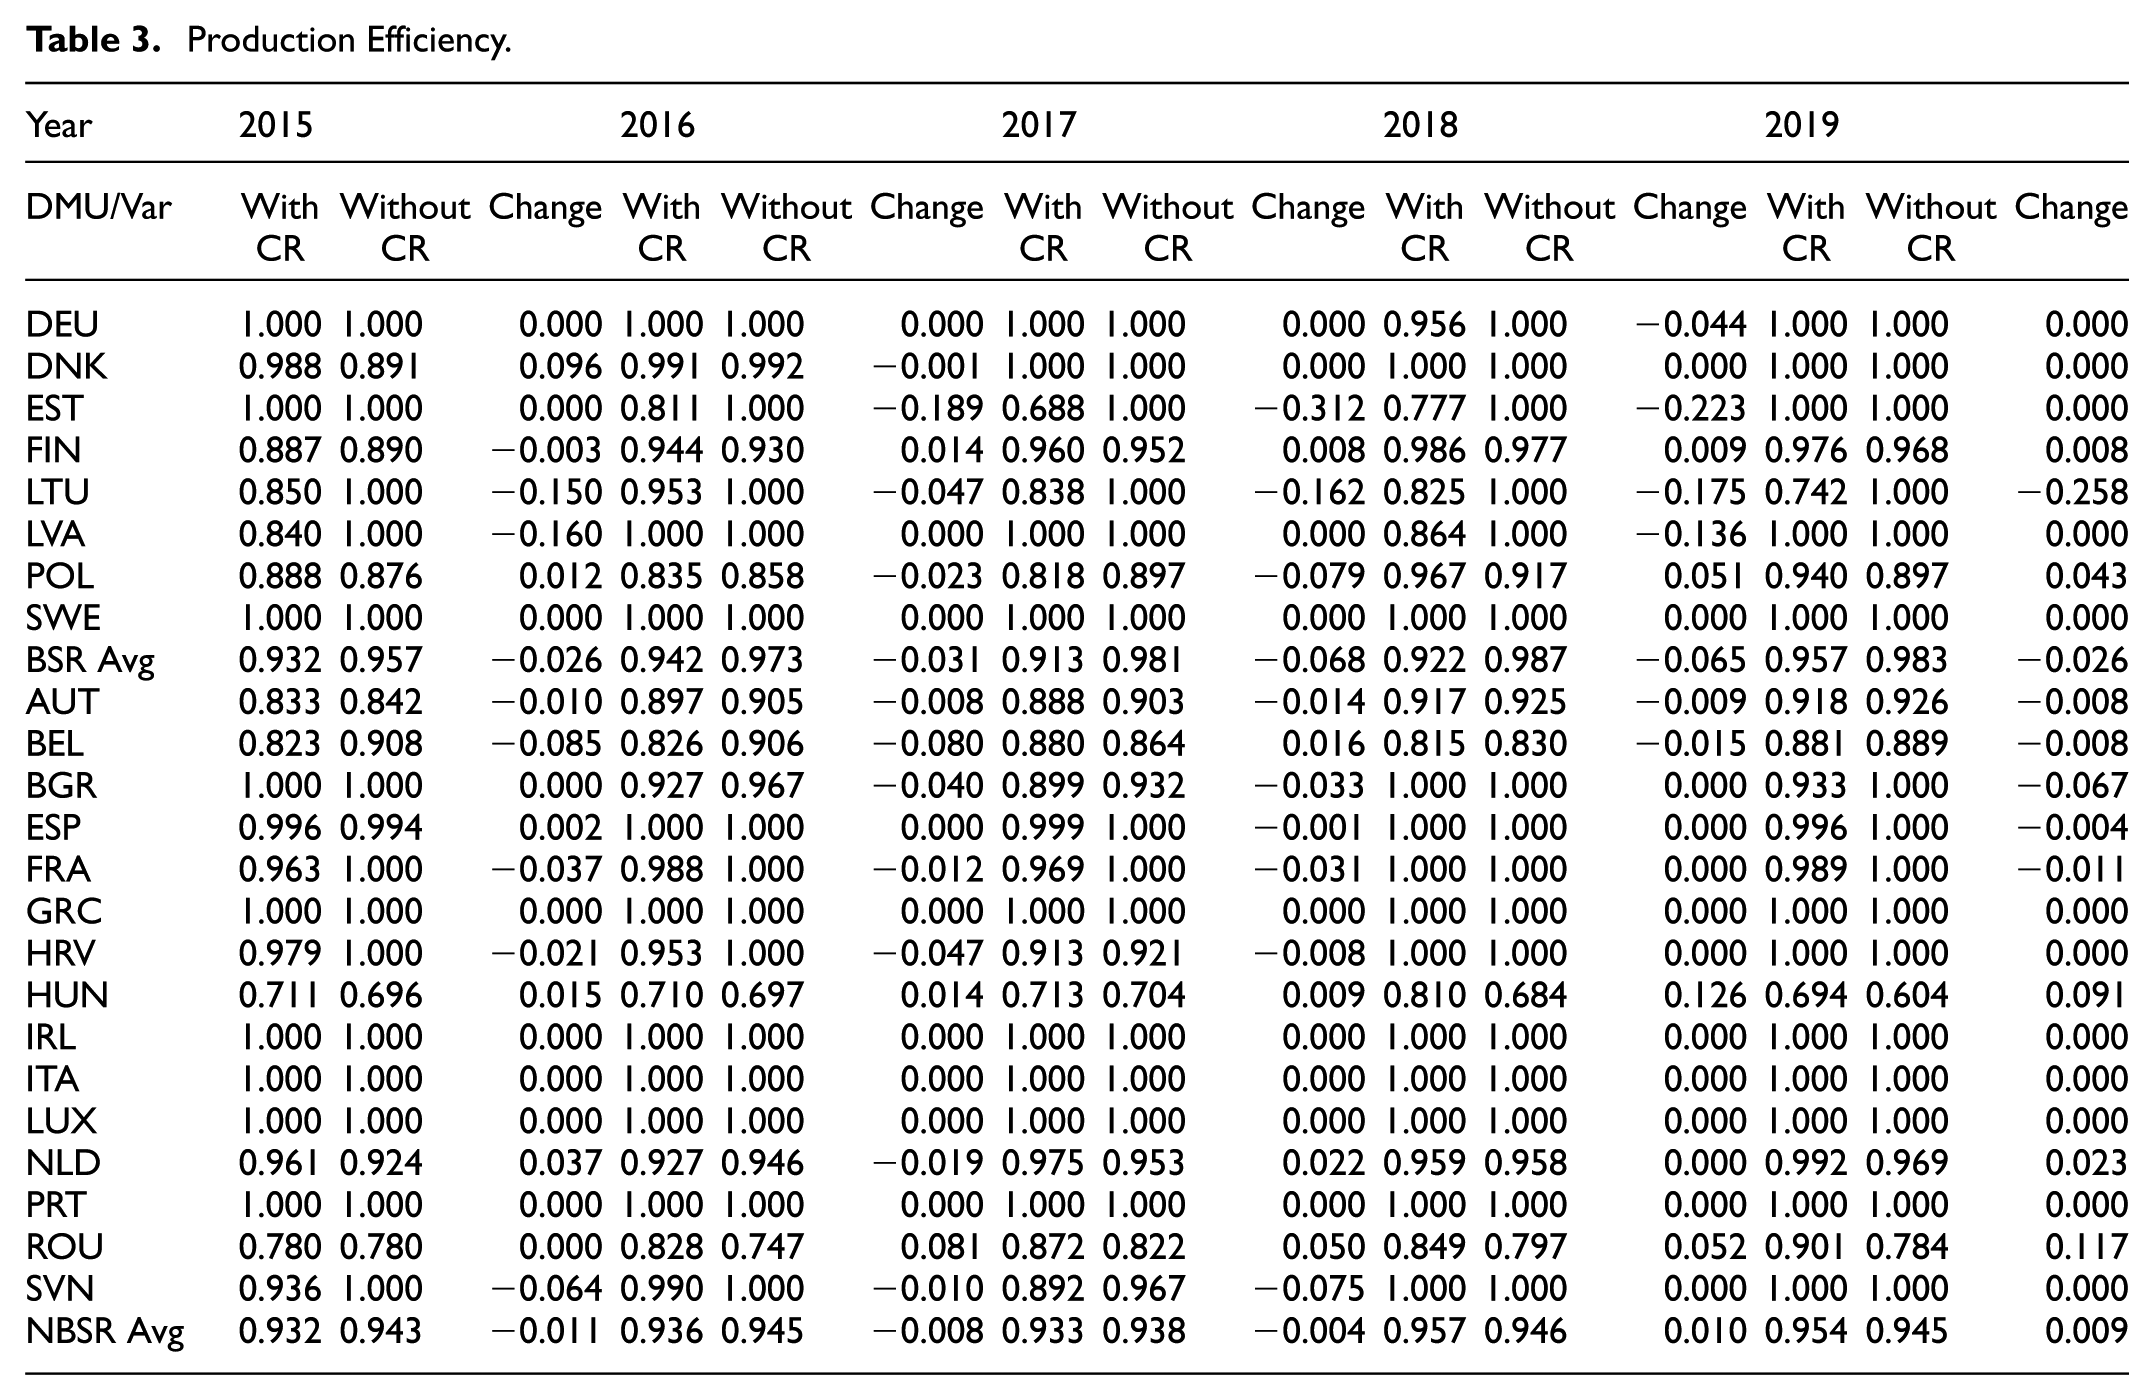
From 2015 to 2019, the average production efficiency values for both the BSR and NBSR exhibit slight fluctuations. Certain years and countries are particularly noteworthy. For instance, EST in the Baltic Sea Region experienced a significant decline of −0.312 in efficiency in 2017, warranting further investigation. Similarly, LTU, another BSR country, showed a substantial drop of −0.258 in 2019, possibly indicating the influence of climate risk on efficiency. Additionally, SWE in the BSR group, along with GRC, IRL, ITA, LUX, and PRT in the NBSR group, consistently maintained an efficiency score of 1 regardless of whether climate risk was considered. This result suggests that production efficiency in one BSR country and five NBSR countries remained unaffected by climate risk.
According to the “Change” column, the average absolute value in the BSR is consistently higher than that in the NBSR across all years. This suggests that the BSR is more significantly affected by climate risk compared to the NBSR. As noted by Meier et al. (2022) highlight that the region is experiencing above-average warming, particularly in winter, which exacerbates climate-related disruptions. Furthermore, Deppisch (2023), cities in the Baltic Sea Region face heightened vulnerability due to their geographic and infrastructural characteristics. These findings indicate that the BSR is more exposed to and impacted by climate risks than other EU regions.
Table 4 presents data on renewable energy efficiency across various countries and regions from 2015 to 2019. In 2015, the average efficiency in the BSR was 1.000 without CR, dropping to 0.894 when CR was considered. For the NBSR, efficiency started at 0.926 without CR and declined to 0.850 with CR, indicating a smaller yet still notable impact of CR compared to the BSR. Throughout the entire study period, renewable energy efficiency with CR consistently remained lower than that without CR in the BSR. A similar trend is observed in the NBSR, with the exception of 2018. This pattern suggests that climate-related factors exert a greater influence on renewable energy efficiency in the BSR than in the NBSR. This finding differs significantly from that of Chang and Shieh (2017), who found that energy efficiency in the BSR is consistently higher than in the NBSR. The current results suggest that the BSR performs worse in renewable energy efficiency compared to the NBSR.
Renewable Energy Efficiency.

Renewable energy efficiency remains stable under the CR scenario in many countries, reflecting sound risk management. In nations such as DNK, EST, LTU, POL, BEL, FRA, and NLD, efficiency is influenced by climate impetus. Notably, LTU saw a major drop in 2015, while BEL and FRA declined in 2015 and 2017, respectively. In contrast, HUN showed a slight increase, suggesting resilience in its renewable systems. Hartmann et al. (2017) highlighted Hungary’s potential in solar, wind, biomass, and geothermal energy, stressing their role in efficiency and transition. Similarly, Tóth et al. (2018) noted that while Hungary’s renewable usage is relatively low, government policies actively support renewable growth. These efforts reflect Hungary’s adaptability and resilience in responding to climate challenges.
Table 5, calculated using Equation 5, presents the resilience scores for production efficiency and renewable energy efficiency from 2015 to 2019 across the BSR and NBSR. Throughout the observed period, the production efficiency resilience of the NBSR consistently exceeds that of the BSR. Among the NBSR countries, ROU demonstrates strong production resilience, maintaining high scores across all 3 years. HUN in the NBSR and DNK in the BSR also exhibit strong performance, achieving resilience scores of 1 in 2018 and 2015, respectively. In contrast, EST in the BSR shows significant fluctuations, with zero scores from 2016 to 2018, indicating notable challenges in production resilience. Similarly, LTU and LVA recorded zero scores in 2019 and 2015, respectively. These results suggest that BSR countries such as EST, LVA, and LTU may face persistent difficulties in maintaining production efficiency.
Resilience Scores of Production Efficiency and Renewable Energy Efficiency.

POL in the BSR shows improvement in renewable energy resilience, reaching a score of 1 in 2017, reflecting strong commitment. LTU drops to zero in 2018, indicating challenges. In the NBSR, scores steadily rise from 0.582 in 2015 to 0.841 in 2018, then slightly decline to 0.810 in 2019. HUN performs well, while the NLD achieves a perfect score of 1 in 2018. ROU shows strong production efficiency resilience, and HUN leads in renewable energy. EST and FRA face continued challenges.
The cross-country patterns reveal notable heterogeneity in resilience performance. For instance, LTU and EST consistently face resilience challenges. This outcome may be linked to their structural dependence on imported energy and the relatively limited diversification of their renewable energy portfolios. Such reliance exposes them to external supply shocks and constrains their adaptive capacity, as reflected in their comparatively low REER scores. By contrast, HUN and ROU demonstrate stronger performance in terms of both efficiency and resilience. Their favorable outcomes can be partly attributed to targeted renewable energy policies, greater domestic energy resource endowments, and the effective utilization of EU-supported investments. These initiatives have enhanced the ability of both countries to consolidate efficiency gains while adapting to climate-related risks. Together, these cases illustrate how differences in energy structures, policy environments, and financial support mechanisms shape resilience trajectories across EU member states, complementing the quantitative evidence presented in the results tables.
Equation 6 assesses resilience vulnerability in production and renewable energy efficiency. Table 6 reports results from 2015 to 2019 for countries in the BSR and NBSR. In the BSR, LTU shows consistent production efficiency vulnerability from 2017 to 2019, indicating weak climate resilience. In the NBSR, BGR exhibits similar vulnerability in 2018 to 2019. For renewable energy efficiency, LTU reveals severe vulnerability in the BSR, with a 9% drop in 2017 and a sharp decline to 100% in 2018. No NBSR country shows vulnerability in this area during the period. These findings underscore the need for strong policy interventions to enhance resilience.
Resilience Vulnerability on Production Efficiency and Renewable Energy Efficiency.
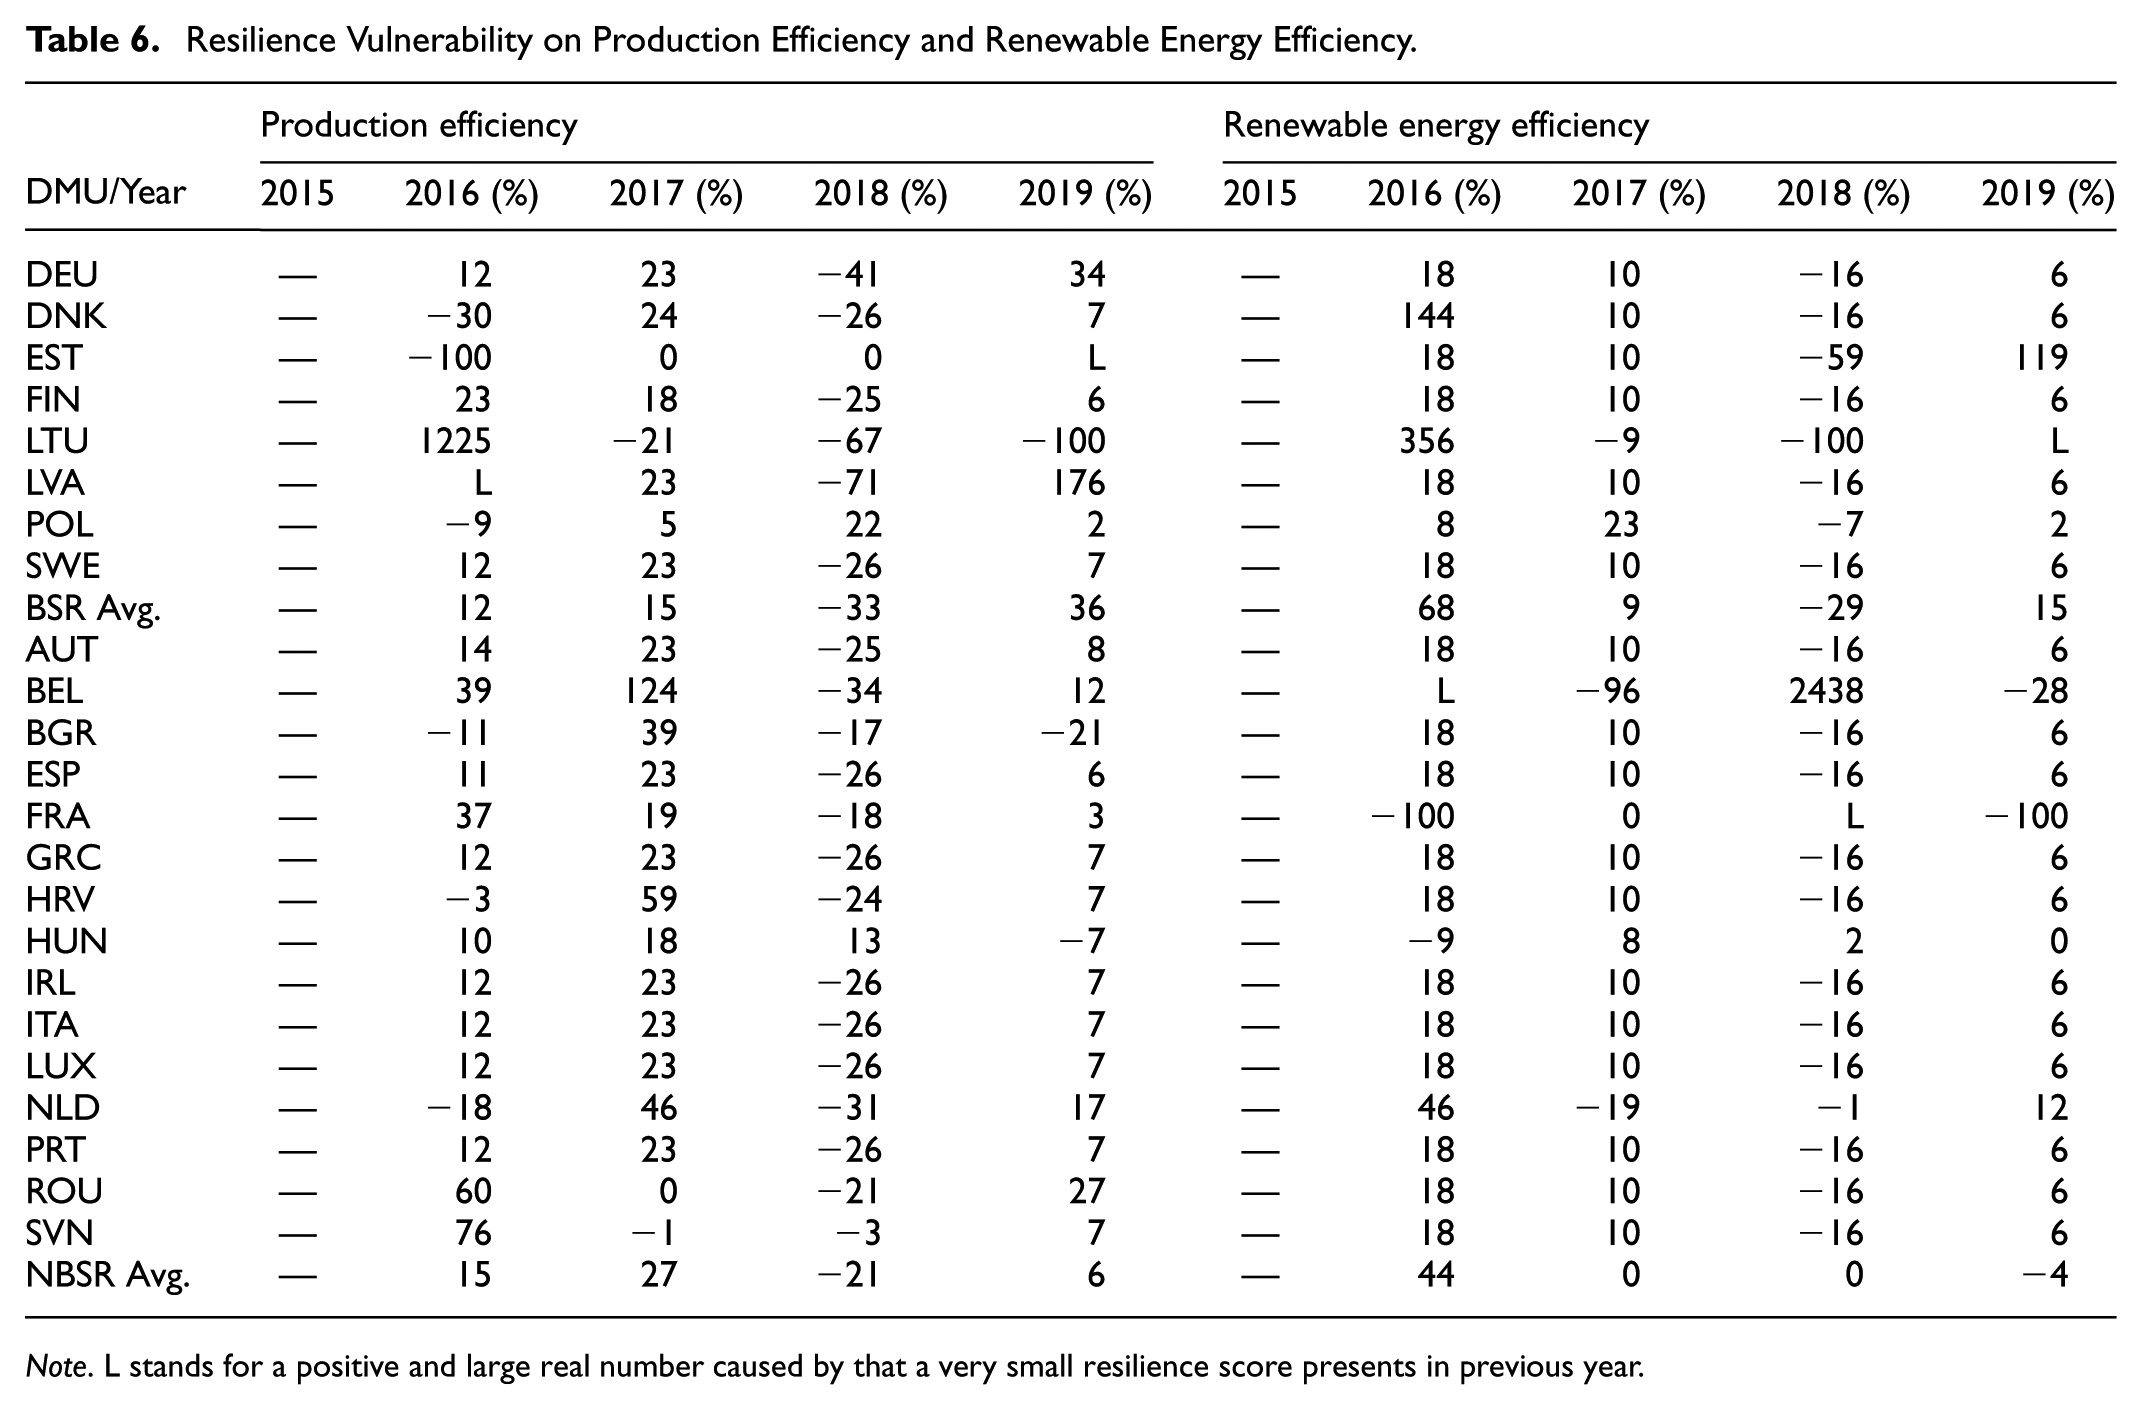
Note. L stands for a positive and large real number caused by that a very small resilience score presents in previous year.
This study employs a Tobit regression model, with Model 1 excluding interaction terms and Model 2 including interaction terms, to examine the effects of various independent variables (X1–X5, as defined in Table 1) on the REER. The regression results are presented in Table 7. In Model 1, the constant terms (C) are significantly positive for the EU, NBSR, and BSR, indicating a strong baseline effect when all independent variables are held at zero. Among the three groups, the NBSR exhibits the highest constant estimate of 1.012, with a p-value less than .001, suggesting the strongest fixed effect.
Tobit Regression.

Note. *, **, and *** denote p < 0.1, p < 0.05, and p < 0.01, respectively.
Among the independent variables, R&D expenditure (X1) is statistically significant only in the NBSR model (coefficient = −0.123, p = .002), indicating a notable negative impact on the REER. In contrast, its effects in the EU and BSR models are insignificant, suggesting R&D does not positively influence the REER in any region studied. While innovation is often linked to R&D, recent studies suggest the relationship remains ambiguous across EU member states (Pelikánová, 2019). Foreign direct investment (X2) and crude oil price (X3) are consistently insignificant, implying no strong or linear link to the REER. Green insurance (X4) shows a significant negative effect in the EU model (coefficient = −0.011, p = .037) and a similar trend in the BSR model (p = .088), indicating a potentially consistent influence. Government environmental protection expenditure (X5) is not significant in any region. Model 1 excludes interaction terms, denoted by “—.”
An important and somewhat counterintuitive result concerns the negative effects of R&D expenditure and green insurance on renewable energy efficiency resilience. One possible explanation is that R&D investments in the renewable sector often involve substantial upfront costs, while the benefits in terms of efficiency and resilience materialize only in the longer term. In the short run, such expenditures may therefore appear as a financial burden, especially if funding priorities are misaligned toward projects with limited near-term applicability. Similarly, the negative association of green insurance with resilience may be linked to institutional inefficiencies in its design and implementation. High premium costs, restricted coverage, or the lack of integration with broader risk management frameworks may undermine its intended stabilizing effect. Instead of mitigating risks, these features may increase financial pressures on renewable energy systems in the short term. Taken together, these findings suggest that while both R&D and green insurance have strong theoretical potential to enhance resilience, their effectiveness depends on proper alignment of funding priorities, institutional design, and the timing of benefits relative to costs.
Based on the information criteria, the NBSR in Model 1 performs best overall, with AIC, BIC, and HQIC values of 0.057, 0.273, and 0.143, respectively, indicating an optimal balance between model fit and parsimony. While the BSR yields the highest log-likelihood, it also has the highest BIC, suggesting greater model complexity compared to the EU and NBSR. The Tobit regression’s standard error is lowest in the BSR, at 0.228, implying smaller estimation errors and potentially better fit in low-noise contexts.
In Model 2, we examine the effects of interaction terms. First, the constant term (C) is positive and statistically significant in both the EU (coefficient = 1.632, p-value = .003) and the NBSR (coefficient = 1.426, p-value = .032), suggesting a strong baseline influence. As for the main effects of variables X1 through X5, none are statistically significant across the EU, NBSR, or BSR.
Model 2 becomes more insightful when considering interaction terms, particularly in the NBSR, which reveals several significant effects:
(i) X1X2 is significantly positive in NBSR (p-value = .024) and marginally significant in EU (p-value = .069), indicating a joint influence of R&D expenditure and FDI on improving REER;
(ii) X1X4 is significantly negative in NBSR (coefficient = −0.055, p-value = .032), suggesting that the interaction between R&D expenditure and green insurance deteriorates REER;
(iii) X1X5 is also significantly negative in NBSR (coefficient = −0.270, p-value = .008), implying that combined increases in R&D and government environmental protection expenditures negatively affect REER;
(iv) X2X4 is significantly negative in NBSR (coefficient = −0.003, p-value = .021), highlighting the adverse interaction between FDI and green insurance on REER;
(v) X2X5 is significantly positive in both the EU (p = .076) and NBSR (p-value = .060), indicating that FDI and government environmental spending together promote REER;
(vi) X3X4 is significantly positive in BSR (p-value = .078), suggesting that the interaction between crude oil prices and green insurance strengthens REER.
In terms of model fit, the NBSR demonstrates the highest log-likelihood (18.553), indicating superior fit. It also exhibits the lowest AIC (−0.041) and HQIC (0.168), suggesting a better balance between model simplicity and explanatory power. Moreover, the regression standard error in the NBSR (0.213) is the smallest among the EU and BSR models, indicating more precise estimates.
The sample sizes for the EU, NBSR, and BSR are 115, 75, and 40, respectively. The smaller sample size in the BSR model may reduce its statistical power and contribute to less stable results, as reflected by its higher AIC and BIC values.
Although the main effects in Model 2 are not individually significant, the NBSR captures several meaningful and statistically significant interaction effects, providing deeper insights into the relationships among variables. Overall, the NBSR demonstrates the best performance in terms of model fit and estimation precision.
A comparison between Model 1 and Model 2 highlights the impact of incorporating interaction terms on model performance and variable significance across the EU, NBSR, and BSR specifications. In terms of model fit, the log-likelihood values for the EU, NBSR, and BSR all increase from Model 1 to Model 2, indicating improved explanatory power in the latter.
Regarding the constant term (C), Model 2 generally yields higher estimates compared to Model 1. In both the EU and NBSR, the constant remains statistically significant, suggesting a stronger baseline level of the dependent variable after accounting for interaction effects. This enhancement of the intercept reflects better model calibration when more complex relationships among variables are included.
Regarding the main variables X1 through X5, Model 1 reveals several significantly negative effects on REER. Specifically, R&D expenditure (X1) in the NBSR significantly deteriorates REER, while green insurance (X4) in both the EU and BSR also shows a significantly negative impact. In contrast, Model 2 shows that the main effects remain statistically insignificant; however, its key strength lies in the inclusion of interaction terms, which capture several statistically significant interactions particularly in the NBSR. For example, the joint effect of R&D expenditure (X1) and FDI (X2), as well as the interaction between FDI (X2) and government environmental protection expenditure (X5), significantly enhance REER in the NBSR specification. These findings suggest that Model 2 uncovers latent interactive relationships between variables that are not detectable in Model 1, underscoring the importance of accounting for interaction effects in complex systems.
From a model fit perspective, Model 2 outperforms Model 1 across the EU, NBSR, and BSR specifications. Notably, in the NBSR, the log-likelihood increases from 4.858 in Model 1 to 18.553 in Model 2, the AIC decreases from 0.057 to −0.041, and the standard error of regression improves from 0.236 to 0.213. Similar improvements are observed in both the EU and BSR. These results confirm that the inclusion of interaction terms enhances the models’ explanatory power and predictive accuracy.
We computed the Variance Inflation Factor (VIF) for all independent and interaction terms in both Model 1 and Model 2. The results are now reported in Table 8. As shown, all VIF values in Model 1 are below the conventional threshold of 10 (Kutner et al., 2005), indicating that multicollinearity is not a serious issue in the model. The slightly higher VIF values in a few interaction terms such as X1X5, X2X4, X2X5, X4X5 in Model 2 remain within acceptable limits, reflecting the inherent correlation between financial variables rather than model instability.
Variance Inflation Factor (VIF) Results.

Note. VIF value <10 indicate acceptable levels of multicollinearity.
Policy Implications
The Tobit regression analysis identifies several financial variables such as R&D investment and green insurance as significant determinants of renewable energy efficiency resilience. Moreover, the joint effects of R&D expenditure with FDI, green insurance, and government environmental protection expenditure, as well as the interactions of FDI and crude oil prices with green insurance, are also found to play a significant role. These results suggest that climate finance allocations under the COP29 framework should prioritize mechanisms that strengthen key financial drivers.
First, countries with high efficiency but greater resilience vulnerability can benefit the most from targeted climate finance, as such funding can reduce systemic risks while consolidating efficiency gains.
Second, the REER and REERV indices derived from our analysis provide evidence-based tools to guide the distribution of climate finance. In particular, the Tobit estimates indicate that financial inflows such as R&D support, green insurance schemes, and their joint effects have statistically significant impacts on enhancing resilience, implying that EU- or global-level climate finance should be directed toward instruments that amplify these effects.
Third, the study offers a clear operational pathway, showing that COP29 climate finance can be strategically deployed to correct resilience asymmetries across countries, thereby ensuring that vulnerable but potentially efficient systems receive adequate financial support for sustainable transitions.
There are the disparities observed between BSR and NBSR countries. The reasons can be understood when examined through the lenses of climate risk exposure, energy mix, and governance structures.
First, BSR countries face relatively higher exposure to climate-related shocks due to their geographic position and strong dependence on imported energy, which amplifies systemic risks and constrains their adaptive capacity.
Second, the energy mix in the BSR remains less diversified, with slower progress in phasing out fossil fuels compared to many NBSR countries. This structural reliance on traditional energy sources reduces resilience to external shocks and limits the ability to consolidate efficiency gains.
Third, governance structures play a critical role: NBSR countries tend to benefit from stronger institutional frameworks and closer alignment with EU-level climate and energy governance mechanisms. These advantages facilitate more effective policy implementation, better integration of financial instruments, and stronger incentives for renewable energy deployment.
Together, these factors provide a clearer explanation for the regional differences in performance, complementing the quantitative evidence presented in the results.
The interaction effects identified in our Tobit regression results provide useful insights for designing integrated financial and innovation strategies at the EU level. The positive role of R&D × FDI suggests that technological innovation is most effective when combined with external capital inflows, underscoring the importance of aligning EU research subsidies with mechanisms that attract foreign investment. Likewise, the interaction between FDI and government expenditure highlights how external funding is reinforced when accompanied by domestic policy commitments, creating a more stable environment for renewable energy projects. Building on these findings, EU policymakers can leverage COP29-aligned instruments to operationalize resilience financing. For instance, green bonds can direct targeted resources toward R&D-intensive renewable projects, while sustainable investment funds provide a platform to pool public and private capital for long-term transitions. In addition, risk-transfer mechanisms such as green insurance schemes or insurance-linked securities can help mitigate the financial vulnerabilities associated with volatile energy prices and climate shocks. Together, these tools offer a practical pathway for EU member states to strengthen renewable energy resilience while ensuring that climate finance allocations are deployed efficiently and equitably.
Conclusion
This study investigates renewable energy efficiency and resilience in the European Union, with a particular focus on global climate risks and financial factors. The analysis distinguishes between the Baltic Sea Region and the non-Baltic Sea Region within the EU. The study aligns with SDG 7 (Affordable and Clean Energy) and SDG 13 (Climate Action), aiming to enhance the sustainability and resilience of energy systems in support of global environmental and economic stability.
From the perspective of climate impetus analysis, the BSR is more strongly affected by climate risk than the NBSR. Renewable energy efficiency in both BSR and NBSR generally declines under climate risk, with the exception of the NBSR in 2018. Climate risk exerts a greater negative impact on renewable energy efficiency in the BSR, while the NBSR consistently exhibits higher resilience in production efficiency. Thus, the influence of climate risk is less pronounced in the NBSR than in the BSR, both in terms of renewable energy efficiency and production efficiency resilience.
In the analysis of factors influencing REER, R&D expenditure alone does not have a positive effect in the EU, NBSR, or BSR. However, its interaction with FDI enhances REER in both the EU and NBSR. In contrast, when combined with green insurance, R&D expenditure leads to a deterioration of REER in the NBSR. Similarly, simultaneous increases in R&D expenditure and government environmental spending negatively impact REER in the NBSR. The interaction between FDI and green insurance also worsens REER in the NBSR, whereas the combination of FDI and government environmental spending improves REER in both the EU and NBSR. Finally, the interaction between crude oil prices and green insurance is associated with improved REER in the BSR.
Compared to Model 1, Model 2 shows improved calibration by including complex interaction terms, revealing latent relationships missed by Model 1 and highlighting the need to consider interactions in modeling complex systems. Although main effects remain weak in both models, Model 2 markedly improves explanatory power and predictive accuracy, especially in the NBSR context. These findings indicate that omitting interaction terms may underestimate key variable dynamics. Future models should incorporate interactions to better capture real-world complexities and improve fit. Further research should also advance resilience indicator development and broaden resilience estimation applications. A limitation of this study is the relatively short analysis period from 2015 to 2019. While this constrains the generalizability of the findings to long-term structural changes, the results nevertheless offer important insights into short- to medium-term efficiency and resilience dynamics during the initial phase of EU climate policy implementation.
Footnotes
Appendix A
This appendix presents a simple worked example to assist readers who are less familiar with efficiency and resilience metrics. We consider three DMUs (A, B, and C) with two-period data, as shown in Table A1.
By following the same steps (1–3), we obtain the computation outcomes of REE, REE′, D values, and REER for period t + 1. The results are presented in Table A3.
The REERV score for DMU A is extremely large due to division by zero. This case should be interpreted as indicating that DMU A exhibits very high vulnerability. For DMU B, the REERV score is 2.750 (=1.000−0.267)/0.267), which implies that its REER increased by 275% from period t to t + 1. For DMU C, the REERV score is −0.657 (=(0.343−1.000)/1.000), indicating that its REER decreased by 65.66%.
Appendix B
EU Countries and Codes by Region.

| Region | Country(Code) |
|---|---|
| BSR | Denmark(DNK), Estonia(EST), Finland(FIN), Germany(DEU), Latvia(LVA), Lithuania(LTU), Poland(POL), Sweden(SWE) |
| NBSR | Austria(AUT), Belgium(BEL), Bulgaria(BGR), Croatia(HRV), France(FRA), Greece(GRC), Hungary(HUN), Ireland(IRL), Italy(ITA), Luxembourg(LUX), Netherlands(NLD), Portugal(PRT), Romania(ROU) Slovenia(SVN), Spain(ESP) |
Note. Data for Cyprus, the Czech Republic, Malta, and Slovakia are excluded due to missing values.
Ethical Considerations
This article does not contain any studies with human or animal participants.
Consent to Participate
There are no human participants in this article and informed consent is not required.
Funding
The authors received no financial support for the research, authorship, and/or publication of this article.
Declaration of Conflicting Interests
The author declared no potential conflicts of interest with respect to the research, authorship, and/or publication of this article.
Data availability Statement
Data sharing not applicable to this article as no datasets were generated or analyzed during the current study.