
Abstract
This study aims to develop and validate a Buyer Platform Experience (PLX) scale focused on the cognitive and relational dimensions of buyer experience in online marketplaces. Adopting a five-stage sequential scale-development methodology, the research combines qualitative interviews with quantitative analyses using SPSS and AMOS. A four-dimensional scale—variety, service excellence, competitive pricing, and promotional effectiveness—was validated through exploratory and confirmatory factor analyses. Structural equation modeling confirmed that variety, service excellence, and competitive pricing significantly predict customer loyalty. The findings isolate cognitive and relational aspects often overlooked in existing customer-experience frameworks and offer practical guidance for platform managers seeking to enhance buyer retention through service quality, price competitiveness, and variety management.
Introduction
Online Platforms and e-Marketplaces
Online marketplaces enable consumers to compare products and prices across sellers, making cognitive and relational experiences central to decision-making.
However, existing studies have typically isolated either cognitive (e.g., assortment cognition) or affective dimensions, leaving the cognitive–relational nexus under-specified. Moreover, prior scales were developed in single-brand or pure-play e-retail settings, limiting their applicability to multi-sided marketplaces. This gap motivates the present study. To contextualize our approach, we first position online marketplaces within the broader category of platforms. Hagiu and Wright (2015) define a platform as “a business that enables direct interactions between affiliated customers.”Rogers (2016) extends this definition as “a business that creates value by facilitating direct interactions between two or more distinct types of customers.” Platforms reduce the costs of search and interaction through matchmaking, audience-building, and friction reduction (Evans & Schmalensee, n.d.).
Online platforms have become one of the most dominant business models in today’s global economy. Defined as digital services that facilitate interactions between distinct but interdependent user groups (OECD, 2019), their rise dates back to the early 2000s with the development of secure online payment systems like PayPal. Since then, advances in logistics, connectivity, and mobile technologies have accelerated platform growth across industries (Hagiu & Wright, 2015; Tiwana et al., 2010). Remarkable examples include mobility services, such as Uber, BlaBlaCar, and Flixbus, which have disrupted the transportation industry (Hein et al., 2019). Moreover, the success of platforms such as Apple’s App Store has given rise to a new demand for users to make use of digital services offered by the emerging app. Google and Microsoft have also introduced their app stores as followers of Apple. Owing to the considerable benefits they bring to the economy and society, the most successful online platforms have attracted hundreds of millions of users, making them among the world’s most visited websites. In the European Union, 76% of EU citizens used online platforms to watch a video or listen to music, 72% made online shopping from platforms, and 70% used social networks at least once. During the Covid-19 period, the use of online platforms increased significantly. As a result, the total value of the top 100 platforms in the world increased to €10.5 trillion in 10 months from January to October 2020 (European Commission, 2019).
As a type of online platform, online marketplaces direct transactions between sellers and buyers, to exchange goods and services. Online marketplaces date back to 1982 when Boston Computer Exchange (BoCoEx) was launched. BoCoEx was a marketplace where electronic trading of used computers took place. The emergence of the first business-to-consumer and consumer-to-consumer marketplaces took place in 1995. In 1995, eBay, a global online auction and trading company launched by American entrepreneur Pierre Omidyar, was one of the first companies to create and market an Internet website to match buyers and sellers of goods and services. In the same year, Jeff Bezos launched Amazon, which served as an online book marketplace. Today, an increasing number of consumers participate in e-commerce via online marketplaces that connect buyers with third-party sellers, drawn by advantages such as user-friendly search and payment systems, as well as a wide variety of products and sellers to choose among. Total retail e-commerce sales are expected to reach $7,528 trillion in 2025, compared to $5,211 trillion in 2021, with an increase of 44.5% and it is also estimated that by 2026, world online shopping could exceed $8 trillion, accounting for almost one quarter (24%) of all consumer spending on Earth (Cramer-Flood, 2022). In the last few years, statistics and future expectations regarding online marketplaces have been reviewed, and even more remarkable figures have been encountered. By 2027, third-party sales through online marketplaces are expected to account for 59% of all global e-commerce, up from 56% in 2022 (Edge by Ascential, 2022). To illustrate the relative scale of the leading marketplaces, the Gross Merchandise Volume (GMV) is approximately $693 billion for Amazon, $617 billion for Taobao, and $597 billion for Tmall (eCommerceDB, 2022).
Understanding the Experience Construct
Customer experience has multiple, yet converging, definitions in the literature. Schmitt (1999) takes a multidimensional view and identifies five types of experiences: sensory (sense), affective(feel), cognitive (think), physical (act), and social-identity (relate) experiences. Customer experience is defined by Shaw and Ivens (2002) as the outcome of interactions between the customer and an organization which is composed of physical performance, senses, and emotions evoked. Verhoef et al. (2009) underline the holistic nature of customer experience which involves cognitive, affective, social, and physical responses of consumers towards the organization or brand. Bagdare and Jain (2013) explained customer experience as the totality of cognitive, affective, sensorial, and behavioral responses generated during the buying process as a result of interactions made between customers and organizations’ environments, objects, and people. Similarly, Lemon and Verhoef (2016) defined customer experience as “a multidimensional construct focusing on a customer’s cognitive, emotional, behavioral, sensorial, and social responses to a firm’s offerings during the customer’s entire purchase journey.” They proposed that to further understand the customer experience construct, it is crucial to differentiate it from other customer-focused constructs such as customer satisfaction, service quality, trust, commitment, and customer engagement. Customer satisfaction could be a component of the customer experience, focusing on cognitive evaluation (Lemon & Verhoef, 2016), whereas service quality is an antecedent (Mittal et al., 1999). Trust and commitment, key constructs in relationship marketing, are related to customer experience but play consequential rather than definitional roles. Commitment is a consequence of customer experience (Lemon & Verhoef, 2016), and trust is a state variable that may indirectly influence customer experience (Geyskens et al., 1998). Customer experience is different from brand-focused concepts such as brand involvement and brand attachment (Brakus et al., 2009). A concise narrative comparison underscores PLX’s marketplace-specific focus. The Brand-Experience scale (Brakus et al., 2009) emphasizes sensory and affective reactions (e.g., “This brand makes a strong impression on my visual sense or other senses”) without gauging assortment or price perceptions. The Online Engagement scale (Paruthi & Kaur, 2017) highlights social connection (e.g., “I love accessing X with my friends”) yet omits evaluations of variety breadth or competitive pricing. Likewise, the Consumer Brand Engagement scale (Hollebeek et al., 2014) taps behavioral activation (e.g., “I spend a lot of time interacting with the brand”) but offers no coverage of promotion effectiveness or service excellence. Collectively, these contrasts underline the research gap that the Buyer-PLX scale fills: a simultaneous appraisal of marketplace-level economic cues (variety, competitive pricing) and relational assurances (service excellence), yet they remain silent on the deeper cognitive–motivational mechanisms at play in two-sided marketplaces.
Building on this gap, prior experience measures still overlook the joint role of appraisal, motivation, and reciprocity in multi-seller contexts. Recent evidence shows that discrete appraisal dimensions trigger high-arousal consumer emotions such as delight (Gao et al., 2013) and that outcome desirability, agency, fairness, and certainty guide decision making (Watson & Spence, 2007). Complementing this evaluative lens, Self-Determination Theory demonstrates that autonomy, competence, and relatedness shape online satisfaction and help segment digital consumers (Appolloni et al., 2023; Tandon & Ertz, 2022). Finally, Social-Exchange Theory explains how perceived benefits versus costs govern trust and continuous participation in e-commerce settings (Koç & Çevik, 2022; Wang et al., 2024). Taken together, these findings justify the development of a Buyer-PLX scale that explicitly models (a) cognitive appraisal of platform cues, (b) intrinsic–extrinsic motivation fulfilment, and (c) perceived reciprocity in buyer–seller interactions.
Prior experience measures overlook the joint role of appraisal, motivation, and reciprocity in two-sided marketplaces. Recent evidence shows that discrete appraisal dimensions trigger high-arousal consumer emotions (e.g., delight) (Gao et al., 2013) and that outcome desirability, agency, fairness, and certainty guide decision making (Watson & Spence, 2007). Complementing this evaluative lens, Self-Determination Theory demonstrates that autonomy, competence, and relatedness shape online satisfaction and segment digital consumers (Appolloni et al., 2023; Tandon & Ertz, 2022). Finally, Social-Exchange Theory explains how perceived benefits versus costs govern trust and continuous participation in e-commerce settings (Koç & Çevik, 2022; Wang et al., 2024). Taken together, these findings justify the development of a Buyer-PLX scale that explicitly models (a) cognitive appraisal of platform cues, (b) intrinsic–extrinsic motivation fulfilment, and (c) perceived reciprocity in buyer–seller interactions.
Customer experience is a dynamic and iterative process that unfolds across various stages of a customer’s journey with a firm, from pre-purchase to purchase and post-purchase. It incorporates past experiences, including prior purchases, and external factors that influence customer decisions (Lemon & Verhoef, 2016). The pre-purchase stage encompasses the customer’s experience from the beginning of need/goal/impulse recognition to consider satisfying the need/goal/impulse with a purchase (Hoyer, 1984; Pieters et al., 1995). The purchase stage covers all customer interactions with the brand during an actual purchase event and is characterized by behaviors such as choice, ordering, and payment (Baker et al., 1994; Ofir & Simonson, 2007). The post-purchase stage includes behaviors such as usage and consumption, post-purchase engagement, and service requests, and covers aspects of the customer’s experience after purchase that relate in some way to the brand or product/service itself (Lemon & Verhoef, 2016). Lemon and Verhoef (2016) identified four categories of customer experience touchpoints within the customer journey: (a) brand-owned, including advertising, websites, loyalty programs, and other brand-controlled elements; (b) partner-owned, involving marketing agencies, distribution partners, and communication channel partners; (c) customer-owned, such as customers’ own needs in the pre-purchase phase or their choice of payment method during purchase; and (d) social/external touchpoints, encompassing other customers, peer influences, independent information sources, and environments. Becker and Jaakkola (2020) conducted a systematic review of 136 articles on customer experience and defined it as non-deliberate, spontaneous responses, and reactions to stimuli. They identified four fundamental premises that apply across settings and contexts: (a) customer experience involves customers’ spontaneous responses to offering-related stimuli throughout the journey, which can range from ordinary to extraordinary in intensity; (b) these stimuli can be found within and outside firm-controlled touchpoints and are interconnected, affecting customer experience dynamically; (c) customer experience is subjective and context-specific because of its dependence on customer, situational, and sociocultural contingencies; and (d) while firms cannot create customer experiences, they can monitor, design, and manage a range of stimuli that affect such experiences. These premises serve as guidelines for future research related to the customer experience. To clarify how methodological choices shape our understanding of platform experience, Table 1 contrasts seminal offline, online, and omni-channel studies and highlights where their constructs and findings converge or diverge.
Cross-Channel Comperative Review of Customer Experience Studies.

Note. AES = Affective Experiential States; CES = Cognitive Experiential States; fsQCA = Fuzzy-set Qualitative Comparative Analysis; OCE = Online Customer Experience; OSE = Online Shopping Experience; PAD = Pleasure-Arousal-Dominance emotion model; PLS-SEM = Partial Least Squares Structural Equation Modelling; SEM = Structural Equation Modelling; TCCM = Theory-Context-Characteristics-Method. Bold terms in the “Salient findings” column indicate the focal theoretical construct(s) or named framework(s) introduced or explicitly validated in each study (e.g., Strategic Experiential Modules; Flow; OSE; CES; AES; high-task vs low-task).
The contrasts in Table 1 reveal that experiential dimensions migrate from sensory-affective roots to cognitive-relational dominance as channels digitize, setting the stage for the determinant-and-outcome relationships we examine next. As this research focuses on buyer experiences in online marketplaces, it is also important to mention the online customer experience construct. Online customer experience, a prevailing theme in the literature, has been assigned various names and definitions in recent scholarly work, such as online customer experience (OCE), online customer service experience (OCSE), and online shopping experience (OSE). Rose et al. (2012) employed the term online customer experience (OCE), defining it as “a psychological state that manifests as a subjective response to an e-retailer’s website.” Drawing on prior research, they posited that customer experience encompasses two psychological states: the cognitive experiential state (CES), which reflects the mental processing of the customer while utilizing a website; and the affective experiential state (AES), which pertains to the emotions or feelings encountered during website usage. Trevinal and Stenger (2014) used the term online shopping experience (OSE) and defined it is a holistic and subjective process resulting from interactions between consumers, shopping practices and the online environment. Klaus (2013) employed the term online customer service experience (OCSE) and defined it as the comprehensive mental perception of customers as they interact with an online service provider and other customers, encompassing the dimensions of functionality and psychological factors. Bleier et al. (2019) used the term online customer experience (OCE) and defined it as a customer’s personal and psychological response to a product’s presentation online and conceptualized it as a multifaceted construct encompassing four dimensions: informativeness (cognitive), entertainment (affective), social presence (social), and sensory appeal (sensory). The review of the online customer experience literature shows that early work primarily emphasized the cognitive dimension (Novak et al., 2000), a combination of cognitive and affective dimensions (Liu et al., 2008) and cognitive, affective, social and sensory dimensions (Bleier et al., 2019).
Relational experience captures the buyer’s evaluation of the quality of interpersonal and service interactions with the marketplace and its sellers—manifested in responsiveness, fairness, problem resolution and trust. This definition is conceptually distinct from the interface-driven sense of human presence often labelled as “social experience” (Bleier et al., 2019).
Recent cross-disciplinary work clarifies how distinct cognitive and relational facets of experience unfold in digital marketplaces. Psychology scholarship frames cognitive states as mental simulations triggered by stimuli such as telepresence or information richness, fostering utilitarian appraisals and perceived control (Novak Hoffman, & Yung, 2000) . In contrast, marketing-channel research positions relational states—built on trust and reciprocity norms—as antecedents of durable loyalty (Geyskens et al., 1998). Online-retail studies frequently integrate functional and social cues into a single holistic “online shopping experience” construct (Liu et al., 2008). Conversely, two-factor frameworks—most notably Rose et al. (2012), which distinguishes a Cognitive Experiential State from an Affective Experiential State—underscore the analytical value of separating utilitarian-cognitive from relational-affective cues. Building on this insight, the present study deliberately models variety and competitive pricing as cognitive triggers, while service excellence operates as a relational catalyst, thereby extending the separation to marketplace-specific drivers.
Determinants and Outputs of Online Customer Experience
Building on the offline–online contrasts summarized in Table 1, high-task cues such as security and informativeness—classified as cognitive facilitators in Koronaki et al.’s (2023) review—are consistently associated with cognitive-oriented outcomes such as satisfaction across markets (see Liu et al., 2008; Pandey & Chawla, 2018). Conversely, low-task cues such as aesthetics and social presence amplify Affective Experiential States (AES), a pattern replicated under different research designs (Bleier et al., 2019; Chang et al., 2014). Koronaki et al. (2023) further refine this distinction by positioning convenience, effectiveness, and security as high-task atmospheric cues, and entertainment, responsiveness, and interactivity as low-task cues. In their synthesis, these authors show that high-task cues strengthen the CES → satisfaction path, whereas low-task cues magnify the AES → trust effect, thereby delineating boundary conditions for our PLX model.
Building on this cue-based view, buyer experiences in online marketplaces are influenced by a multitude of factors that collectively shape customer satisfaction and loyalty. Rose et al. (2011) list the determinants of buyer experience as information processing, perceived ease of use, perceived usefulness, perceived benefit, perceived control, skill, trust propensity, perceived risk, and enjoyment. They found that the outputs of the experience were customer satisfaction and repurchase intention. Gulfraz et al. (2022) investigated the relationship between online customer shopping experience and online impulsive buying behavior. They found that impulsive online buying behavior is affected by online buyers’ experience, which is formed by the functionality components of a platform, including interactivity, informativeness, visual engagement, navigation, and search ease, as well as the psychological components of that platform, including trust, convenience, and enjoyment. They also found a mediating role for customers’ attitudinal loyalty and a negative moderation of customers’ self-control on online impulsive buying. Rose et al. (2012) stated that online customer experience is composed of cognitive experiential states (CES) and affective experiential states (AES). They identified, connectedness, customization, and ease of use as antecedents of AES which are mediated by perceived control. On the other hand, challenge and telepresence are found in the antecedents of CES. According to their research, the outcomes of online customer experience are online shopping satisfaction, trust, and repurchase intention, with online shopping satisfaction being a critical mediator between (CES) and (AES), and repurchase intention. Building on the research conducted by Rose et al. (2012), and Martin et al. (2015) extended the understanding of the antecedents and outcomes of online customer experience in the e-retailing context. Their study incorporated the perceived risk as an additional outcome variable. The other outcome variables tested were online shopping satisfaction, trust, and online purchase intention. The study revealed that ease of use and customization are factors affecting perceived control. Connectedness, however, was not significant, unlike the study conducted by Rose et al. (2012). Aesthetics and perceived benefits were found significant factors affecting AES directly. In addition, results included that challenge are insignificant for CES and telepresence inversely affecting CES. The findings also emphasize the role of perceived risk in online shopping as consumers balance trust and risk during the purchasing process. Koronaki et al. (2023) conducted an extensive systematic literature review to analyze determinants and outcomes of the online customer experience. The determinants were grouped into site atmospheric cues, including high task-relevant cues such as convenience, effectiveness, informativeness, security, and usability, and low task-relevant cues such as site entertainment, responsiveness, social aspects, and interactivity, and site interface features such as interactive technologies, design elements, interface with functional control, and content vividness. Their study examined the outcomes of customer experience including purchase intention, word-of-mouth, attitudes toward the website, satisfaction, trust, and loyalty. Pham and Ahammad (2017) found that customer satisfaction is influenced by customer experience factors such as product information, ease of use, customization, ease of checkout, security assurance, order fulfillment, ease of return, and responsiveness to customer service. Satisfied customers tended to return and spread positive word of mouth. In other words, this study claims that the outcome of online customer experience is customer satisfaction, which also gives rise to responses such as repurchase intention and word-of-mouth. van Noort et al. (2012) found that interactivity is an online customer experience factor that shapes consumer behavior and response by fostering an immersive environment on brand websites, enhancing flow experience, and facilitating product understanding while minimizing attention to irrelevant elements, consequently leading to positive attitudes towards websites and brands and increased website revisits, recommendations, and shop intentions. Bleier et al. (2019) explored the impact of 13 design elements, including linguistic style, descriptive product detail, bulleted product features, return policy information, product feature crops, lifestyle photos, photo sizes, product videos, customer star ratings, expert endorsement, comparison matrix, recommendation agent, and content filter, on online customer experience and their influence on purchases. Their study, which is conducted across 16 experiments, revealed that product (search vs. experience) and brand (trustworthiness) characteristics can either exacerbate or mitigate online shopping uncertainty, thus moderating the effect of each experience dimension on customer purchase. A field experiment on real Amazon product pages further supported these findings. Micu et al. (2019) investigated the role of online customer experience in e-commerce by examining the moderating effects of cognitive and affective experiential states on the relationships between perceived value, satisfaction, trust, and online repurchase intention. The empirical results of their study support these predictions, showing that online customer experience with the mediation of satisfaction, perceived value of visiting experience, and trust, lead to online repurchase intention. In the study conducted by Liu et al. (2008), researchers investigated the effect of certain determinants of online shopping experience such as prompt delivery, responsive customer service, comprehensive product information, diverse product offerings, competitive pricing, enjoyable web design, and secure transactions on customer satisfaction through a holistic perspective. They found that these determinants of the online shopping experience affect customer satisfaction, which can ultimately lead to higher customer loyalty, continuous shopping intentions, and positive word-of-mouth, benefiting online retailers in the long run. Cachero-Martínez and Vázquez-Casielles (2021) identified key determinants of online customer experience, which play a vital role in shaping customer behavior and loyalty. In their study, the visual experiences that refer to the overall design of the website, such as its attractiveness, content organization, and the absence of unwanted ads or links, as well as language accessibility; intellectual experiences, such as the website’s accessibility, download speed, ease of use, and the presence of updated and relevant information that stimulates creativity; social experiences, such as the ability to access social networks, the website’s reputation on social media, and the provision of trend information that aligns with customers’ attitudes and lifestyles and pragmatic experiences, such as the quality and price of products, the level of service provided, attractive promotions, and the consistent stock availability of promotional products; and emotional experiences, such as happiness, excitement, entertainment, encouragement, and surprise, are listed as the determinants of online customer experience. They also found that these determinants of online customer experience affect customers’ emotional states, which in turn improve customer loyalty. Hausman and Siekpe (2009) conducted a comprehensive investigation of the role of human and computer factors as determinants of online customer experiences in the context of web interface design. The human factors considered included appeal, brand, color, enjoyment, entertainment, graphics, and humor. The computer factors examined were accessibility, ease of use, efficiency, informativeness, layout, links, navigation, organization, performance, reliability, responsiveness, search capabilities, security, usefulness, and visual clarity. These determinants of online customer experiences contribute to the formation of intermediary outcomes, such as attitude toward the site and the flow state experienced by users. These intermediary outcomes were found to significantly influence more critical outcomes, namely purchase intention and intention to return. Hsieh et al. (2014) examined the role of web atmospheric cues on customer emotions and purchase intentions. The study focused on the Pleasure–Arousal–Dominance (PAD) model as revisited by Bakker et al. (2014) and investigated the effect of determinants of online customer experience, including informativeness, navigational cues, perceived organization, and entertainment on perceived dominance and arousal. The findings suggest that perceived dominance has a direct impact on purchase intention and an indirect effect through pleasure. High task-relevant cues significantly influenced perceived dominance, whereas low task-relevant cues affected arousal. Chang et al. (2014) researched to determine the influence of web aesthetics, which consists of two dimensions—aesthetic formality and aesthetic appeal—as well as emotional models on online purchasing behaviors. These factors were considered antecedents of the online shopping experience. The study discovered that aesthetic formality, encompassing website layout, readability, and simplistic style (Lavie & Tractinsky, 2004; Schenkman & Jönsson, 2000; Wang et al., 2011), and aesthetic appeal significantly affect users’ sense of control, resulting in enhanced pleasure while browsing online retail websites. Conversely, aesthetic appeal refers to the extent of pleasure and enjoyment that users derive from a website, which is a reflection of the enjoyment, attraction, and entertaining properties of website design (Lavie & Tractinsky, 2004; Schenkman & Jönsson, 2000). The researchers concluded that both pleasure and searching on other websites positively influence purchase behavior, with pleasure exerting a more substantial impact.
Recent omni-channel evidence (Gulfraz et al., 2022) demonstrates that platform experience influences impulsive buying indirectly via attitudinal loyalty and that this pathway weakens under high self-control. We therefore treat impulsivity as a contingent—rather than universal—behavioral outcome within our theoretical network of relationships.
Aim of This Study
This study pursues three interrelated aims: (a) to conceptualize cognitive and relational buyer experience within multi-seller online marketplaces; (b) to develop and validate a parsimonious Buyer Platform Experience (PLX) scale that captures these dimensions; and (c) to examine their differential effects on customer loyalty. By addressing these aims, we contribute (a) a construct definition grounded in platform theory, (b) a rigorously validated four-factor scale useful to scholars and practitioners, and (c) empirical evidence linking distinct experience facets to behavioral outcomes. These contributions frame the analyses that follow.
Method
PLX Scale Development Methodology
To develop a valid and reliable PLX scale used for measuring the platform experience of buyers as a result of their interactions and transactions with and within the marketplace, several stages of the scale development process were implemented. The stages followed in this study were borrowed from the procedures employed by the previous studies in the literature (Churchill, 1979; Hollebeek et al., 2014; Netemeyer et al., 2003). The overall scale development process consists of five stages including two qualitative studies used to generate the construct and dimension definitions, the generation of items using expert reviews, and three quantitative studies used for scale refinement, calibration, and validation processes. The stages of the scale development process are explained in Table 2.
Scale Development Process and Stages.

(Study 1: Conceptual Development of PLX Construct and Dimensions)
The first stage of the PLX scale development and validation process is the conceptual development of the PLX construct and the identification of its sub-dimensions. Primarily exposed parties in the context of PLX are the buyers who interact with and within these e-marketplaces. Surveys were distributed via two convenience channels: (a) university e-mail lists and (b) LinkedIn groups of e-commerce enthusiasts. Table 5 reports the sample’s gender- and age-group composition; nevertheless, convenience sampling may limit external validity. Future studies should adopt probability-based sampling to improve generalizability.
This stage of the scale development process, Study 1, is divided into two parts. In the first part, we conducted 40 semi-structured interviews with experienced online-marketplace buyers. Participants are asked to define the PLX in the context of e-marketplaces and to list the underlying dimensions of the PLX construct in e-marketplaces. The definition of PLX construct was collected by asking the question “How do you define the concept of buyer experience in this e-marketplace?” Following this question, participants are asked to answer the question “Based on your previous experiences, what type of factors affect customer experience in e-marketplaces? Please rank at least five factors from highest importance to lowest importance.” Neutral clarification probes (e.g., ‘Could you give an example?’) were used when necessary; no leading or double-barreled questions were included. Factor lists were then standardized for categorization and ranking-score calculation. Listings of the participants generated nine groups of factors including Service Quality, Product Variety, Promotions, Competitive Pricing, Seller Variety, Ease of Shopping, Security, Return Policy, and other factors including platform standards applied, content, and privacy. Table 3 includes the factors listed by the participants and their respective ranking counts based on the feedback provided by all participants.
Buyers’ Platform Experience (PLX) Dimensions and Rankings.
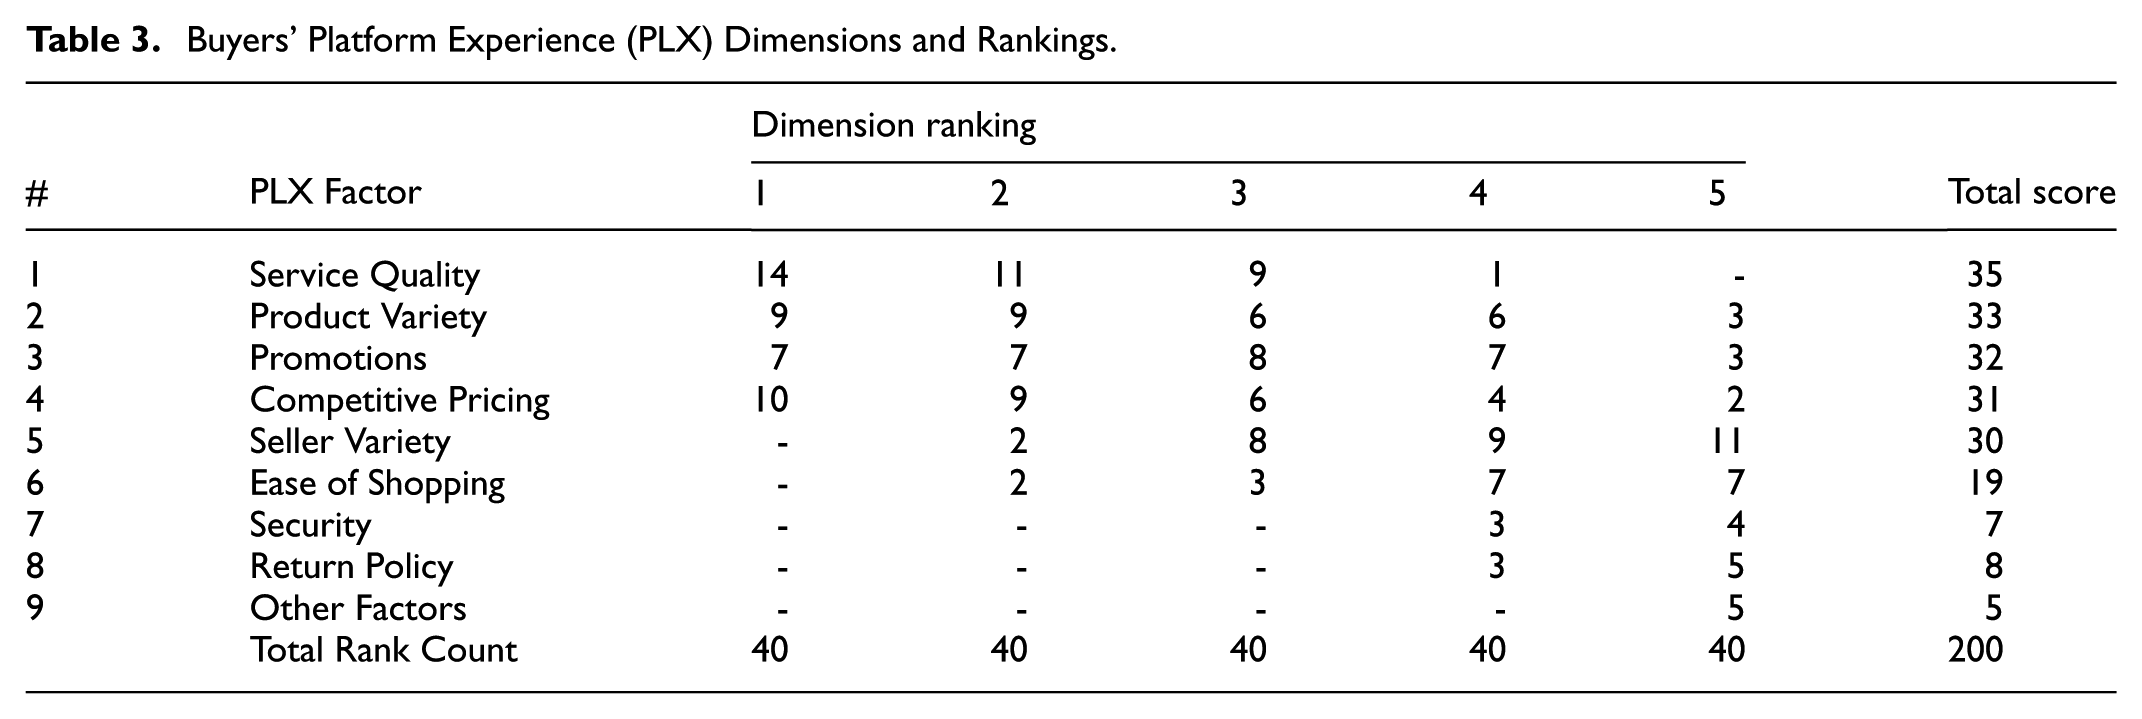
As a result of Study 1, the Cognitive and Relational PLX construct for buyers in the e-marketplace is defined as “The overall cognitive and relational perceptions of the buyer as a result of interactions, communications, and transactions with and within the e-marketplace which collectively lead to cognitive and behavioral outcomes.” The top five dimensions of cognitive and relational buyer PLX construct were identified based on the participant ranking scores 30 and above as well as the extensive literature review on customer experience. The dimensions and respective definitions of each dimension are provided in Table 4.
Buyer Platform Experience (PLX) Dimensions and Definitions.

(Study 2: Generation and Confirmation of Scale Dimension Items)
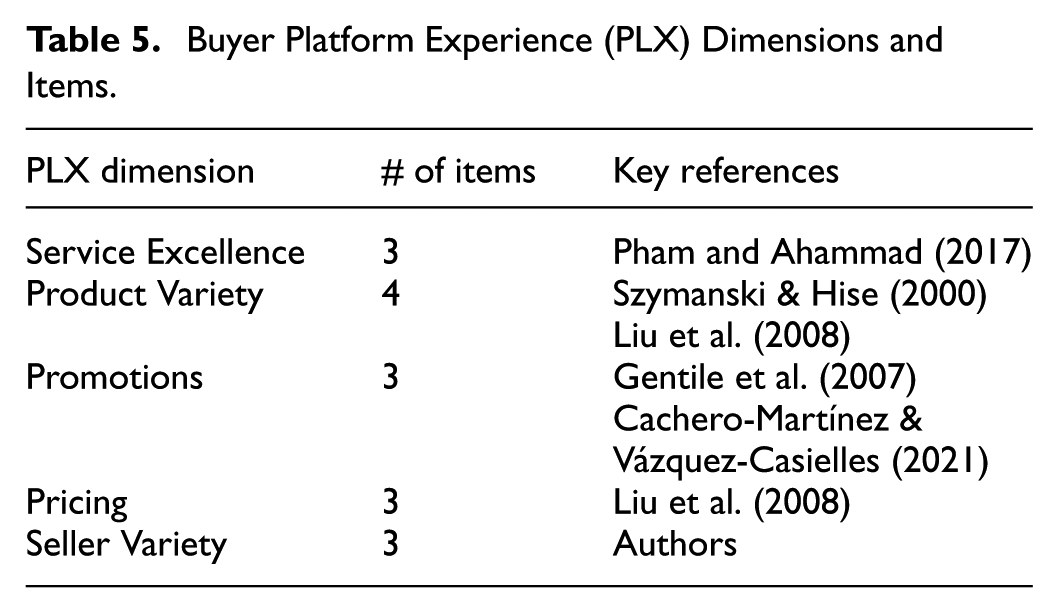
The second stage of PLX scale development process involves the generation and confirmation of items under each dimension which were identified at the first stage of the study. Following an intensive review of the existing literature on customer experience, scale items for each of the five dimensions of buyer experience were identified. The summary information regarding the items employed under the buyer experience dimension is provided in Table 5.
Buyer Platform Experience (PLX) Dimensions and Items.
To enhance methodological transparency, we specify the item-generation procedure. Drawing on the five PLX dimensions identified in Study 1, an initial wording pool was created by adapting statements from established customer-experience scales cited in Table 4 (e.g., Szymanski & Hise; Liu et al.; Pham & Ahammad) and rephrasing them to the marketplace context. Each candidate statement then underwent content- and face-validity evaluation by academic and practitioner experts, consistent with the procedures outlined by Churchill (1979). Items meeting consensus for relevance and clarity formed the 16-item Buyer-PLX pool used in subsequent pilot testing and validation. Content validity was established through an expert-panel review and iterative cognitive interviews conducted before any statistical testing.
Sampling and Data Collection
The exploratory (EFA) and confirmatory (CFA) phases drew on distinct, non-overlapping participant pools recruited via separate channels. As a result of Studies 1 and 2, the buyer PLX scale composed of five dimensions, including 16 items was generated for the testing, confirmation, and validation processes. The sampling unit formed to conduct the dimensionality tests, reliability analysis, and validation of the scale was composed of shoppers who regularly visit and shop from e-marketplaces in the Turkish market. Respondents were asked to fill out an online questionnaire which was distributed through the Survey Monkey data collection tool. The sampling methodology employed was convenience sampling where authors distributed the questionnaire links through their personal and academic network. The questionnaire link is sent to 835 respondents and 182 responses were collected. The written informed consent of the participants related to the participation and processing of information was acquired. As a result of cleaning incomplete responses and outliers, a total of 139 valid responses were obtained. The composition of the sample employed with valid responses is outlined in Table 6. Demographic information (age, gender) was collected to describe the sample and assess representativeness. Consistent with scale-development guidelines that prioritize parsimony during initial validation (Boateng et al., 2018), these variables were not entered as covariates in the structural equation model.
Buyer Platform Experience (PLX) Sample Composition.

Ethical Considerations
The data for this study were collected via an anonymous online survey that included questions about general shopping habits and demographic characteristics. No sensitive or identifiable personal data were gathered. Participation was fully voluntary, and respondents were informed about the academic nature and purpose of the study. In accordance with institutional and national research ethics policies, formal ethical approval was not required.
All participants provided written informed consent prior to participation. The consent process explicitly informed participants that: (a) their responses would remain completely anonymous, (b) no identifiable personal information would be collected, (c) participation was voluntary with the right to withdraw at any time, and (d) the data would be used solely for academic research purposes.
The study design limited risk to participants by ensuring complete anonymity, collecting only non-sensitive data regarding shopping perceptions and experiences, and avoiding any questions related to personal finances, health, or other sensitive topics. These measures ensured that participation posed minimal risk while contributing valuable insights to academic understanding of e-commerce platform experiences.
The research protocol prioritized participant welfare while gathering data that contributes to both academic knowledge and practical improvements in digital marketplace design. The potential benefits to society—including enhanced understanding of buyer behavior and improved platform experiences— substantially outweigh the minimal time commitment required for survey participation. In accordance with institutional and national research ethics policies, formal ethical board approval was not required for this type of anonymous, non-invasive survey research involving adults and non-sensitive topics.
Results
(Study 3: Scale Testings of Buyer PLX)
The third stage of the PLX scale development process involves the testing and validation of the scale. In the testing stage, the dimensionality of the scale and the reliability checks for each dimension of the scale were completed. To start the process, first, the data set for the scale was checked for sampling adequacy as well as significance by conducting Kaiser-Meyer-Olkin (KMO) and Barlett Test of Sphericity tests. Following the confirmative results of both tests, dimensionality for the scale was tested through the Exploratory Factor Analysis (EFA) technique to obtain the initial factor structure. Modifications were also made to the initial factor structure for the scale at this stage before proceeding to the confirmation of the scale. Following the testing process, the factor structure was confirmed, and the model was validated through the employment of Confirmatory Factor Analysis (CFA) using SPSS AMOS 29.
Items with primary factor loadings ≥ .50 and cross-loadings < .30 were retained, following established scale-development guidelines (Netemeyer et al., 2003; Churchill, 1979). Missing data were handled via listwise deletion because incomplete questionnaires were removed during data cleaning, leaving no systematic missingness. The final four-factor solution satisfied commonly accepted fit thresholds (CFI ≥ .90, IFI ≥ .90, RMSEA ≤ .08) as recommended by Anderson and Gerbing (1988, pp. 411–413) and Byrne (2013, p. 45). Minor deviations did not warrant re-specification because they are theoretically consistent with the platform-experience framework and preserve model parsimony. To avoid unnecessary complexity in the main text, the complete loading matrix and full set of model-fit statistics are available from the authors upon reasonable request.
The results of KMO (.876) and Barlett Test of Sphericity tests (x2 = 1.383,572, df = 120, p<.001) confirmed the adequacy of the data to proceed with the dimensionality tests. In the next step, the Exploratory Factor Analysis (EFA) technique is conducted to test the dimensionality, generate the initial factor structure, make the necessary adjustments, and confirm the reliability of each factor in the scale. To do this, the data set is analyzed through Principal Component Analysis (PCA) employing the Varimax rotation method with Kaiser Normalization to improve interpretability (Anderson & Gerbing, 1988). The original number of dimensions included in the analysis was five and the results yielded four factors where Seller Variety and Offer Variety merged into a single dimension called “Variety.” Following the elimination of factor items with low loadings under each factor, the EFA was completed with four factors and 13 measurement items. The four factors represented 78.15% of the total variance. While prior work defines online assortment breadth mainly in terms of the sheer number of products available (e.g., Liu et al., 2008), our qualitative pre-study revealed that buyers intuitively fuse product abundance and seller abundance into one holistic cue. We therefore relabeled the construct Variety to reflect this integrative perception, positioning the merge as a novel conceptual extension beyond extant definitions. The results of the PCA are presented in the following Table 7.
Results of EFA and Reliability Checks.

(Study 4: Scale Confirmations of Buyer PLX)
In the fourth stage of the study, the construct validity of the scale was tested and confirmed through the employment of the Confirmatory Factor Analysis (CFA) as suggested by Anderson and Gerbing (1988). CFA was conducted with the inclusion of 4 factors and 13 measurement items, which were generated as a result of the EFA conducted in the third section of this study. CFA analysis was conducted by employing SPSS AMOS 29 software. As suggested in the relevant literature by Bagozzi and Yi (1990), to confirm the construct validity, the Comparative Fit Index (CFI) and Incremental Fit Index (IFI) should be above 0.9 level while CMIN/DF ratio below the level of 3 and RMSEA below 0.10 are regarded as satisfactory levels. Based on the mentioned thresholds of fit indices, the results of the analysis confirmed the construct validity of the PLX scale (χ2/DF =1.034, CFI=0.998, IFI=0.998, RMSEA= 0.016). The graphical representation of the PLX scale factors as well as measurement items under each factor together with the satisfactory intra-factor loadings above .50 level are presented in Figure 1.
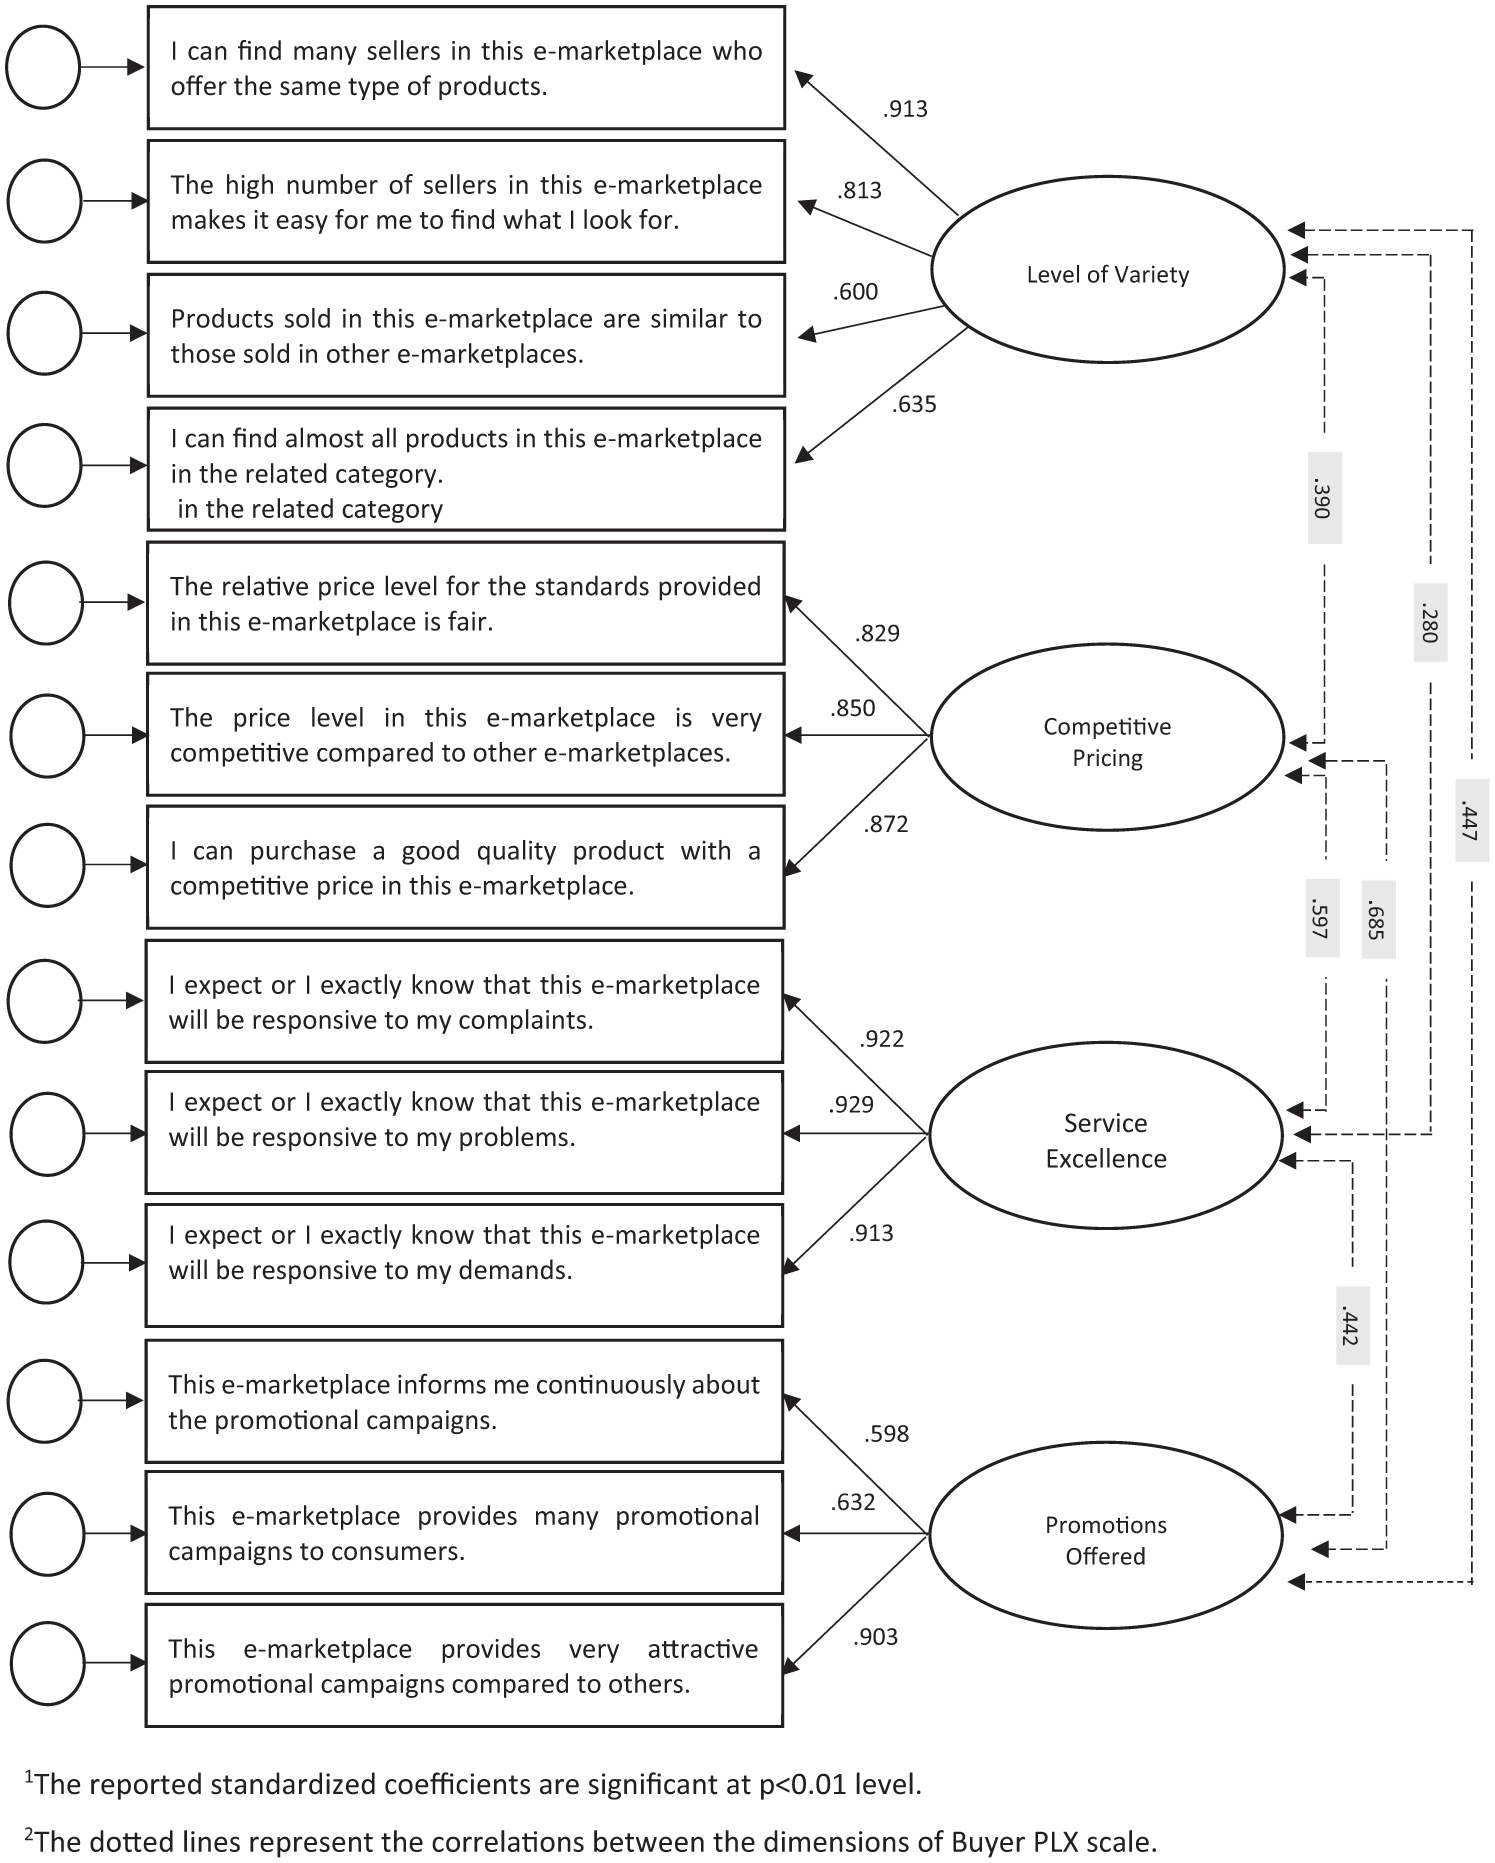
Results of the confirmatory factor analysis.
Following the confirmation of the construct validity, additional validity and reliability checks for the PLX scale are completed to confirm the convergent validity, discriminant validity, composite reliability, and internal factor reliabilities. Average Variance Extracted (AVE) scores are calculated for each factor to test the convergent validity of the scale. All AVE scores were above the minimum required score level of 0.50 as suggested by Byrne (2013) and this result confirmed the convergent validity of the scale. To test the discriminant validity, the square roots of each AVE score are calculated and these scores are compared with the correlation of that factor with other factors in the Buyer PLX scale. The result of the comparison showed that there is no higher level of correlation score than the corresponding square root AVE score. This result confirmed the discriminant validity of the PLX scale as suggested in the relevant literature (Civelek, 2018). The composite reliability, as well as internal reliability (Cronbach’s alpha) scores for each factor, are calculated and all the scores generated were above the 0.70 minimum threshold, confirming the composite reliability as well as internal reliability as suggested by Fornell and Larcker (1981). The results of the validity and reliability checks are presented in Table 8.
Buyer PLX Scale Validity and Reliability Checks.

Correlation is significant at the .01 level (2-tailed).
Diagonals show the square roots of AVE scores.
All Composite Reliability (CR) values exceeded the 0.70 benchmark, every Average Variance Extracted (AVE) value surpassed 0.50, and the square-root-of-AVE for each construct was higher than its inter-construct correlations, confirming convergent and discriminant validity (Byrne, 2013; Fornell & Larcker, 1981).
Convergent validity is supported because each construct’s Average Variance Extracted exceeds the recommended threshold, and Composite Reliability values are satisfactory (Byrne, 2013 [Chap. 8]; Fornell & Larcker, 1981 [p. 45]). Discriminant validity is confirmed via the Fornell–Larcker test, as every square-root AVE is greater than the corresponding inter-construct correlations.
(Study 5: Scale Validation of Buyer PLX)
To evaluate the Buyer PLX scale and confirm its theoretical relationship validity, we built a structural model to test how Buyer Platform Experience (PLX) influences customer loyalty. Previous research on the literature confirms the impact of experiences on customer loyalty. In their study, Manyanga et al. (2022) measured the effect of customer experience on customer loyalty in the banking industry and reported significant and positive effects. Molinillo et al. (2022) investigated the impact of customer experience and its sub-dimensions on the satisfaction and loyalty of users in the retail app context. The authors reported a significant effect of customer experience dimensions. Other studies also investigated the effect of customer experience in the retailing context (Bleier et al., 2019; Pandey & Chawla, 2018; Pekovic & Rolland, 2020). In light of the previous studies, it is believed that the four dimensions of the Buyer PLX scale, namely Level of Variety, Competitive Pricing, Service Excellence, and Promotions Offered, will have an impact on customer loyalty. Building on the theoretical foundation established above and supported by recent empirical evidence across multiple e-commerce contexts, we propose the following hypotheses.
Product variety represents the breadth and depth of merchandise offerings available on e-commerce platforms. In digital marketplaces, extensive assortments reduce search costs and increase purchase convenience (Szymanski & Hise, 2000). Evidence from Chinese e-commerce platforms confirms that wider merchandise variety positively impacts satisfaction, subsequently driving loyalty (Liu et al., 2008). Greater variety enhances perceived value by offering consumers options matching their preferences, thereby reducing opportunity costs and increasing platform commitment. In this study, the variety dimension was empirically found to be a unified construct, combining product offerings (merchandise breadth) and the number of sellers providing these offerings, reflecting buyers’ holistic evaluation of assortment abundance in multi-sided platforms.
Competitive pricing perception captures buyers’ evaluation of price competitiveness relative to alternative platforms. In transparent e-commerce contexts where consumers readily compare costs, competitive pricing significantly predicts satisfaction and loyalty (Liu et al., 2008). Cross-industry evidence demonstrates that pricing perceptions influence loyalty both directly and indirectly through satisfaction, with this relationship validated across freight forwarding (Risnawati et al., 2019), hospitality (Saputra & Djumarno, 2021), and airline contexts (Setiawan et al., 2021). Price fairness research further demonstrates that competitive pricing—perceived as distributive fairness—directly influences loyalty when prices are justified and transparent (Martin et al., 2009).
Service excellence in digital commerce encompasses platform responsiveness, problem resolution efficiency, and customer support quality. Cross-industry evidence demonstrates that service quality influences loyalty through both direct and satisfaction-mediated pathways: freight forwarding research identifies service quality as the dominant satisfaction driver (Risnawati et al., 2019); hospitality contexts confirm direct loyalty effects alongside satisfaction-mediated effects (Saputra & Djumarno, 2021); and airline studies validate significant direct and indirect effects through satisfaction (Setiawan et al., 2021). Research on Indonesian e-commerce platforms further demonstrates that service quality’s impact on loyalty operates fully through satisfaction, indicating that superior service must first generate satisfaction before translating into loyalty behaviors (Rizan et al., 2020).
Promotional strategies—including price discounts, flash sales, and shopping festivals—are widely used in e-commerce. However, research demonstrates that promotional effects on loyalty operate through indirect pathways rather than direct causal links. Studies of large-scale online social promotions demonstrate that perceived promotional incentives influence loyalty primarily through two mediators—flow experience and satisfaction—with direct effects on loyalty being non-significant (Zhang & Li, 2024). This mediated mechanism exhibits substantial context-dependency: multichannel grocery shopping research reveals that price promotions strongly influenced brand choice offline but showed no significant effect online (Arce-Urriza et al., 2017).
The three-item and five-point Likert-type scale used to measure the loyalty of customers was employed based on the study of Flavian et al. (2006) who reported a satisfactory level of internal reliability (Cronbach’s alpha) score of .77. The same test was conducted for this study and generated a Cronbach’s alpha score of .75 leading to the confirmation of internal reliability.
The sampling unit employed for the validation of the Buyer PLX scale was composed of shoppers who regularly visit and shop from e-marketplaces in the Turkish market. Respondents were asked to fill out an online questionnaire which was distributed through the Survey Monkey data collection tool. The sampling methodology employed was convenience sampling where authors distributed the questionnaire links through their personal and academic network. The questionnaire link was sent to 1756 respondents and 378 responses were collected. The written informed consent of the participants related to the participation and processing of information was acquired. As a result of cleaning incomplete responses and outliers, a total of 270 valid responses were obtained.
To validate the scale, evaluate the structural model, and test the proposed hypothesis, structural equation modeling (SEM) was utilized. First, the construct validity of the model was tested and confirmed through the employment of the Confirmatory Factor Analysis (CFA) as suggested by Anderson and Gerbing (1988). CFA analysis was conducted by employing SPSS AMOS 29 software. As suggested in the relevant literature by Bagozzi and Yi (1990), to confirm the construct validity, the Comparative Fit Index (CFI) and Incremental Fit Index (IFI) should be above 0.9 level while CMIN/DF ratio below the level of 3 and RMSEA below 0.10 are regarded as satisfactory levels. Based on the mentioned thresholds of fit indices, the results of the analysis confirmed the construct validity of the PLX scale (χ2/DF =1.190, CFI=0.993, IFI=0.993, RMSEA= 0.016).
Following the confirmation of the construct validity, additional validity and reliability checks were employed to confirm the convergent validity, discriminant validity, composite reliability, and internal factor reliabilities. Average Variance Extracted (AVE) scores are calculated for each factor in the model to test the convergent validity. All AVE scores were above the minimum required score level of 0.50 as suggested by Byrne (2013) and this result confirmed the convergent validity. To test the discriminant validity, the square roots of each AVE score are calculated and these scores are compared with the correlation of that factor with other factors in the model. The result of the comparison showed that there is no higher level of correlation score than the corresponding square root AVE score. This result confirmed the discriminant validity of the model as suggested in the relevant literature (Civelek, 2018). The composite reliability, as well as internal reliability (Cronbach’s alpha) scores for each factor, are calculated and all the scores generated were above the .70 minimum thresholds, confirming the composite reliability as well as internal reliability as suggested by Fornell and Larcker (1981). The results of the validity and reliability checks are presented in Table 9.
Validity and Reliability Checks.

Correlation is significant at the 0.01 level (2-tailed).
Diagonals show the square roots of AVE scores.
The structural model was evaluated by calculating the goodness of fit indices, the root-mean-square error of approximation (RMSEA), and the χ2 goodness of fit statistic. As suggested by Bagozzi and Yi (1990), Comparative Fit Index (CFI) and Incremental Fit Index (IFI) scores above 0.9, RMSEA below 0.10 and CMIN/DF ratio below the threshold level of 3 are satisfactory levels. Based on the mentioned thresholds of fit indices, the results of the analysis confirmed the structural model validity (χ2/DF =1.216, CFI=0.991, IFI=0.992, RMSEA= 0.028). Based on the results, the level of variety in terms of alternative sellers and associated product offerings is found to have a positive and significant effect on the loyalty level of consumers in the e-marketplace. Similarly, the perception related to the competitiveness of price level applied in the e-marketplace compared to other marketplaces is found to have a significant and positive effect on the loyalty of consumers. On the other hand, service excellence also is found to have a positive effect on the loyalty of consumers. Finally, the promotions offered in the e-marketplace are found to have no significant effect on loyalty. The results of the hypothesis testing are presented in Table 10 while the structural model and the relationship between the variables are presented in Figure 2.
Results of Buyer PLX Hypothesis Testing.

Significant at the 0.05 level.

Results of the buyer PLX structural model testing.
Criterion-related validity was assessed with a structural model showing that the four PLX dimensions jointly predict customer loyalty, consistent with established model-fit guidelines (Anderson & Gerbing, 1988; Bagozzi & Yi, 1990).
Discussion
This study aimed to develop and validate a cognitive and relational experiential scale of buyers in the e-marketplaces. The methodological approach borrowed from the studies of Hollebeek et al. (2014), Netemeyer et al. (2003) and Churchill (1979), included five studies which are used to develop the construct, identify the scale items, test the scale, and validate the buyer PLX scale. The review of the online customer experience construct led us to the conclusion that the dimensional approach of previous studies include only the cognitive dimension (Novak et al., 2000), the combination of cognitive and affective dimensions (Liu et al., 2008), and cognitive, affective, social, and sensory dimensions (Bleier et al., 2019). At this point, it is important to remember that the focus of this study is the cognitive and relational experiential state of buyers in the e-marketplaces. As a result of buyer interviews as well as an extensive literature review on the online experience context, five dimensions of cognitive and relational buyer experience dimensions were identified including the level of variety, competitive pricing, service excellence, and the effectiveness of promotions.
Although many other aspects of customer experience are studied in the marketing literature, the primary focus was the highest-ranking factors listed by the buyers who were interviewed. Thus, several other factors that are studied as contributors to customer experience in a digital context but not mentioned or ranked lower in the buyer interviews were not included in the scale. One of the dimensions identified as the cognitive determinants of the experiential state of buyers in the e-marketplace context was the variety factor which represents the number of product offerings and sellers who provide these offerings in the e-marketplace. The number of offerings in the online context was one of the factors identified in the previous studies (Liu et al., 2008) while the number of sellers who provide these offerings was the addition of the authors in this study. These two factors are combined into the variety dimension of the buyer PLX scale. By demonstrating that consumers naturally evaluate “many products offered by many independent sellers” as a single experience driver, this study extends existing assortment research and clarifies why the merged Variety factor emerged empirically in the EFA. The service excellence dimension of buyer PLX scale was the focus of many studies in the literature and many studies reported the positive impact of its components on the online customer experience (Koronaki et al., 2023; Pham & Ahammad, 2017). Similarly, the second dimension of the buyer PLX scale, the competitive pricing level of the e-marketplace compared to other e-marketplaces, is the reflection of the value provided to the customers transacting in the e-marketplace, and it was the focus of several studies in the literature reporting it as one of main determinant of the online customer experience (Cachero-Martínez & Vázquez-Casielles, 2021; Micu et al., 2019). Finally, the promotional effectiveness of the e-marketplace was also another factor of online customer experience reported in the existing literature (Cachero-Martínez & Vázquez-Casielles, 2021).
The theoretical relationship validity assessment of the buyer PLX scale was conducted through the measurement of the effect of scale dimensions on buyer loyalty towards the e-marketplace they already prefer. The results of the study showed that the competitive pricing level perception of consumers for the e-marketplace they mostly use compared to other e-marketplaces was found a significant and positive contributor to their customer loyalty in the e-marketplaces they prefer. Similarly, the variety dimension which includes the perception of consumers related to the number of offerings as well as the number of sellers in the e-marketplace who provide these offerings is found to have a significant and positive effect on the customer loyalty in the e-marketplace. Finally, the service excellence perception of consumers, which indicates the success of responsiveness of the e-marketplace regarding the problems, inquiries, and questions is also found to be a contributor to customer loyalty in the e-marketplaces. On the other hand, the effectiveness of promotions is found to have no significant effect on the customer loyalty in the e-marketplaces. This null result is explained by the short-term nature of promotions—especially within a context saturated by concurrent nationwide discount campaigns. During our data-collection window, temporary price incentives were ubiquitous, rendering any single marketplace’s offers less distinctive. Moreover, stand-alone discounts seldom foster the attitudinal commitment captured by our loyalty construct unless they are embedded in a broader pragmatic shopping experience. Prior e-retail research similarly reports that limited-time discounts bolster loyalty only when combined with richer experiential cues (Cachero-Martínez & Vázquez-Casielles, 2021). Consistent with this interpretation, recent omnichannel evidence shows that integrated promotions primarily elevate the cognitive facet of customer experience without producing a direct attitudinal-loyalty gain (Gao et al., 2021). Consequently, our non-significant H4 finding suggests that respondents evaluated routine, saturated price incentives rather than integrated experiential promotions. Because our data are cross-sectional, we were unable to model how promotional intensity varies over time; future longitudinal or experimental work is therefore needed to isolate timing effects. Overall, competitive pricing perception and variety are cognitive aspects of customer experience, whereas service excellence reflects both cognitive and relational facets. It is important to distinguish e-marketplaces from standalone company websites in online shopping. Consumers primarily visit e-marketplaces to browse a wide assortment of products and sellers, compare prices, enjoy high-quality service, and shop securely. Thus, the motivations driving e-marketplace use are chiefly cognitive and relational.
The theoretical relationship validity assessment of the buyer PLX scale shows us that e-marketplace professionals who target to improve customer retention performance of their e-marketplaces need to be sensitive to three important factors which are the main dimensions of the buyer PLX scale. Variety is critical; therefore retention efforts should prioritize strategic assortment expansion and sustained seller participation. Dedicated PLX programmes can incentivise sellers and ensure breadth and depth across categories. In addition to the variety, service excellence level is one of the crucial key success factors in the retention of customers. Therefore, e-marketplace managers need to develop and sustain higher service standards in their e-marketplaces. These standards need to be strictly applied by the respective seller stores in the e-marketplaces. Competitive pricing perception of consumers regarding the value advantages of e-marketplaces they prefer is another important factor contributing to their cognitive experiential state in the e-marketplace context. As one of the primary motivations of consumers to engage with e-marketplaces is to compare prices and get value advantage, this significant and positive contribution of competitive pricing perception on customer loyalty is highly expected. Managers of e-marketplaces need to take into consideration this strong tendency of value-seeking behavior in e-marketplaces and adjust their pricing policies and standards taking into consideration the competitive frame of reference. Effective pricing policies and standards will lead to a higher level of support of the cognitive experiential state of consumers which will eventually help the retention of e-marketplace customers.
Building on these findings, marketplace operators can embed the four-factor Buyer-PLX scale in quarterly voice-of-customer (VoC) surveys, seller-performance dashboards, and live A/B experiments that track how interface or policy changes affect buyer experience in real time. Academics can incorporate the instrument into structural models of trust mediation, cross-channel spill-over, or culture-based moderation, thereby enabling cumulative theory building around two-sided-platform dynamics.
Methodologically, this study relied on a non-probability, single-country sample and exclusively self-reported, cross-sectional data—conditions that may introduce common-method bias and limit causal inference. The absence of objective behavioral metrics prevents triangulation with revealed-preference measures. These factors should be acknowledged when generalizing the results. Further research should replicate the Buyer-PLX scale with probability samples across multiple countries, test configural, metric, and scalar invariance, and use longitudinal or experimental designs to isolate causal pathways. Future work could first manipulate product- versus seller-level assortment to test the stability of the unified Variety construct. Additional studies should model buyer trust as a mediator of the Service-Excellence effect and examine whether age or gender moderates any PLX–loyalty relationships, thereby sharpening the boundary conditions of our findings.
This study therefore enlarges experience-measurement theory by confirming that a streamlined four-factor PLX framework—anchored in cognitive (variety, competitive pricing) and relational (service excellence) cues—accounts for buyer loyalty in two-sided marketplaces. More broadly, our results call for platform strategies that privilege long-term assortment expansion, transparent value signaling, and seller-level service governance over short-term discount tactics. Implementing these priorities not only reinforces buyers’ cognitive assessments of value but also nurtures the relational trust required for sustainable retention.
Although the CFA indices confirm an excellent four-factor structure within our dataset, replication studies using platforms that manipulate product- and seller-level assortment separately are needed to verify the stability of the unified Variety construct; this analysis could not be conducted with the existing dataset, and therefore constitutes a study limitation. In addition, because the PLX scale was validated solely with Turkish consumers and age- or gender-based differences were not examined, future research should test configural, metric, and scalar invariance across cultures and run multi-group analyses by age and gender to uncover potential moderating effects.
Although our discriminant-validity tests confirmed that Service Excellence is statistically distinct, prior meta-analytic work shows that buyer satisfaction—a core sentiment rooted in perceived service quality—correlates strongly with trust (Geyskens et al., 1998). Consequently, part of the Service Excellence → Loyalty effect may be routed through unmeasured trust perceptions. Future studies should model buyer trust explicitly to disentangle direct versus trust-mediated effects.
The current research did not examine whether the PLX–loyalty relationships vary across age or gender. Future studies with larger and more balanced subsamples should conduct measurement-invariance and multi-group analyses to explore these potential moderating effects.
Footnotes
ORCID iDs
Ethical Considerations
All procedures performed in studies involving human participants were in accordance with the ethical standards of the institutional and/or national research committee.
Funding
The authors received no financial support for the research, authorship, and/or publication of this article.
Declaration of Conflicting Interests
The authors declared no potential conflicts of interest with respect to the research, authorship, and/or publication of this article.
Data Availability Statement
The data that support the findings of this study were collected through two anonymous online surveys conducted for pilot testing and validation during the scale development process. The dataset does not contain any personally identifiable information, and participants cannot be re-contacted. The anonymized data are available from the corresponding author upon reasonable request.