
Abstract
Due to the recent development in online shopping, the e-commerce business has experienced significant growth. However, in developing nations such as Pakistan, the concept of e-commerce is yet in its early stages, and there are several roadblocks to users using this platform. Therefore, this study aimed to identify the nexus between service quality (SQ), customer satisfaction (CS), customer complaints, and loyalty in the online shopping environment by integrating the SQ model with the American Customer Service Index (ACSI) model. A conceptual framework was created and evaluated using data obtained through a structured questionnaire (n = 296) from e-commerce users. In Smart-PLS v3, the author used structural equation modeling (SEM) to examine the study hypotheses. As per the study findings, reliability, responsiveness, trust, WD, and personalization are significant determinants of SQ. Meanwhile, in an e-commerce context, SQ is positively associated with CS, which leads to a reduction in customer complaints and an increase in customer loyalty. The results provide a birds-eye view to the managers to direct their spending scientifically to the variables that have the most significant influence on SQ and CS. It will assist current and prospective e-commerce retailers in gaining a thorough grasp of CS, complaints, and loyalty in their industry. Furthermore, the theoretical and practical contributions were discussed in this study.
Introduction
Technology makes everything easier, and online shopping may significantly save our time and energy (Elias et al., 2015). The most important factor for e-commerce firms is customers satisfaction (Bhattacharya & Raju, 2019). Customer satisfaction (CS) is an imprecise, abstract concept in a business and very important in marketing. Fonseca (2009) empirically proved this in his study of the strategic link between CS and total service performance. For most marketers and researchers in the customer field, important issues include practical and theoretical problems (Elias et al., 2015). The actual manifestation of satisfaction varies due to different products and different services among people. The state of satisfaction depends on many factors, attributed to psychological factors, economic factors, and physical factors. CS has been determined by using a vital element of SQ (Falahat et al., 2019; Loiacono & Hall, 2002; Merugu & Mohan, 2020; Reichheld & Schefter, 2000; Yoo & Donthu, 2015). CS is also considered an important indicator of organizational performance (Hallencreutz & Parmler, 2021).
Prior researches explore that as the customer gets satisfied with the quality services of a company, they like to share their positive experience with others (Dynamics et al., 2014). Therefore, companies should focus on customers satisfaction, which may grab the attention of potential customers and will also maintain customers’ loyalty (Gerdt et al., 2019). Online retailers must understand how to improve SQ in an e-commerce environment to facilitate further growth (Dhingra et al., 2020). Therefore, online retailers understand how consumers perceive and evaluate their products/services, which may continuously improve CS, which is particularly relevant. Meanwhile, online business should be modified according to the satisfaction of customers in the industry. The knowledge of factors that affects SQ lowers customer complaints and enhances customer loyalty. Previous literature focuses the privacy and security issues while ignoring other important SQ issues, such as reliability, responsiveness, or trust (Bashir et al., 2020; Pollach, 2007; Wilson & Christella, 2019). There is a scarcity of SQ research, especially concerning CS, customer complaints, and loyalty in e-commerce. Therefore, the objective is to find out the elements that are the reasons for a change in SQ, CS, and loyalty to fill the existing gap in the research.
During the current epidemic, online shopping gets more attention. Today, with the extensive development of online markets and websites, people’s dependence on Internet technology has greatly increased (Moon et al., 2021). As more and more people accept the Internet as a source, finding problems that affect online shopping, customer loyalty, and satisfaction. Globally, customer loyalty increases the growth and profit of the company. The interest of loyal customers is higher than the disloyal customers, which results in more profit for the company. As a researcher, a company generates more than 35% of sales from repeated customers (Reichheld & Schefter, 2000). Therefore, it proves that customer loyalty is the key to success for e-retailers. Although recent research has progressed in the quality of online retail services, according to the consumer’s knowledge, more research is needed to better understand the aspects that influence consumer satisfaction and loyalty, especially in developing countries such as Pakistan.
This study tries to examine the factors that affect SQ and lead to CS in online shopping situations, especially the young adult generation in developing countries. In addition, the researcher also explores the relationship between CS, customer complaints, and customer loyalty in the online shopping atmosphere. Marketers can use the findings of this study to improve their internet marketing strategy strategies. In addition, the study findings increase the value of marketers in the e-commerce industry, particularly in developing countries such as Pakistan. The study is organized as follows. The previous literature and hypotheses are developed in Section 2, and Section 3 describes the research methodology. The results are presented in Section 4, and Section 5 includes conclusions, as well as the implications of the research and future directions.
Review of Literature and Development of Hypothesis
The recent study revises the SERVQUAL model to consider online context by rephrasing and changing dimensions. The model points out the impact of the five factors of WD, reliability, responsiveness, trust, and personalization on the overall quality of electronic services. In addition, this study also analyzed the relationship between electronic SQ, CS, and purchase intention (Dhingra et al., 2020). Claes Fornell proposed the “American Customer Satisfaction Index Model (ACSI)” in 1994, director of the National Quality Research Center “a research unit within the University of Michigan, collaborating with the American Quality Association and the American Customer Feedback Insight Group.” ACSI is based on the Swedish Customer Satisfaction Barometer (SCSB), a model that measures the Swedish economy by measuring consumer satisfaction. This model is used to assess the quality of products and services at the organizational and industry levels because it can assess CS based on actual customer experiences. It can also be applied to marketing so that it can reach more consumers (Dutta et al., 2017).
Based on this ACSI model and SERVQUAL model, this research established a conceptual framework as an extension of the ACSI model on behalf of SERVQUAL because it is very important to discuss customer loyalty in terms of CS. Moreover, when the customer is dissatisfied, the customer makes more complaints and may not be loyal anymore to the company. As discussed earlier, the previous research is based on other factors, so here, this study discusses the WD, trust, personalization, responsiveness, reliability, and SQ to test CS and complaints and customer loyalty.
Customer Loyalty
Customer loyalty is described as customer behavior that is motivated by a positive experience, perceived value, and results in the purchase of a product, even if the purchase is not the most rational choice (Falahat et al., 2019; Kincaid, 2003). Due to customer loyalty, customers focus on the same company participating in repurchasing the services for the next many years due to customer loyalty (Hallencreutz & Parmler, 2021). What is the importance of this part of customer expenditures in the total expenditures of the service category? The definition of customer loyalty is that people would like to continue to buy or patronize their favorite products or services in the future, even though contextual influence and marketing efforts may lead to changing behaviors (Hellier et al., 2003; Rybak, 2018). This study defines customer loyalty as an increasing construct, including consumption behavior (behavior loyalty) and expected consumption (repurchase in the future). Another measure of customer loyalty is through repurchase intention (Li & Green, 2011; Nguyen-Phuoc et al., 2020).
In addition, he also emphasized that developing relationships with new customers costs five times higher than existing customers’ retention costs (Pfeifer, 2005). Although determining the actual cost ratio is a contentious topic from a business perspective, it makes sense to take care of active customers before planning to acquire new ones, as pointed out (Srivastava & Rai, 2018; Walsh et al., 2005). They asserted that most consumers are still polygamous to some level, displaying loyalty to multiple brands within a particular product category (Hellier et al., 2003). According to this view, customer loyalty is defined as the continued inclination to buy a brand over a variety of other brands. Under normal circumstances, it is difficult to maintain loyal consumers in an online shopping environment (Nisar & Prabhakar, 2017). Researchers consider loyalty to be a key variable because of its direct link to an organization’s survival, growth, and profitability. The focus of the customer loyalty paradigm has shifted from acquisition to retention (Malhotra, 2021; Molinillo et al., 2021; Shahzad et al., 2021). Several studies have examined differences in service provider loyalty between stayers and switchers (Shahzad et al., 2021; Wongkitrungrueng & Assarut, 2020).
Customer loyalty is one of the most important aspects of e-commerce success. The study of Luo et al. (2006) suggests that Customer loyalty is a positive attitude toward e-retailing, leading to repeated purchases. Therefore, loyalty is closely related to re-purchases (Savila et al., 2019). In other words, when customers repeatedly purchase goods online, they express their loyalty to a specific e-commerce retailer (Huy Tuu et al., 2011). Depending on the industry, factors such as commitment, trust, or consumer involvement can all influence the relationship strength. In general, in the context of “e-loyalty,” online customers can access the website with just one click (Brynjolfsson et al., 2009; Savila et al., 2019). Furthermore, once the relationship between overall loyalty and satisfaction is increased, a mutual relationship between satisfaction and loyalty will eventually emerge. Satisfaction raises loyalty, and loyalty, in turn, increases satisfaction. Satisfaction is the key to developing loyal and long-term consumer connections (Nisar & Prabhakar, 2017). In the e-commerce settings, due to the low search cost, consumers can make product comparisons using different criteria such as price, features, retailers, and weigh the costs and benefits associated with the products (Cao & Li, 2015; Zhang & Li, 2019).
In e-commerce, the customer’s predisposition to buy from e-retailers, derived from an individual’s attitude, is known as the purchase intention (Kimery & McCord, 2002). Previous researches have also mentioned that consumer loyalty is behavioral and attitudinal loyalty in the online shopping environment (Kaur et al., 2021; Shafiee & Bazargan, 2018; Turaga et al., 2021). In the current research context, we only discuss overall customer loyalty without measuring its dimensions to avoid the complexity of theoretical model development. Furthermore, the actual purchase behavior of consumers in an online shopping condition is also denoted by the purchase intention. That is to say that online consumer buying behavior can best be predicted using a reliable variable of purchase intention.
Reliability and SQ
Reliability is well-defined as “the ability of service providers (such as companies or organizations) to accurately and reliably provide customers with the promised services” (Auka et al., 2013). Reliability can be described by providing the best service performance, salable products, and error-free transaction processing (Iberahim et al., 2016). The concept of providing services as promised can be understood as the company can abide by its promises and provide services to customers correctly for the first time without any errors (Merugu & Mohan, 2020). The measurement of the reliability of website e-commerce includes several dimensions such as correct fulfillment of orders, honesty of products offered online, frequent website updates, smooth website operation or error-free online transactions, personal information security, accurate online purchases, and timely delivery of orders (Omar et al., 2015). Regular website updates, timely customer assistance, and correct online purchases and billing are all examples of reliability (Febrian & Vinahapsari, 2020; Ndou, 2004; Santos, 2003). The inventory of the product sold to the customer is also an important consideration; when the customer chooses the product, and the page says that the inventory has been sold out, this indicates that the website cannot fulfill the promised service and the customer cannot be trusted (Lee & Lin, 2005; Wilson & Christella, 2019). Reliability can be seen as a major indicator of the level of service, the loyalty of the consumer, and online purchasing intentions. Therefore, this study posits that:
Responsiveness and SQ
Whenever a problem arises, the capacity of an e-retailer to deliver customers with suitable information is called responsiveness. It is the willingness of online corporate employees to guide the customers and enable fast services to them (Madu & Madu, 2002). It all consists of transmitting information on the FAQs and motivating to help troubleshoot problems (Ahn et al., 2007). Responsiveness is the focus of communication with its users and contribution from the e-retailers to implement multiple service offerings in the form of functions on the website, such as a complaint handling system, chatbots, etc. (Boucher, 2021; Lee & Kozar, 2006; Lee & Lin, 2005). Quick response to the inquiries of the customers, telephone calls or emails, or customers getting the response within the promised time); facts recovery; response against any search; and user-friendliness of a search engine (Merugu & Mohan, 2020; Yang et al., 2001). These virtual shops are required to behave politely while offering customer service and come up with sufficient responses to customers via email. Cancelation of orders and refunds should also be moved efficiently by them (Srivastava & Rai, 2014; Uzir et al., 2020). Some customers will even contact the supplier before buying to eliminate doubts. The degree of CS obtained by contacting customer service will affect the customer’s purchase intention. Studies have shown that responsiveness significantly impacts SQ (Loonam & O’Loughlin, 2008; Zemblytė, 2015). Therefore, this study posits that:
Personalization and SQ
The degree to which data or services are customized to encounter the needs of individual visitors is called personalization (Lee & Lin, 2005). Previous studies have shown that customer service affects their perception of SQ and satisfaction (Wolfinbarger & Gilly, 2003). It assists customers to discover solutions for their queries and helps their online business enhancement by running the ability to quantify the quality of solutions on the other, thereby supporting e-retailers (Li & Suomi, 2009). It also covers recommendation systems, customized and adaptive websites. Trust includes privacy and security and is well-defined as a customer poise that the website is free from danger or suspicion during the electronic service means (Papadomichelaki & Mentzas, 2012). Recommend trust and precise information as the primary strategy to help network companies establish a good image and trust in customers’ hearts (Krishnaraju et al., 2016). Personalization describes the level of citizens’ modifications in the information provided to them and to the services they get through channels that ultimately meet their requirements (Tam & Ho, 2006; Zhang & Curley, 2018). It improves the effectiveness of services, and it is obvious that user control is a convenient information channel (Ntaliani et al., 2008). Therefore, this study posits that:
Trust and SQ
The inconsistency and incompleteness of concepts have led to problems in trust development, operation, and extent. The study of Carter and Bélanger (2005) is based on the rules of “structure,” “capability,” “reliability,” and operation,” and also often focused on the service provider’s institutional climate (Tolbert & Mossberger, 2006). Trust is a psychological shortcut in the electronic market when consumers try to diminish the vagueness and difficulty of transactions and relationships (Lukito & Ikhsan, 2020). One of the frequently mentioned reasons why consumers do not buy from online shops is rooted in the scarcity of trust in these e-retailers (Falahat et al., 2019). Research shows that trust and belief positively affect online consumers’ purchase intentions (McKnight & Chervany, 2008). So, it is of great interest to researchers to understand the factors that influence the generation of trust and belief in the network environment (Chen & Dhillon, 2003; Ghalandari, 2012). As an original business movement, e-commerce contains more uncertainties and risks than traditional methods of shopping (Aslam et al., 2020; Lee & Turban, 2001). Instead, the main challenge for e-commerce providers is how to gain customers’ trust and keep them loyal, especially in developing economies where e-commerce is still in its growth phase (Aslam et al., 2020; Fadhillah et al., 2021).
Trust is the key to the success of e-commerce events (Savila et al., 2019). It is found in previous literature that experience, environment, friends, insecurity, and mistrust of others are a factor that leads to whether a person trusts the seller (Goutam et al., 2021; Wongkitrungrueng & Assarut, 2020). Other researchers have found that a higher level of trust in the brand results in a motivation in customers to be keen to try product extensions. In the context of multi-channel retail, a consumer’s trust in a retail brand is likely to affect his or her acceptance of the retailer’s products on new commercial channels (such as the Internet) (Goraya et al., 2021; Reast, 2005; Savila et al., 2019). At the macro level, trust in e-commerce is affected by complex issues from three major perspectives: trading partner trust (such as between organizations in e-commerce), technical assurance, and social infrastructure. Therefore, this study posits that:
Website Design (WD) and SQ
Among several dimensions, WD is an important indicator of SQ which also is designed in such a way that it fulfills the customers’ needs (Zeithaml, 2002). When using online stores, shoppers always worry about user-friendliness (Parasuraman et al., 1988). Excellent navigation and valuable material on the website portal help attract online shopping Customers (Li & Suomi, 2009). The WD focuses mostly on the attractiveness of the consumer interface and its design experience. It contains all the elements that clients experience on the website, excluding the navigation of customer service (Nguyen-Phuoc et al., 2020). Simply put, WD explains the appeal of user interface designs developed for visitors (Maiyaki et al., 2016). The WD reflects esthetic elements, such as colors, graphics, or text, as well as ease of use and visual appeal, and is directly presented to website visitors (Bressolles & Durrieu, 2011). CS in e-commerce is connected to the excellence of WD (Cho & Park, 2001; Lee & Lin, 2005). Empirical research originates that WD has an optimistic impression on overall CS and perceived SQ. Therefore, WD plays a significant role for online retailers to create a good “first impression” for visitors. However, it is a challenge to create a well-designed website that gives visitors a good first impression (Wilson & Christella, 2019). In addition, if the WD is classified as good, then it will build an online website based on satisfaction after purchase and creating purchase interest (Luo et al., 2012). Therefore, this study posits that:
Service Quality and Customer Satisfaction
Quality assessment is an important intersecting research field in information systems, marketing, and operations management. One view is that technical quality-what the customer really gets from the service-functional quality-the way to provide services (Merugu & Mohan, 2020). Another perspective shows that providers and receivers jointly produce services in three dimensions (Lehtinen & Lehtinen, 1991): “physical quality” (physical aspects of the service), “corporate quality” (company’s image or profile), and “interactive quality” (interaction between contact personnel and customers). Integrate the original work to emphasize the disparity between consumer desires and actual experiences. After many improvements, SERVQUAL (Ladhari, 2009; Nunkoo et al., 2020). SERVQUAL has already been tested in multiple industrial settings, yet it is the most relevant and used tool by scholars and experts to assess SQ (Ladhari, 2009; Merugu & Mohan, 2020). Meanwhile, the study of Mulyono and Pasaribu (2021) discussed the positive impact of SQ on customer satisfaction in a digital environment. The study of Chung and Park (2017) found that deep behavioral perception positively impacts rapport, and rapport has a completely mediating role. Finally, this research shows that even if the medical service provider expresses untrue emotions, the time of contact with the patient will change the relationship with the patient. More specifically, the quality of electronic services is based on consumers’ overall evaluation and judgment on the services provided in the virtual market (Santos, 2003). The Internet is often regarded as the primary delivery method for electronic services (Lukito & Ikhsan, 2020). Therefore, this study posits that:
Customer Satisfaction, Complaints, and Loyalty
At the global level, loyalty (e.g., customer retention) resulting from CS is usually closely related to a company’s profitability and long-term growth (Reichheld, 1994). Loyal customers visit their favored sites twice as frequently as non-loyal customers, and they spend more money (Hoffman & Novak, 2000). A small increase in customer retention can significantly increase profits (Sanyala & Hisamb, 2019). Therefore, it is not remarkable that customer loyalty is a key asset of merchants (Sanyala & Hisamb, 2019). Understanding CS in online shopping is a significant part of improving and reducing the level of online shopping (Moon et al., 2021). Although traditional retailers and e-retailers are facing the same challenges, e-retailers are facing greater competition because on the Internet, and competitors can be found with just one click (Mithas et al., 2006; Nguyen-Phuoc et al., 2020). CS is also regarded as the core element of customer retention. It evaluates the degree to which a company’s products meet or surpass customer expectations, improves the quality of the relationship between clients and service suppliers, and increases repurchase behavior (Nakhleh, 2012; Nguyen-Phuoc et al., 2020). According to the literature in marketing, CS has always been considered a key element to assess the quality of the relationship between providers of the services and users (Nakhleh, 2012; Nguyen-Phuoc et al., 2020). More precisely, satisfaction is determined only by the performance of durable goods (Merugu & Mohan, 2020). The standards can be based on past purchase experience, product advertising, word of mouth, etc. (Wilson & Christella, 2019). CS also means the number of customers or the level of all customers, they must participate in the company’s projects, or their services (evaluations) meet or exceed the stated goals (Kate, 2020). Satisfaction also reflects the customer’s response to the organization’s overall product performance as measured by a set of customer needs (Wilson & Christella, 2019). CS is also not an absolute concept but rather relative to the customer’s experience of shopping and/or using the product or service (Merugu & Mohan, 2020; Wilson & Christella, 2019). Therefore, this study posits that:
Customer Complaint and Customer Loyalty
A complaint expresses dissatisfaction with the service provider by the customer/consumer when the service fails (Agu et al., 2018). When customers experience that service, performance is lower than their expectations; they will complain and feel dissatisfied. Therefore, unhappy customers are more likely to complain than happy customers (Cheng et al., 2020). The literature has shown that a high degree of CS leads to a better company image, higher customer loyalty, and fewer customer complaints (Hallencreutz & Parmler, 2021). Complaints are characterized as a representation of the consumer’s self-affirmation, which includes an emotional component, as well as a means of demonstrating loyalty that must be done on the spot (Phan et al., 2021). Many businesses are increasingly working on improved SQ which may ultimately improve the CS as input for reducing customer complaints and building consumer loyalty (Gong et al., 2015). The study of Shahzad et al. (2021) described the various antecedents of customer loyalty that improve the performance of the telecommunication sector of Pakistan. During an online transaction, the consumer and store are separated, emphasizing the necessity of service recovery in e-service management. The compensation strategy for resolving customer complaints is an important component to consider when evaluating the quality of an e-service (Collier & Bienstock, 2006; Phan et al., 2021; Van Vaerenbergh et al., 2019). Customers will be emotionally insensitive if they are unsatisfied with something and wish to complain about it. It would be easy for them to grow upset or disillusioned if the firm did not treat them with the utmost care (Phan et al., 2021), which may also affect customer loyalty. Therefore, this study also measured the relationship between CS and customer complaints. Therefore, this study posits that:
The author describes the conceptual framework in Figure 1 based on the preceding discussion.

Conceptual framework.
Research Methodology
Measurement
To assure the content validity of the research framework, a structured questionnaire was constructed for data collection. The preliminary investigations were used to operationalize and adapt all measuring items. The scale components were written in explicit and straightforward language to encourage respondents to express themselves freely. This study’s questionnaire was developed utilizing a 7-point Likert scale ranging from 1 “Strongly Disagree” to 7 “Strongly Agree,” as used in several prior studies (Kurfalı et al., 2017; Rana et al., 2017; Shahzad et al., 2019), see appendix.
Data Collection and Sampling Technique
The online marketplace has flourished over the past few years due to the growth of the service industry (Febrian & Vinahapsari, 2020). Customers particularly in developing countries recognize that online purchases are high-risk, and are aware of what can happen to their data online. In Pakistan, for example, online shopping is still in the development stage, and consumers are more concerned about online retailers and the credibility of online shopping. In line with the current study objectives, the target population of this study would be the customers who have experienced online purchasing or even continuously using online services within the diverse range of the Pakistani population specifically from the Bahawalpur division. Therefore, the sampling method for this study is: “simple random sampling.” The authors added a screening key question: “Have you had any online shopping experience?” This made data collection more purposive in the current randomization.
Moreover, the study of Hair et al. (2010) highlighted the sample size for structural equation modeling; the sample size ought to be in the bracket of 150 and 400 people; it is also associated with the number of variables in the study. He also suggests that if the total observed variables are six or more factors, a sample size larger than the previously recommended size is required. Additionally, Tabachnick and Fidell (2007) pointed out that the factor analysis of at least 300 cases is accommodating. This study considered the use of online survey methods to collect data through a structural questionnaire from May 2021 to June 2021. The authors used the Computer-Assisted Web Interview (CAWI) technique for online data collection, which is a survey data collection method in which respondents use computers to complete questionnaire surveys without the interviewer’s guidance (Ziemba et al., 2016).
Out of 309 answers, thirteen respondents disagreed with this statement of screening question, but they filled out the questionnaire. According to research goals, this study did not consider the reactions of those who have no online shopping experience. The ultimate sample size of this study was 296 full responses after eliminating these 13 non-participating responses.
Data Analysis Procedure
Before administering data, the screening process is vital in all research. Data screening can identify specific forward-looking matters in the data set that may distort the analysis results and the generalization of the research (Tabachnick & Fidell, 2007). As a result, this study examined the data using the Partial least squares-structural equation model (PLS-SEM) to analyze the path between constructs by utilizing SmartPLS v3. According to research, this software is more appropriate for handling intermediary constructions the fundamental path (Hair, Hult et al., 2014; Sarstedt et al., 2019). Initial data screening was done in SPSS v26.
Results and Discussion
Demographic Analysis
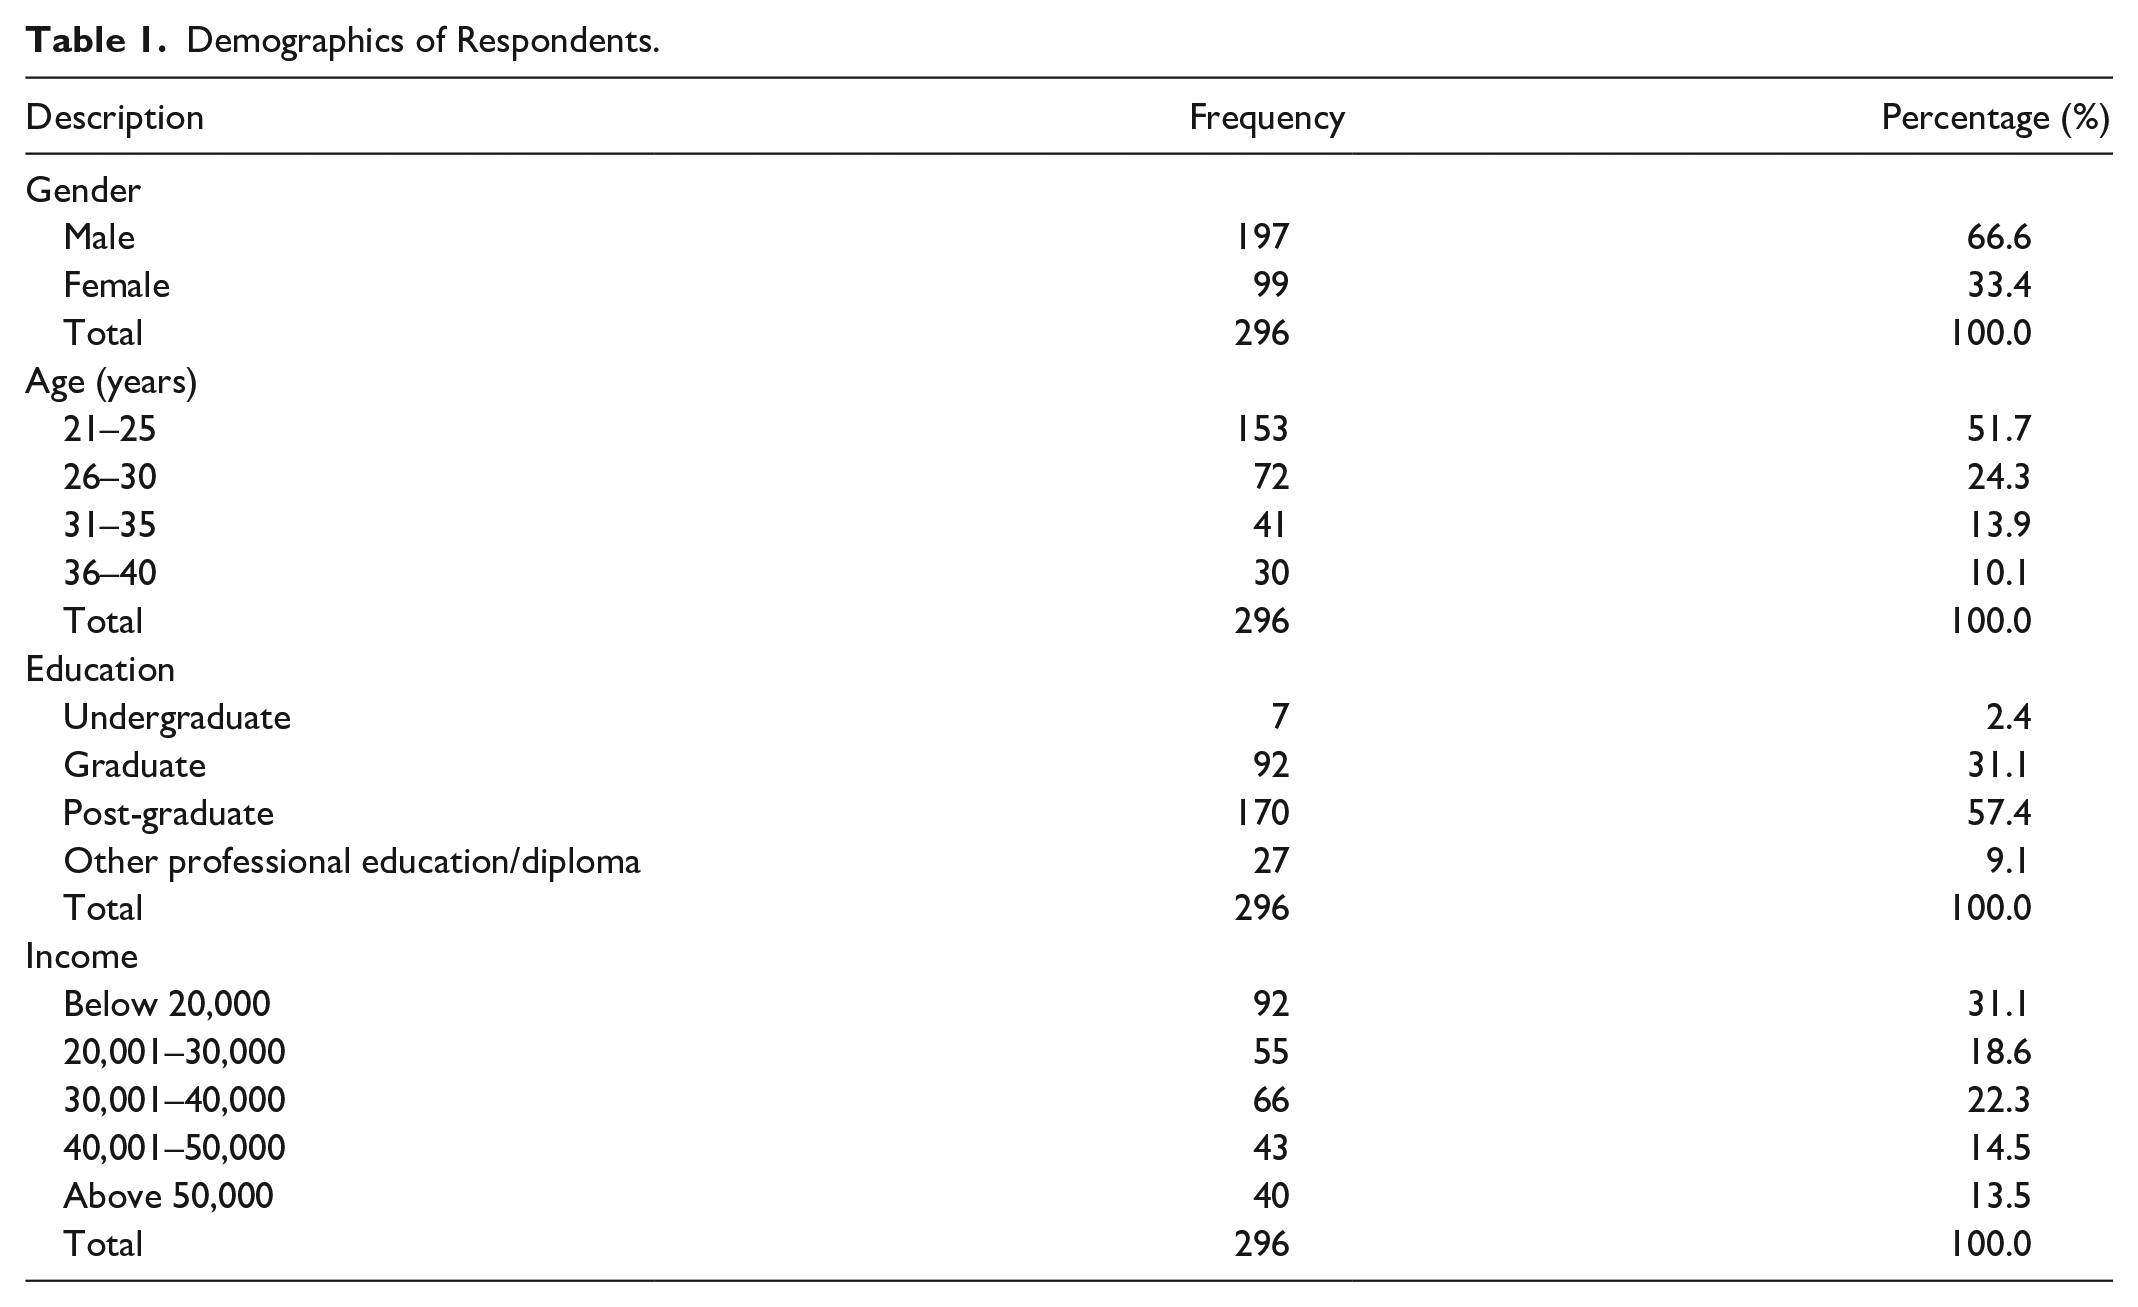
Gender, age, education, and income were among the demographic characteristics examined in this study. The final sample consists of 197 males and 99 females. Table 2 represents the overall demographical characteristics of the respondents. 51.7% of the respondents fall under the age group of 21 to 25 years, 24.3% fall in 26 to 30 years, and the remaining 24% are fall above 30 years old. This shows that most of the respondents fall under the young age group. 57.4% of respondents are post-graduate, and 31.1% are graduates showing that respondents have a considerable level of education. Moreover, the author also asked about the level of income of the respondents, and the results show that 31% of the respondents fall under the income level of below 20,000, 18.6% are in 20,001 to 30,000, 22.3% are in 30,001 to 40,000, and remaining 28% are above 40,000, as shown in Table 1.
Demographics of Respondents.
Measurement Model Assessment
Convergent validity and reliability
This study applied convergence validity and reliability analysis in the measurement model. The author of this study applied confirmatory factor analysis (CFA) in Smart-PLS v3 to verify the reliability of each item. The recommended value is equal to or greater than 0.7 is acceptable, as described by Hair et al. (2014). The Cronbach’s alpha values of all configurations are between .796 and .921, greater than the threshold. In the convergent validity, the author examines the similarity between operationalization that should be similar in theory. The composite reliability (CR) values range from 0.867 to 0.944, and AVE ranges from 0.542 to 0.835. The threshold value of Cronbach’s alpha and CR should be greater than 0.7, AVE greater than 0.5, indicating that the instrument has sufficient reliability and effectiveness (Hair et al., 2014; Fornell & Larcker, 1981). The results in Table 2 show no problem with the convergent validity and reliability of the data and can be utilized for structural analysis.
Convergent Validity and Reliability Analysis.

Note. CC = customer complaints; CL = customer loyalty; CL = customer satisfaction; P = personalization; REL = reliability; RES = responsiveness; SQ = service quality; T = trust; WD = website design.
Discriminant validity
Compared with convergent validity, the author applied discriminant validity to measure the degree to which operationalization diverges from other operationalization that should not be similar in theory. Three methods were used to evaluate the identification validity. First of all, according to the description of Fornell and Larcker (1981), linking the correlation of various factors with the square root of AVE is the best way to measure discriminative validity (Fornell & Larcker, 1981). Second, item loadings and cross-loadings were performed on the survey items to confirm the associations. Finally, the Heterotrait-Monotrait ratio can be used to determine discriminant validity.
Fornell-Larcker criterion
The discriminative validity of the tools measured by linking the correlation between structures and the square root of AVE is shown in Table 3. According to the research of Fornell and Larcker (1981), the square root of AVE should be superior to the correlation between the constructs of the latent variables, thus verifying the discriminative validity of the selected constructs (Fornell & Larcker, 1981). The diagonal values in Table 3 indicate that the square root value of AVE is higher than the correlation coefficient between the variables, indicating that it has better discriminant validity. From these results, reliability and validity are not an issue in the choice of tools.
Fornell-Larcker Criterion.

Note. CC = customer complaints; CL = customer loyalty; CS = customer satisfaction; P = personalization; REL = reliability; RES = responsiveness; SQ = service quality; T = trust; WD = website design. Bold-faced values are the square-root of AVE.
Items cross loadings
Several studies have used cross-load evaluation criteria to measure the issue of discriminant validity (Fornell & Larcker, 1981; Liu et al., 2016). Items should be loaded higher than their related construct, according to the literature. The results in Table 4 are showing the item loadings and cross-loadings for all corresponding which explains that the item loading of factors is better than the cross-loadings values of other latent factors, which indicate enough discriminant validity by fulfilling the cross-loadings criterion.
Cross Loadings.

Note. CC = customer complaints; CL = customer loyalty; CS = customer satisfaction; P = personalization; REL = reliability; RES = responsiveness; SQ = service quality; T = trust; WD = website design. Bold-faced values are the factor loadings.
Heterotrait-Monotrait ratio (HTMT)
To specify the insensitivity of the aforesaid criteria, the HTMT ratio criterion was created. The value of the HTMT ratio is closer to 1, indicating that the path analysis lacks discriminative validity (Fornell & Larcker, 1981). HTMT calculates the relationship between variables (to be more exact, the upper boundary). In order to clearly distinguish two factors, HTMT should be less than 1 (Henseler et al., 2016). Therefore, in this study, the investigator also adopted the HTMT ratio. The higher value described in Table 5 is 0.567, which is lower than the above threshold, indicating that the discriminative validity of this study has been fully recognized.
HTMT.

Note. CC = customer complaints; CL = customer loyalty; CS = customer satisfaction; P = personalization; REL = reliability; RES = responsiveness; SQ = service quality; T = trust; WD = website design.
Structural Model Assessment
Path analysis
Subsequently examining the research model’s reliability, convergent, and discriminant validity, the hypothetical relationship among constructs was measured using Smart PLS v3 (Hair et al., 2014; Henseler et al., 2016). Figure 2 represents the values of the path coefficient, also shown in Table 6.

Result of SEM.
SEM results.

Note. CC = customer complaints; CL = customer loyalty; CS = customer satisfaction; P = personalization; REL = reliability; RES = responsiveness; SQ = service quality; T = trust; WD = website design.
The values of path analysis show that reliability is positively correlated with SQ (b = .118). The beta coefficient of responsibility is positively associated with SQ (b = .282). Personalization is showing a positive relationship with SQ (b = .120). Trust shows an important positive association with SQ, and the value is b = .293. Characteristics of WD also have a significant positive relationship with SQ; the coefficient value is b = .122. The SQ is impacting positively on CS with a value (0.344). The value of the beta coefficient for CS to customer complaints shows a negative relationship (−0.332). At the same time, CS positively correlates with the dependent variable customer loyalty (0.279). The customer complaint is showing a negative relationship to customer loyalty with a beta value (−0.329).
Bootstrap analysis
The bootstrap approach was used to determine the degree of significance for the path analysis, with 5,000 iterations of resampling (Lu et al., 2010; Preacher & Hayes, 2004; Streukens & Leroi-Werelds, 2016). The bootstrapping estimates are in Figure 3 describe the significant values of the values of path coefficients.

Bootstrapping results.
The author used R-square to determine the model’s predictive potential in this investigation. Using PLS algorithm in Smart-PLS, to compute R-square, it is determined that the value of R-square in SQ = 0.405, in CS = 0.119, in CL = 0.247, and in CC = 0.110. According to Falk and Miller (1992), these R-square values are acceptable as they are above the 0.10 threshold in social science research.
Blind folding/predictive relevance of the model
Researchers may want to look at Stone-Geisser’s Q² value in addition to examining the magnitude of the R2 values as a criterion of predictive usefulness (Geisser, 1974; Stone, 1974). The blindfolding process is used to acquire the Q² value of latent variables in the PLS path model (Hair et al., 2017). According to Chin (1998), if they obtained Q² value for the dependent variables is greater than 0, the model demonstrates predictive relevance. Therefore, this study also applied the same to test the predictive relevance of the proposed model. Based on Figure 4, it has been proved that the conceptual model successfully demonstrates predictive relevance.

Blindfolding.
Discussion
The results from Table 6 describe the direct relationship among the selected constructs. Reliability has been hypothesized as a positive influence on SQ in the e-commerce industry. The outcomes from SEM analysis show that the beta coefficient of path analysis between reliability and SQ is 0.118, significant at the level of .034. The results proved the significant positive impact of reliability on SQ and supported the H1 (REL → SQ). These results are consistent with prior studies (Lee & Lin, 2005; Merugu & Mohan, 2020; Ndou, 2004). Regarding the use of e-commerce services, Pakistani citizens are more concerned about the reliability of the system and its functionality. Citizens may think that e-commerce platforms should place more emphasis on developing more reliable platforms, thereby increasing the perceived SQ of e-commerce. Based on the theoretical model, this study measured the relationship between responsiveness and SQ of e-commerce platforms. The results describe that there is a significant and positive relationship between responsiveness and SQ. The values of path analysis between responsiveness and SQ are 0.282 (p = 0). These findings are also consistent with the studies of (Lee & Lin, 2005; Sharma et al., 2015). The results proved that responsiveness is also an important factor in the context of e-commerce SQ in Pakistan. So H2 (RES → SQ) is accepted.
In recent years, the personalization of products and services has become more important, and sellers need to understand customers’ preferences in order to make relevant product and service recommendations. Therefore, this study also measures the relationship between personalization and SQ, and the result shows that personalization is positively and significantly contributes to the values of the beta coefficient of personalization, and SQ is 0.120 (p = .22). Based on these results, H3 (P → SQ) is statistically accepted, which is also consistent with the studies of Kang et al. (2016) and Krishnaraju et al. (2016). These results prove that in Pakistan, customers who use e-commerce platforms to shop online are very concerned about personalization. Furthermore, to increase SQ, e-commerce could benefit from incorporating personalization tactics into service delivery. Uncertainty in the mind has the potential to change individual decisions about the system SQ. Trust plays a vital role in reducing the impact of uncertainty on customer psychology. The results from this empirical analysis express that there is a positive and significant relationship between trust and SQ. The coefficient value of trust is 0.293 (0). The positive relationship of trust was discussed separately across the various field of the study by several researchers (Alshibly, 2014; Belanche et al., 2014; Ghalandari, 2012). Therefore, H4 (T → SQ) is statistically accepted.
This study postulated a positive association between WD and SQ in e-commerce. The outcomes show that there is an important positive relationship between the WD and SQ. The value of the path coefficient is 0.122 (0.047); therefore, H5 (WD → SQ) is also supported. A website’s design elements, such as color, theme, and impression, can improve the quality of its functionality, which can have a significant impact on customer satisfaction levels. The results are also similar to the prior studies of Luo et al. (2012) and Wilson and Christella (2019). The discovery of a strong beneficial impact of SQ on consumer satisfaction backs up earlier research findings (Herington & Weaven, 2009; Kim & Jackson, 2009; Sultan, 2016). The value of the relationship between SQ and CS has been recorded as 0.344 at a significance value of 0. The findings described that improvement in SQ would lead to improving CS toward the e-commerce industry in Pakistan. Hence, H6 (SQ → CS) is accepted.
As it has been proved in this study that improved SQ will lead toward high CS. Meanwhile, greater CS will lead to lower customer complaints toward the e-commerce platform. Therefore, this study also hypothesized the negative relationship between CS and customer complaints. The beta coefficient of this relationship is −.332 along with the p-value 0, showing the significant negative relationship between CS and customer complaints. The outcomes are consistent with the study of Phan et al. (2021). Therefore, H7 (CS → CC) is accepted based on the results. This study also looked at the relationship between CS and customer loyalty. The results describe a positive relationship between CS and customer loyalty in the Pakistani e-commerce industry. The path value of the relationship is 0.279 (p = 0). The results proved that an increase in CS would increase customer loyalty and vice versa. The results are similar to the prior studies (Chae et al., 2002; Kim & Jackson, 2009). Therefore, H8 (CS → CL) is accepted. This study also measured the relationship between customer complaints and customer loyalty. The path value between the customer complaints and customer loyalty is −0.329 at the significance level of 0. An increase in customer complaints will lead to a decrease the customer loyalty in e-commerce. Therefore, based on this negative relationship, H9 (CC → CL) is accepted.
Conclusions, Implications, Limitations, and Future Research
Conclusion
CS is essential to the success of most successful organizations, especially in an online buying environment where the e-commerce platform’s SQ is critical. Therefore, this study attempts to identify the determinants of the SQ of e-commerce which ultimately leads to CS. Moreover, it also examines the impact of CS on customer complaints and customer loyalty. This study extends the ACSI model on behalf of SERVQUAL because it is very important to discuss customer loyalty in terms of CS. Because when the customer is dissatisfied, the customer makes more complaints and will not be loyal anymore to the company. Also proved in this study results.
This study identifies five SQ dimensions in e-commerce: reliability, responsiveness, trust, personalization, and WD based on a review of available literature. Based on data acquired through a structured questionnaire from e-commerce platform users in Pakistan, the suggested model was tested using PLS-SEM in smart-PLS v3. The analytic results showed that all these are valuable predictors of SQ. Furthermore, the study discovered a strong link between SQ and client satisfaction. Satisfaction in the customer’s mind can be created by improved SQ. The consumer decision-making process for online shopping can be affected by CS, which ultimately enhances customer loyalty and reduces customer complaints, as noticed in this research. Based on the results, this study also concludes implications and future directions.
Theoretical Implications
The recent research has several theoretical implications. First, this study integrates the SERVQUAL measurement scale with the ACSI model in the e-commerce environment. Because the structure of the online market necessitates a new research model for evaluating the quality of e-commerce services. The present study established a conceptual model and found the crucial factors of SQ in a developing country such as Pakistan. Moreover, CS has been measured, and its relationship with a customer complaint and customer loyalty was explored in this study. It will increase the body of information about CS, which may assist in measuring the customer’s repurchase intentions.
Moreover, CS and loyalty were also initiated to have a negative association in this study, showing that the satisfied customer will not launch the complaint. Also, lowering the degree of customer complaints will lead the improved customer loyalty. These findings may provide a new avenue for the researchers to examine the customer repurchase intention in the future using the current conceptual model.
Practical Implications
This research will be useful to managers and practitioners in internet firms who seek to develop positive sentiments toward their companies. According to the findings, for practitioners to raise consumer satisfaction, they must establish efforts to improve their e-commerce platform’s overall SQ. This study empirically identified key factors affecting SQ: reliability, responsiveness, trust, personalization, and WD. As a result, they must devote resources to actions that improve the SQ of their operations, resulting in increased consumer satisfaction in e-commerce. Satisfy consumers stay in touch with the company longer and buy items or services more frequently than unsatisfied customers. So that the loyalty of the customers increases toward online shopping using e-commerce platforms.
Users’ demand for personalized services has increased as more internet technologies enter the market. As a result, e-commerce service providers must modify their solutions to meet the needs of their clients. So that the customers would be able to get their desired product or services while using e-commerce, it may also assist in reducing the customer complaints and increase customer loyalty. As a result, from a managerial standpoint, this analysis will identify areas where their e-commerce platform may be improved.
Limitations and Future Prospects
Aside from the contribution, there are certain drawbacks to this study that can be addressed in the upcoming study. First, the outcomes were analyzed for users of the e-commerce platform only from Division Bahawalpur, Pakistan. Future studies might be undertaken to test this model in different country locations, such as rural areas, to improve generalizability. Second, the literature review shows that e-SQ is a multi-faceted notion. However, just five aspects of total SQ were considered in this study: reliability, responsiveness, personalization, trust, and WD. Other elements that influence the perceived quality of e-commerce services can be included in future studies. This study only discusses customer loyalty without incorporating its core dimensions, such as behavioral loyalty and attitudinal loyalty. Therefore, future researchers can combine these dimensions to extend the current research model. Finally, because this study is cross-sectional, future researchers will conduct longitudinal studies to better understand user preferences over time.
Footnotes
Appendix
Declaration of Conflicting Interests
The author(s) declared no potential conflicts of interest with respect to the research, authorship, and/or publication of this article.
Funding
The author(s) received no financial support for the research, authorship, and/or publication of this article.