
Abstract
Green technological innovation (GTI) is critical for addressing environmental challenges and achieving sustainable development. However, its driving factors and underlying mechanisms require further exploration. In this study, the impact of nonspatial proximity—comprising cognitive, social, and technological proximity—on GTI in China’s manufacturing sector is examined. Drawing upon in-depth interview transcripts and case data from seven Chinese fine chemical enterprises, a system dynamics (SD) model is constructed, progressing from a qualitative causal loop diagram that maps the system’s feedback structure to a quantitative stock-and-flow model for simulation. This model simulates the complex interactions among nonspatial proximity dimensions and their effects on GTI over time. Sensitivity analysis reveals the effects of different proximity levels and their combinations on GTI in enterprises. The findings indicate that moderate levels of cognitive, social, and technological proximity significantly increase GTI, whereas excessive proximity may lead to organizational rigidity and inhibit innovation activities. This study not only advances the theoretical understanding in the field of GTI but also provides practical insights for manufacturing enterprises to optimize proximity management and improve GTI performance.
Keywords
Introduction
Environmental challenges, including climate change and biodiversity loss, are increasing at an unprecedented rate (L. Zhang et al., 2022). As governments worldwide are faced with the challenge of balancing economic growth and ecological conservation, they are also under tremendous pressure to prioritize environmental protection. To promote green and low-carbon transformation, technological innovation is crucial (Su et al., 2023). GTI is emerging as an important field in the current round of global industrial revolution and technological competition.
GTI refers to the development of new technologies that have a positive impact on the ecological environment, with particular emphasis on reducing pollution and environmental burdens over the entire life cycle of a product while mitigating the negative consequences of resource and energy consumption (Abdullah et al., 2016). GTI offers manufacturing enterprises the potential to resolve the challenges that arise from the frequently competing aims of economic performance and environmental performance (Rehman et al., 2021; M. Wang, Li, Li, &Wang, 2021).
Furthermore, the theory and practice of proximity can provide additional insights into GTI (Boschma, 2005; Lopolito et al., 2022). Proximity reflects the similarities of network actors in terms of space, social relations and knowledge bases. Indeed, many studies have examined the relationship between spatial proximity and GTI (Y. Q. Liu et al., 2021; Ying et al., 2021). However, the concept of proximity extends beyond mere physical distance and encompasses nonspatial dimensions such as social proximity, cognitive proximity, and technological proximity (Mattes, 2012). Nonspatial proximity is essential for building trust and for knowledge sharing, assimilation, and utilization among actors (Hung et al., 2020; Lopolito et al., 2022). Technological proximity determines the scope of knowledge that can be used for reorganization (Fleming, 2001; Wuyts & Dutta, 2014). This aspect is especially crucial for GTI because, compared with traditional technological innovation, it requires a more diversified knowledge base (Corrocher & Ozman, 2020). Additionally, interfirm networks provide enterprises with potential access to a variety of relevant and unrelated knowledge resources; however, they do not guarantee the effective transfer and assimilation of knowledge. Cognitive proximity and social proximity affect the cooperation and knowledge interaction between actors (Phelps, 2010). For example, Siemens Group Limited and CRRC Zhuzhou Electric Locomotive Co., Ltd. jointly developed an environmentally friendly electric locomotive (crrcgc.cc/zjsj). Both organizations had advanced R&D and manufacturing capabilities in the field of transportation. They considered environmental protection to be an important value, and an open and collaborative approach was used throughout the project, promoting social proximity. Another example is the partnership between Huawei and Audi, which collaborated on developing intelligent travel solutions that facilitate green travel (huawei.com). They combined their respective technological strengths despite their different technology domains. They had a similar understanding of market demands and technological trends and successfully collaborated in multiple areas. Despite a lack of spatial proximity, the success in GTI achieved by these enterprises highlights the significant role of cognitive, social, and technological proximity.
However, previous research has focused primarily on spatial proximity, paying little attention to nonspatial proximity. Although some scholars have begun to explore the impact of different dimensions of nonspatial proximity on GTI, two limitations exist. First, most studies focus only on the linear effects of a single dimension and neglect the complex interactions and intrinsic links among cognitive, social, and technological proximity. Second, debate continues over whether proximity promotes or inhibits GTI in enterprises (Ardito et al., 2019; Liao, 2018). Moreover, because the prevailing research methods are predominantly static, they are unable to reveal the dynamic process of proximity’s influence over time. Therefore, the focus of this study is the following two questions:
(1) How do social, cognitive and technological proximity influence GTI?
(2) Does a higher degree of nonspatial proximity result in greater GTI performance?
To answer these questions, we explore the transmission pathway through which social proximity, cognitive proximity, and technological proximity influence GTI. Using system dynamics (SD) modeling, we simulate the transmission pathways and interactions among these nonspatial proximity dimensions. Sensitivity analysis further reveals how different proximity levels and their combinations impact GTI in manufacturing enterprises. Our theoretical contributions are twofold. First, from a multidimensional and integrated perspective, we investigate not only the role of individual proximity dimensions but also their feedback relationships and combined effects on GTI, thereby complementing the literature on the interaction of nonspatial proximity. Second, by introducing the SD modeling method, we are able to simulate the complete conduction path and long-term evolutionary behavior of proximity’s impact on GTI.
The remaining sections of the paper are organized as follows. In the second section, we perform a rigorous literature review. The third section focuses on the research design, which includes the construction of the SD model and system simulation. The fourth section presents a discussion of the findings, provides implications, identifies limitations, and suggests avenues for future research.
Literature Review
Existing studies have investigated the relationship between proximity and GTI from various perspectives. The following is a literature review based on the two aspects of GTI and proximity.
GTI
Compared with conventional technological innovation, GTI increases the positive externalities for ecological environmental protection while building upon technological progress. Because of its extra environmental externalities, GTI differs from conventional technological innovation in many respects. For example, it increases uncertainty throughout the innovation process (L. Chen et al., 2023; J. Liu et al., 2020) and heightens the interactions among enterprises and different stakeholders along the industrial chain (D. Hu, Jiao, et al., 2022). Additionally, more complex and diverse knowledge and technologies are required for GTI than for other forms of innovation (Arfi et al., 2018).
Because of the effects of GTI on the economy and the environment, research on the driving factors of GTI has increased. The driving factors of GTI is summarized in Table 1. These factors can be systematically categorized into two main groups: external drivers, such as stakeholder pressure, laws and regulations, market demand, and government incentives; and internal drivers, including the enterprise’s resource endowment, managerial commitment, organizational learning, and absorptive capacity. Among the many factors, the driving role of the network and its multidimensional proximity in GTI have recently become the focus of scholarly inquiry (Ardito et al., 2019; Han & Xu, 2021; Y. Q. Liu et al., 2021). Many GTIs are the result of cooperation at different levels between different organizations. However, little is known about its internal operating mechanisms, especially how nonspatial proximity dynamically promotes or inhibits knowledge sharing and collaborative innovation.
Antecedents of GTI.

From Spatial Proximity to Nonspatial Proximity
As the study of proximity has progressed, the research focus has expanded beyond spatial proximity to nonspatial dimensions. The French School of Proximity Dynamics, represented by Shaw and Gilly (2000) and Torre and Rallet (2005), has played a vital role in this development. Nonspatial proximity is a complex concept with multidimensional implications that can influence collaborative innovation by altering knowledge-sharing advantages, problem-solving methods, and goal effectiveness (Boschma, 2005). However, due to the varying perspectives and objectives of existing research, there is overlap among various dimensions of proximity. Thus, Knoben and Oerlemans (2006) classified and integrated multidimensional proximity levels and dimensions and divided nonspatial proximity with an impact on innovation at the organizational level into cognitive proximity, social proximity, and technological proximity.
Many scholars have identified the correlation between spatial proximity and GTI (Ardito et al., 2019; C. Hu et al., 2021; Y. Q. Liu et al., 2021). The primary significance of spatial proximity lies in the fact that it facilitates the convergence of nonspatial distances. With the advancement of information technology, emerging research increasingly emphasizes the role of nonspatial proximity. Scholars such as Hansen (2014) and Lopolito et al. (2022) have highlighted the crucial importance of different dimensions of proximity for GTI. Nonspatial proximity, including the cognitive, social, and technological dimensions, plays a fundamental role in innovation and collaborative learning processes. Scholars have employed various methods, such as case studies (Tsouri et al., 2022), econometric models (Aldieri et al., 2020; Ardito et al., 2019), and social network analysis (Ma et al., 2022), to verify the effectiveness of different proximity dimensions. However, there is a debate among scholars over whether proximity promotes or inhibits GTI. Some scholars support the “innovation paradox” theory, which suggests that an appropriate proximity can promote the formation of knowledge networks but does not necessarily lead to excellent innovation performance (Broekel & Boschma, 2012; Cassi & Plunket, 2014). In contrast, other scholars argue that proximity is beneficial for the innovation output of enterprises (Jespersen et al., 2018; O’Connor et al., 2021).
Social proximity refers to a level of social embedding that originates from shared experiences, friendships, and kinship ties and that leads to the subsequent development of trust within a network (Boschma, 2005). The concept of social proximity is closely tied to network embedding and involves the social relationships between organizations that engender trust. Social proximity serves a critical function in fostering interactive learning and innovation (Boschma, 2005), and it facilitates the formation of the foundation of the trust required for effective cooperation (Boschma & Frenken, 2010). Juo and Wang (2022) revealed that social proximity exerts a favorable influence on green innovation, particularly with respect to green development-oriented innovation. Ali et al. (2023) proposed that social proximity stimulates the adoption of green innovation, while increased absorptive capacity bolsters the positive correlation between social relationships and the uptake of green innovation. Nevertheless, some studies have identified issues stemming from the network paradox, where the dark side of social proximity emerges when it is excessively high (Hurtado-Palomino et al., 2022). Letaifa and Rabeau (2013) noted that social proximity may increase the hazard of opportunistic behavior and isolate external parties through novel idea exploitation within insular social networks. As organizations acquire more resources, their ability to process information at the individual, team, and organizational levels becomes constrained, which increases organizational rigidity (Soltwisch, 2015).
Cognitive proximity refers to the similarity in perceptions of cooperative goals and organizational cultures (Inkpen & Tsang, 2005; Nahapiet & Ghoshal, 1998). It fosters mutual comprehension and communication between organizations by reducing uncertainty in communication (Nooteboom, 2000). Cognitive proximity ensures the effectiveness of knowledge sharing by making it easier for all parties to understand and absorb new knowledge and to jointly commit to sustainable development goals (Blasi et al., 2024). Han and Xu (2021) selected 211 small and medium-sized fine chemical enterprises in China and discovered that cognitive proximity can promote the cocreation of green value, thus enhancing the innovation performance of green products. P. C. Chen and Hung (2014) analyzed the relationship capital of 237 Taiwanese enterprises and reported that it plays a vital role in green management. Liao (2018) conducted an empirical study using 21 manufacturing companies as samples and reported that social proximity has a positive effect on environmental innovation, whereas cognitive proximity has no significant effect. Nilsson (2019) noted that social proximity is more likely to develop where cognitive proximity exists. P. C. Chen and Hung (2014) demonstrated that cognitive proximity exerts a favorable influence on social proximity.
Technological proximity is commonly defined as the degree of similarity between two firms in terms of their technological foundations and infrastructural knowledge assets, reflecting the overlap between their knowledge bases and technological structures (Shi et al., 2024). C. X. Liu et al. (2024) corroborated that technological proximity is indispensable for effective collaboration and is customarily inferred from patent concordance. Technological proximity plays a pivotal role in green technology innovation (Y. Q. Liu et al., 2021), and its influence on GTI remains stable and consistent (Khunakornbodintr, 2024). A moderate level of technological proximity creates tension between a shared knowledge base and heterogeneous complementary knowledge, introducing novel complementary knowledge and enabling collaborating parties to generate new technologies and methods during cooperation (Květoň et al., 2022; Shi et al., 2024). High technological proximity facilitates knowledge complementarity, thereby accelerating the success of exploration and the acquisition of novel technologies (Boschma, 2017; Khunakornbodintr, 2024). Caviggioli et al. (2023) contended that technological similarity engenders substantial knowledge overlap among participants, thereby attenuating cognitive barriers and facilitating frictionless knowledge diffusion, which in turn drives innovation. However, some studies express a contrary view. Guan and Yan (2016) posited that an overly short technological distance may heighten knowledge homogeneity, engender redundancy and cognitive lock-in, and thereby undermine the innovative value derived from the recombination of heterogeneous knowledge.
Summary
Accordingly, nonspatial proximity, including the cognitive, social, and technological dimensions, plays an important role in innovation and collaborative learning processes (Aldieri et al., 2020; Ardito et al., 2019; Ma et al., 2022; Tsouri et al., 2022;). However, research has focused on spatial proximity (Ardito et al., 2019; C. Hu et al., 2021; Y. Q. Liu et al., 2021), with little attention given to nonspatial proximity. Some scholars have discussed the impact of different nonspatial proximity dimensions on GTI (Ali et al., 2023; Han & Xu, 2021; Juo & Wang, 2022; Y. Li et al., 2021), but their research has usually focused on one or two dimensions of nonspatial proximity, and there is limited research on the role of multidimensional proximity in promoting GTI in manufacturing enterprises. Scholars have emphasized the importance of different dimensions of proximity for GTI (Lopolito et al., 2022), but they still debate whether proximity promotes or inhibits GTI (Ardito et al., 2019; Letaifa & Rabeau, 2013; Liao, 2018). Finally, the process of enterprise GTI is a complex systemic issue that involves various internal mechanisms, such as green knowledge sharing, green project cooperation, and green absorptive capacity (Cui et al., 2021; M. Song et al., 2020). However, most scholars focus on verifying the proximity effect, whereas little is known about its conduction path. Therefore, it is impossible to test the proximity effect dynamically, which impacts the scientific formulation and flexible application of GTI strategies.
Research Design
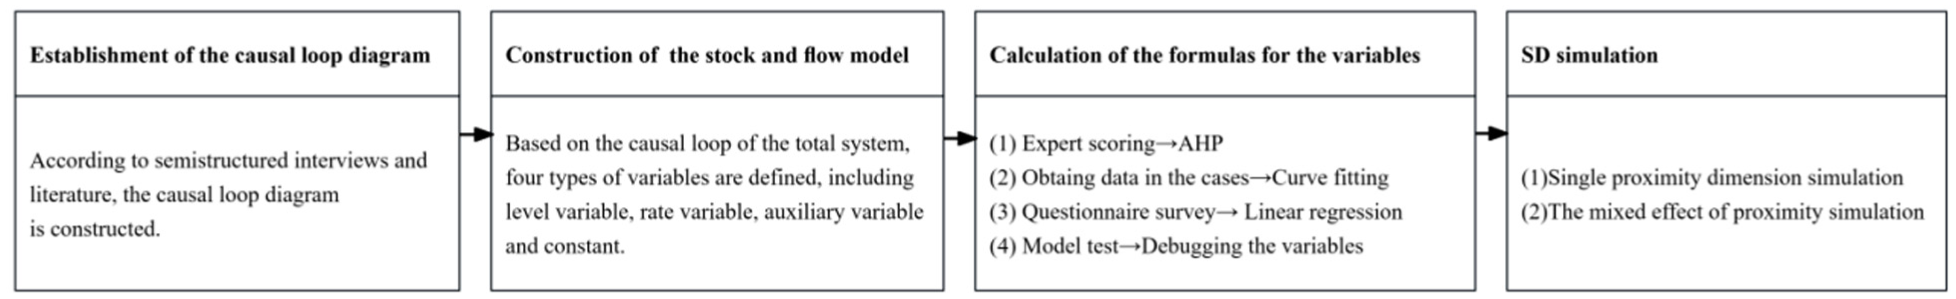
The SD model was proposed by American scholar Jay W. Forrester in World Dynamics in 1971. SD is a process-oriented research method that uses stocks, flows, table functions, and time delays to explore the nonlinear behavior of complex systems over time through internal feedback loops. Researchers in different fields have used SD to reveal the intrinsic relationships in various complex systems. In particular, an increasing number of applications of SD are in the field of green technological innovation (Eghbali et al., 2022; M. Wang, Li, Cheng, et al., 2021; Wu et al., 2021). Leveraging the theoretical framework and methodology of information feedback, SD is used to extensively analyze the internal mechanisms and dynamic behavior of complex systems (Zhong & Lin, 2022). Therefore, SD is an effective approach for studying multidimensional proximity and GTI. The research framework is depicted in Figure 1. Our research process involves four main steps, as illustrated in Figure 1.
Step 1: Establishment of the causal loop diagram. Drawing on a thorough literature review and using qualitative data from the case study, we first identify the key variables influencing GTI and map the causal relationships between them to construct a causal loop diagram.
Step 2: Construction of the stock and flow model. The causal loop diagram is then quantified and transformed into a stock and flow model. This involves defining variables as stocks (accumulations), flows (rates of change), and auxiliary variables to formalize the system’s structure.
Step 3: Calculation of the formulas for the variables. We then develop mathematical equations for each variable in the model. The parameters and initial values for these equations are derived from multiple sources, including expert scoring using the analytic hierarchy process (AHP), curve fitting, linear regression based on survey data, and information from the case companies. The model is then tested and debugged to ensure that its behavior aligns with real-world observations.
Step 4: SD simulation. Finally, we use the validated model to conduct simulation experiments. By systematically changing the parameters for different proximity dimensions, we analyze the impact of single and mixed proximity strategies on the evolution of enterprise GTI over time.
Research steps of the SD simulation.
Data Collection and Processing
Data Sources
This study aimed to investigate the impact of the nonspatial proximity among enterprises on GTI. The incomplete nature of pathway factors and the difficulty of obtaining empirical data pose challenges to conducting empirical research on the intricate relationships among factors. However, by employing field research, this study can extract critical information from qualitative data and identify the interconnections between factors, thus establishing the groundwork for constructing simulation models. We chose Chinese fine chemical enterprises as research samples. China’s fine chemical industry serves as an excellent example for several reasons.
First, fine chemical enterprises are a quintessential example of traditional manufacturing sectors under intense pressure to engage in green transformation. These enterprises are characterized by levels of high pollution and energy consumption, subjecting them to stringent environmental regulations and immense public pressure. In this context, GTI is not merely an option; it is a critical necessity for survival and sustainable development. This situation is highly representative of the challenges faced by numerous other manufacturing industries, such as textiles, steel, and papermaking.
Second, the industry’s structure makes it an ideal setting in which to study nonspatial proximity. The fine chemical industry has strong vertical and horizontal linkages along its supply chain, meaning that enterprises are deeply embedded in a network of external partners. Consequently, successful GTI is rarely achieved in isolation and depends heavily on effective collaboration and knowledge sharing with these partners. This high dependency on interfirm networks makes the fine chemical industry a perfect setting for observing how proximity dimensions (cognitive, social, and technological) facilitate or hinder GTI.
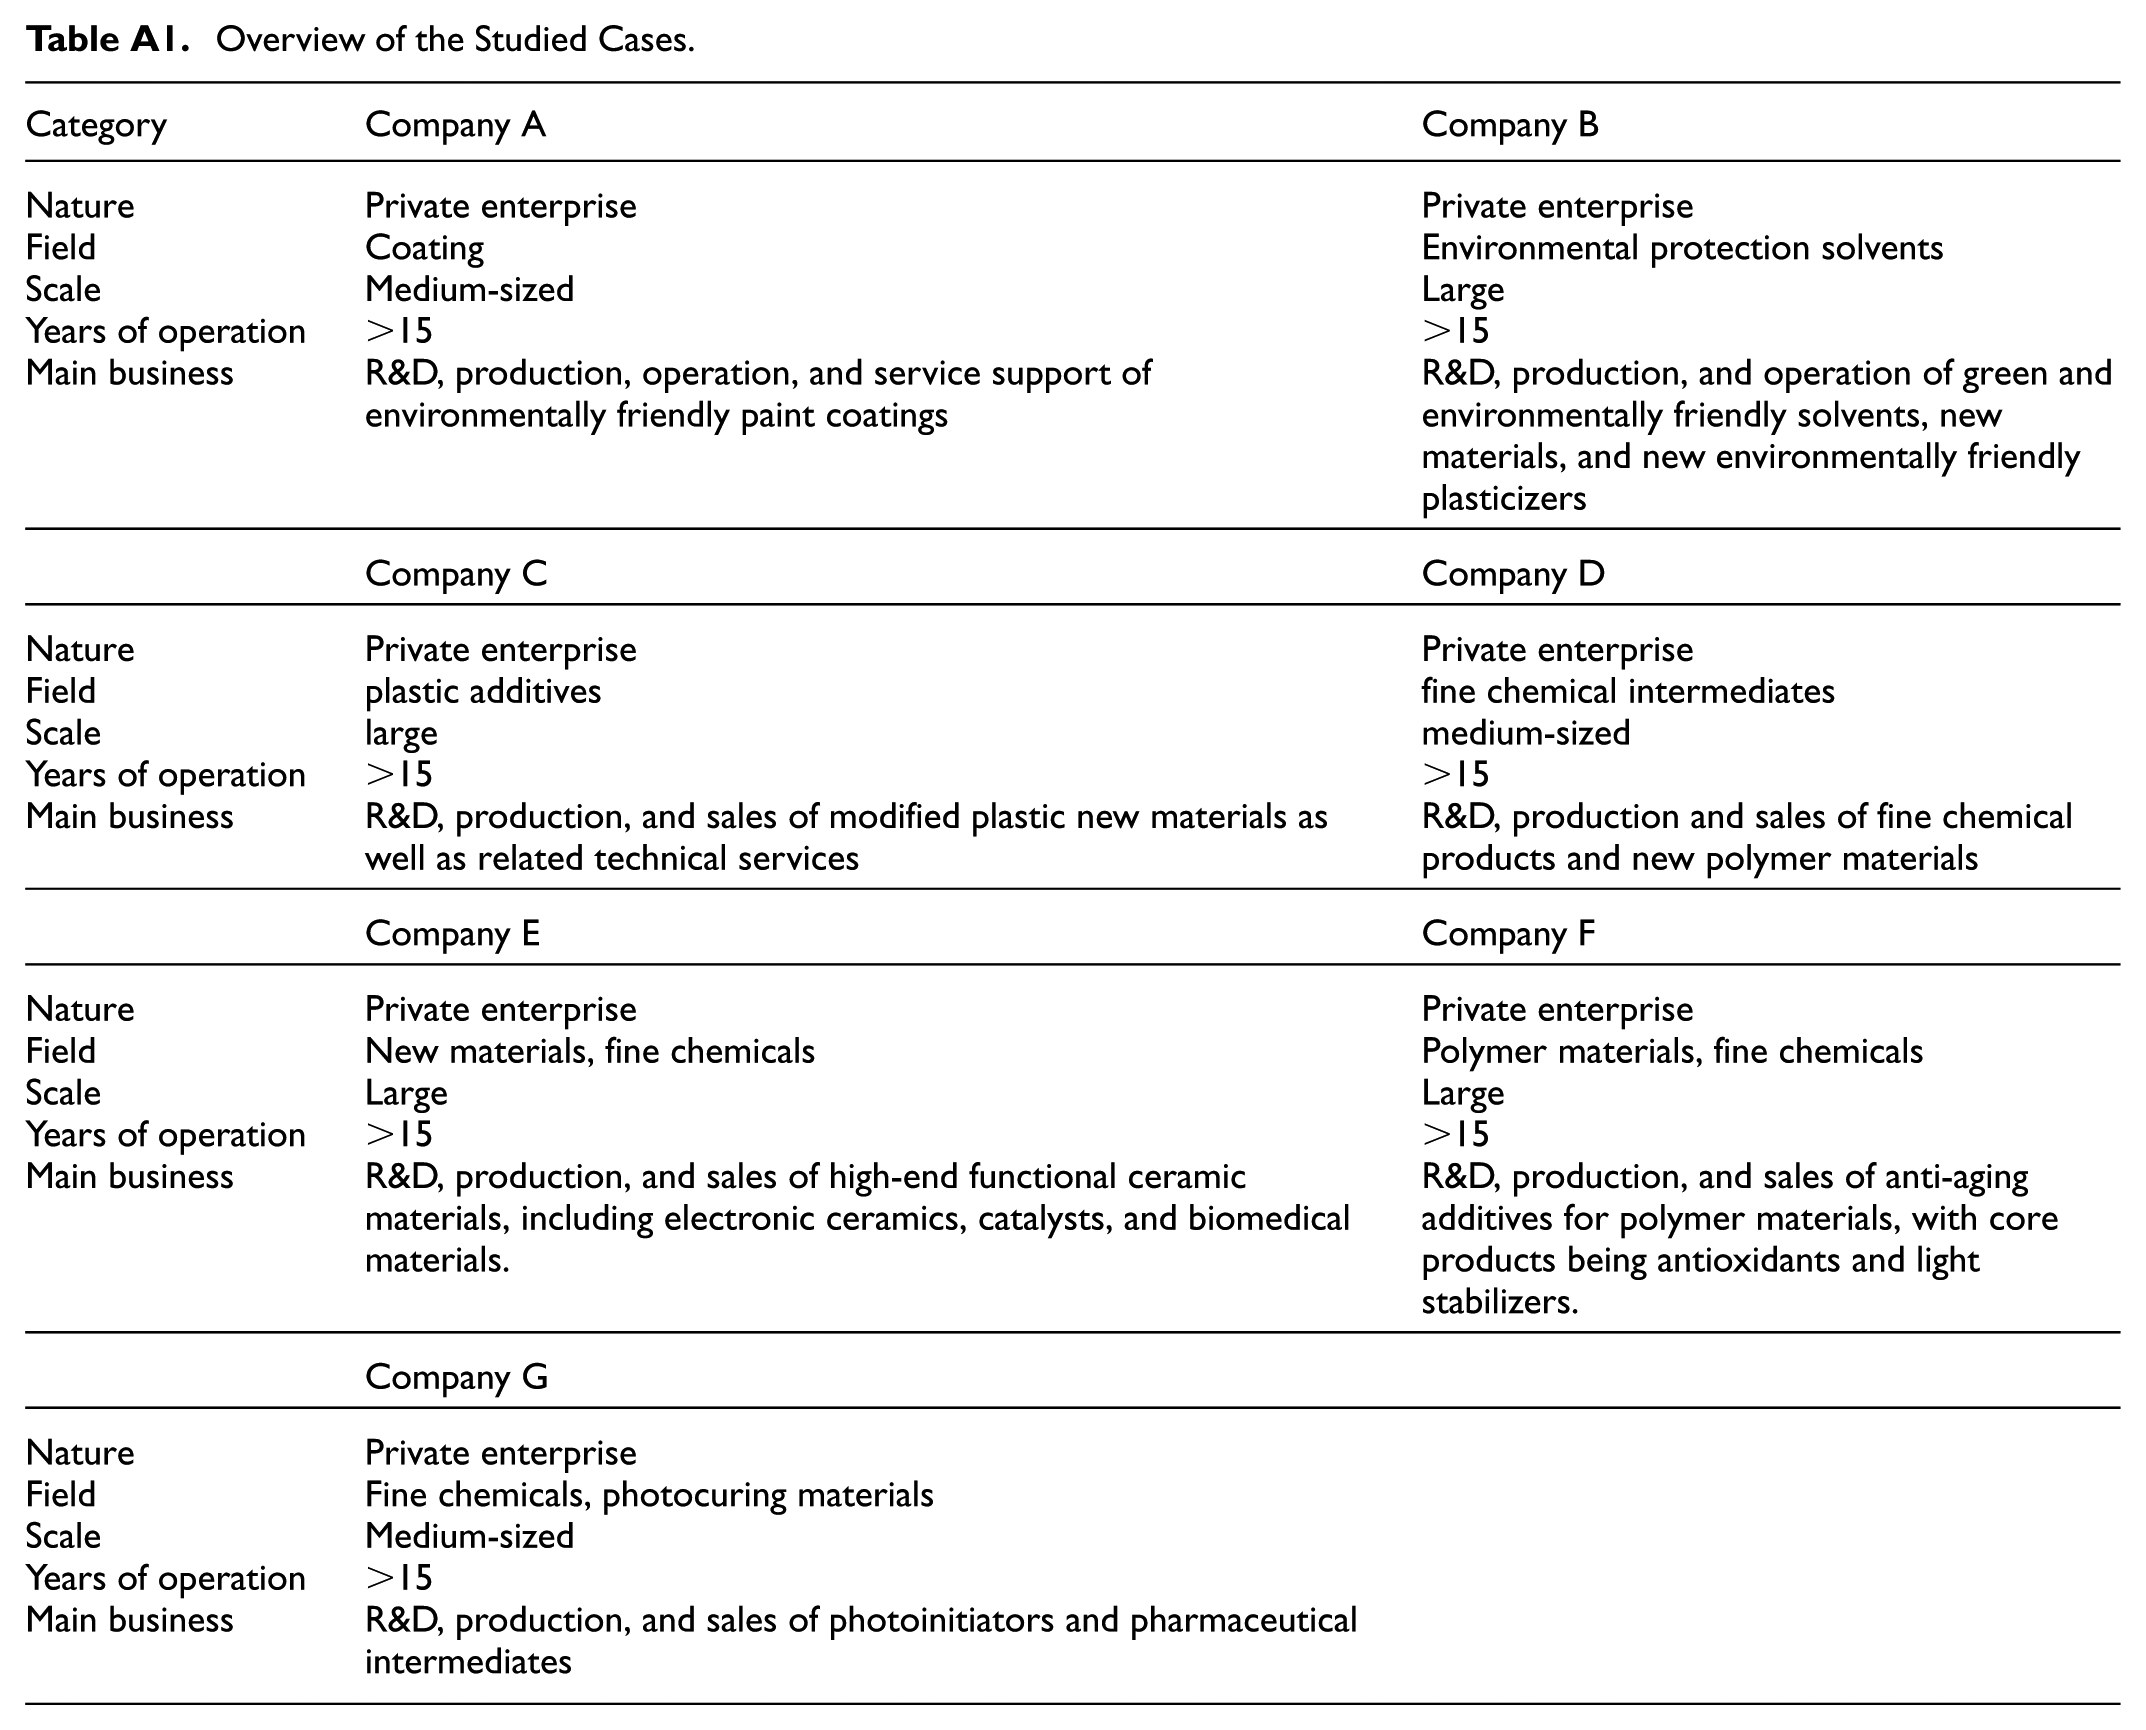
The selection criteria for the surveyed companies were as follows. First, the chosen companies must be able to engage in green product R&D without considering service providers, technology suppliers, public utilities, and retailers. Second, the companies must originate from different positions along the refined chemical industrial chain and demonstrate representative and typical factors. This study included seven surveyed companies from the paint industry, eco-friendly solvent industry, plastic additive industry, chemical intermediate industry, etc. The selection was representative and typical, resulting in multiple verification effects and guaranteeing the external validity of the study. The situations of the studied cases are shown in Table A1.
The selected enterprises have engaged in eco-friendly product research and acquired ISO9001 quality management system certification, ISO014001 environmental management system certification, and OHSAS18001 occupational health and safety management system certification. Furthermore, their environmental impact assessment reports are made publicly available on their official websites, and they have been recognized as green factories by China’s Ministry of Industry and Information Technology.
The data for the case study primarily came from two sources. First, we collected data from official company websites, media and public reports about company conditions, company promotional videos, company brochures, company annual reports, and internal publications. Second, during 2023 and 2024, we conducted semistructured interviews with 17 interviewees, including executives from the seven companies, totaling 23 interviews lasting an average of 70 min each. Snowball sampling was used to identify the interviewees for each case company (Flyvbjerg, 2006). Detailed descriptions are provided in Table 2. See Appendix B for the expert interview questionnaire.
Interviews.

To improve the accuracy and validity of the study results, we employed the triangulation method, which involves the use of multiple methods, such as interviews, observations, and document analysis, to check the consistency of the research findings and to cross-check different sources of data to ensure their consistency.
The primary risk to participants—executives and managers—was potential professional or commercial harm resulting from the disclosure of sensitive company information. To mitigate this risk, all participants and their respective companies were anonymized at the earliest stage of data analysis. Company names were replaced with pseudonyms (e.g., Company A, Company B), and any identifying details were removed from the interview transcripts to ensure complete confidentiality. Furthermore, interview questions were strictly focused on organizational strategies and professional insights, avoiding sensitive personal data. Participants were also explicitly informed of their right to withdraw from the study at any point without penalty.
The potential benefits of this research significantly outweigh the minimal risks involved. For society, the study offers crucial insights into fostering green technological innovation, a key factor in achieving sustainable development and addressing global environmental challenges. For the participating organizations and individuals, the findings provide actionable strategies to improve inter-firm collaboration and enhance their green innovation performance, contributing to both their competitive advantage and corporate social responsibility goals.
Verbal informed consent was obtained from all 17 interviewees before the start of each interview. Prior to giving consent, each participant was provided with a clear and comprehensive explanation of the study’s objectives, the voluntary nature of their participation, the interview process, the estimated time commitment, and the rigorous confidentiality and anonymization procedures that would be used. With their permission, consent was audibly recorded at the beginning of each interview session.
Data Processing
To systematically transform the qualitative textual data from interviews and case materials into a structural model suitable for SD analysis, this study adopted the coding procedures of grounded theory. This methodology provides a rigorous, step-by-step process to define key concepts, discover categories, and construct a theoretical framework from the raw data, forming the crucial bridge between qualitative evidence and quantitative modeling.
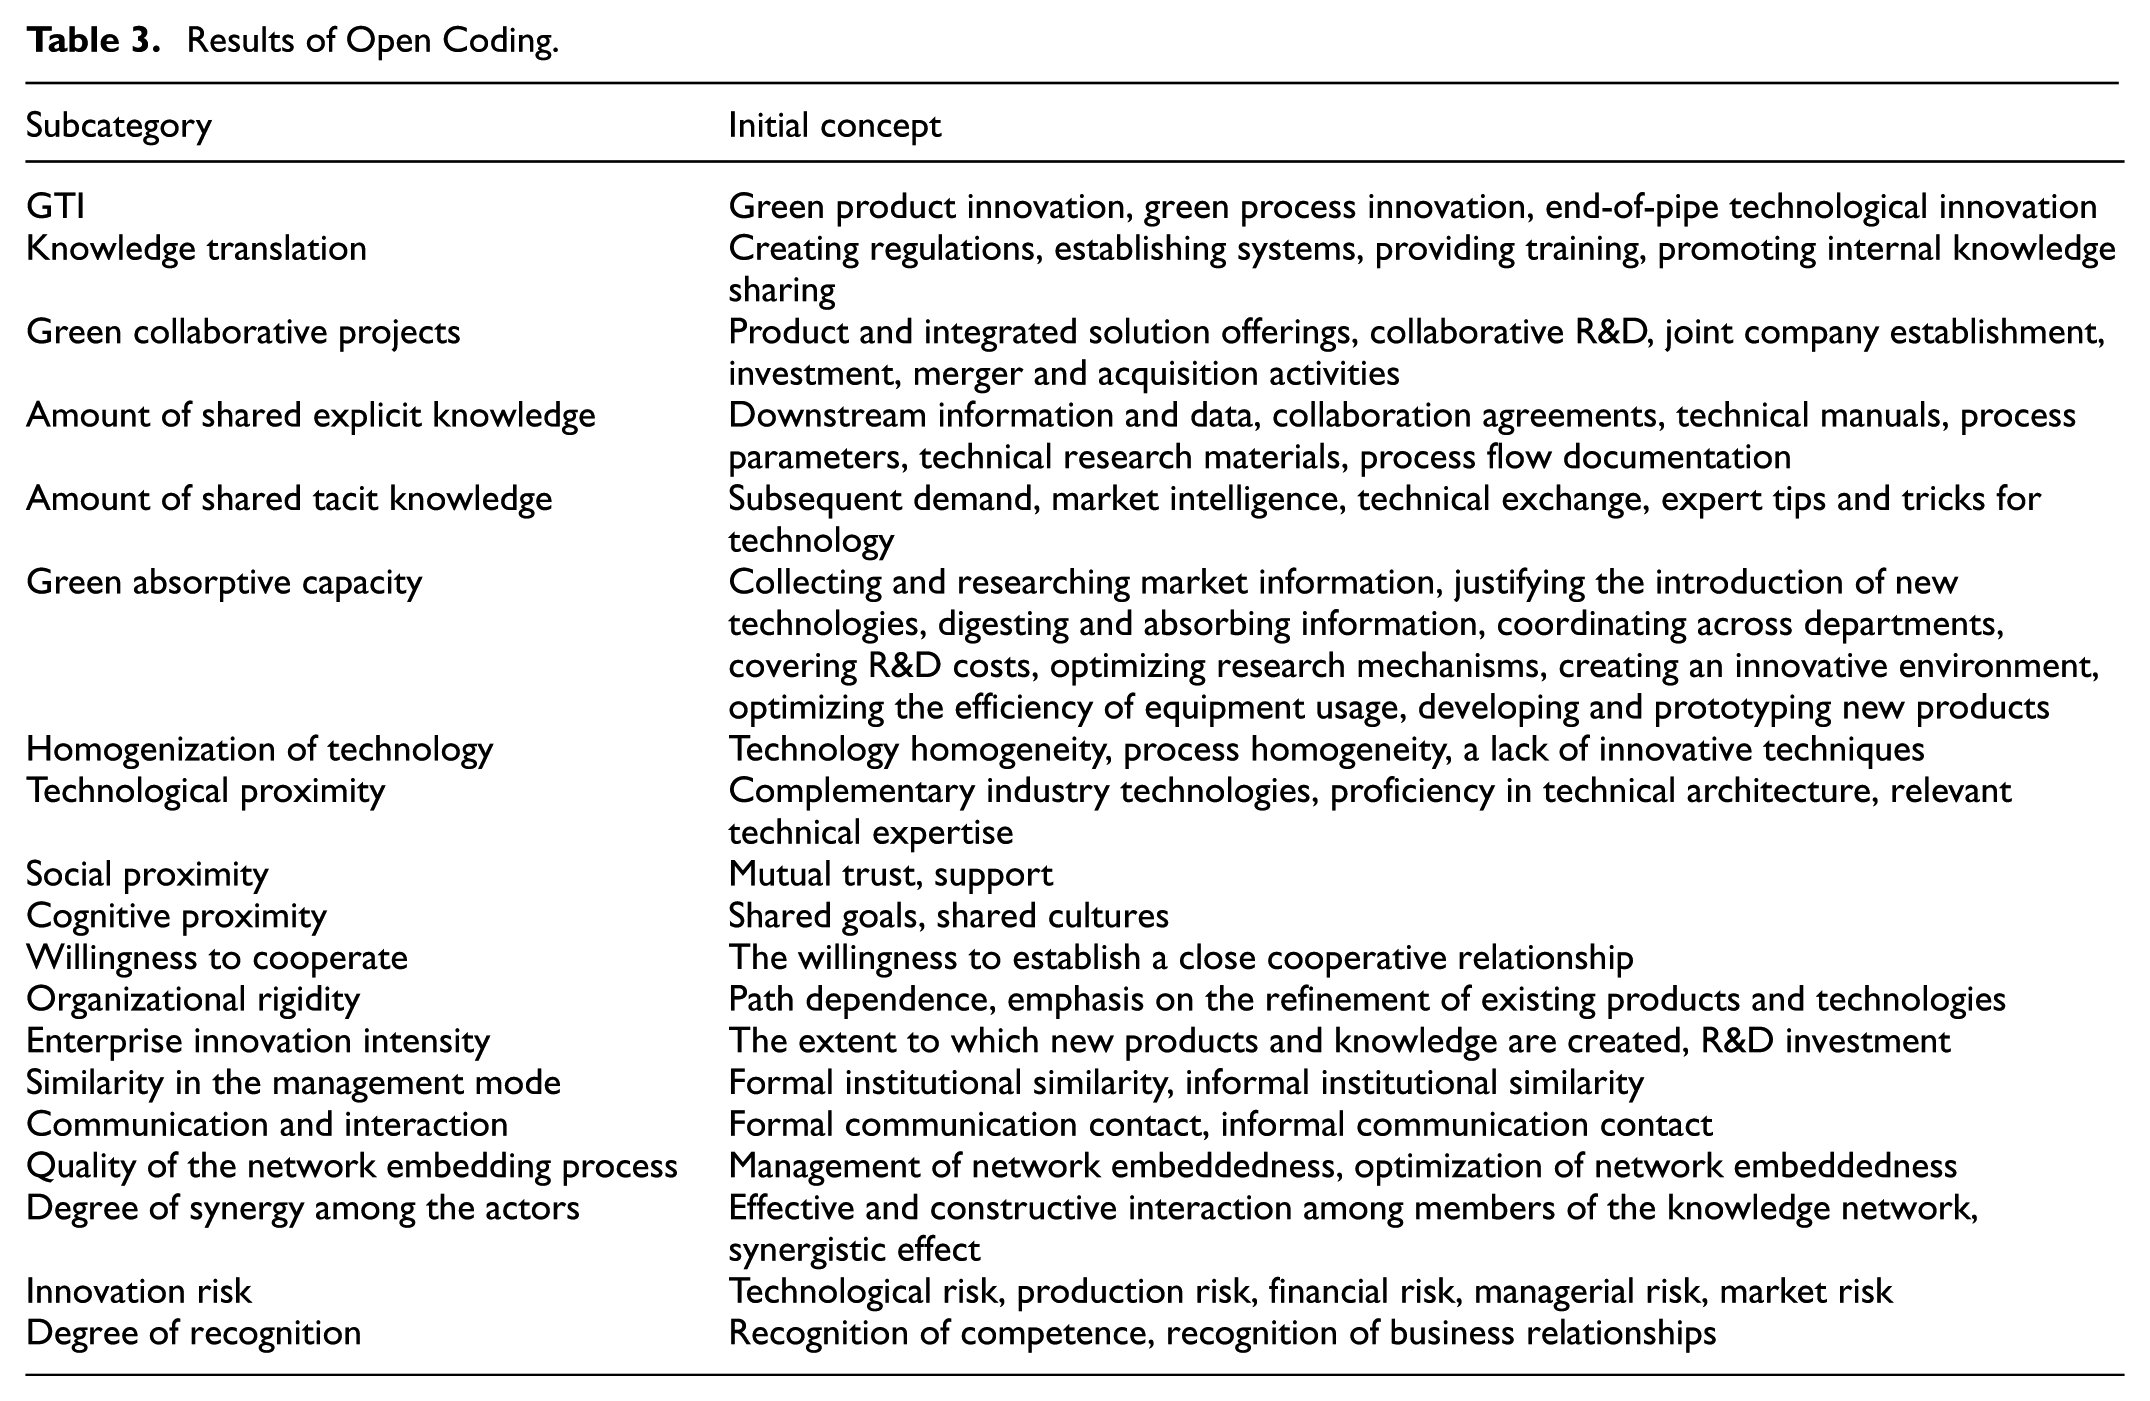
The process involved three sequential stages. First, open coding is the process of analyzing and comparing raw data to define corresponding concepts and discover categories. After the information provided by the raw data are fully explored, the concepts that best match the sample events are organized and categorized. Through open coding, 63 concepts under 19 categories were identified. Detailed descriptions are provided in Table 3.
Results of Open Coding.
Next, axial coding is used to analyze and classify the categories formed by open coding. By identifying the inherent logical connections between categories, the data segmented in open coding can be reassembled, and the main categories relevant to the research problem can be extracted. This coding resulted in six major relational categories, as shown in Table 4.
Results of Axial Coding.

Finally, selective coding is a theoretical construction process based on the coding work of the previous two stages. Through repeated comparative analysis of all categories and the main categories, we found that using the core category “the mechanism of the impact of proximity on GTI” coordinates other categories and explains the core issues of this research. Five categories, that is, knowledge sharing, proximity, enterprise innovation capability, knowledge network, and innovation cooperation, are causally related to enterprise GTI. Proximity becomes the antecedent variable among the many variable relationships, enabling more and easier successful opportunities for enterprise innovation cooperation, influencing enterprise innovation capability, and increasing the quantity and quality of knowledge sharing, thereby benefiting enterprise GTI. Additionally, enterprises’ efforts to improve their knowledge network will continuously increase proximity, influencing innovation cooperation and knowledge sharing. Through the mutual influence of these variables, enterprises can increase their GTI performance. The model is constructed on the basis of the results of grounded theory analysis and the case study practice materials, as illustrated in Figure 2.

Models from selective coding.
However, building a runnable SD model requires not only this qualitative structure but also the quantification of these relationships through mathematical equations and parameters. This was achieved by using a complementary set of methods—including expert scoring via AHP, linear regression on survey data, and information from the case companies—to define the specific functions and initial values for the simulation.
SD Model Construction
On the basis of the analysis of the interview content, we proceeded with SD simulation modeling.
Causal Loop Diagram
First, we constructed the causal loop diagram shown in Figure 3. A causal loop diagram is used to visualize the feedback structure of a system. It consists of variables connected by arrows, which represent the causal influences among them. Each arrow is assigned a polarity (“+” or “−”) to indicate the nature of the relationship. These causal links combine to form feedback loops, which are closed paths of cause and effect that drive the system’s dynamic behavior. Table 5 shows the main feedback loops of the system.

Causal loop diagram of the GTI system.
Main Feedback Loops of the System.

Stock-Flow Model
Gaining an in-depth understanding of stock–flow models is essential for comprehending dynamic systems and their underlying mechanisms, as stocks and flows together constitute the operational framework of dynamic systems (Hendijani et al., 2023). The stock–flow model is illustrated in Figure 4. The stock-flow model includes four main types of variables. The level variable refers to the cumulative quantity in the dynamic process. The rate variable represents the rate of change in the level variable. The auxiliary variable connects various possible relationships and is an intermediate variable in the process of information transmission and transformation. The constant is an independent number that does not change over time and has no time coordinate in its formula. Table 6 shows the variables of the SD model and their types.

The stock–flow model of the GTI system.
Main Variables of the SD Model.

Main Variables
In this study, we built simulation equations using the DYNAMO program, which is part of Vensim software. The simulation model is characterized not by its degree of truth and accuracy but rather by its usefulness in describing the internal rules that govern change (Fang et al., 2018; Wang et al., 2021). Therefore, in terms of setting the parameters for the SD models, we focused on analyzing the behavioral trends of the entire system and the driving mechanism of proximity. The parameters of the variables were obtained via the analytic hierarchy process (AHP; Bu et al., 2020; Sahlol et al., 2021), curve fitting (Wu et al., 2021), linear regression on the basis of previous questionnaire survey data (Wu et al., 2021; X. Zhou et al., 2020), and information collected from experts, databases and the literature (Berrio-Giraldo et al., 2021; X. Gao et al., 2015). In addition, we constantly debugged the variables on the basis of reference behavioral characteristics so that the stock-flow flow model can better simulate the relationships among the variables and be commensurate with the reality of the enterprise GTI system. The equations of the main variables are constructed as follows.
The level variable is the time accumulation of flow changes, which is represented by an integral equation. The equation of collaborative projects is given in Equation 1.
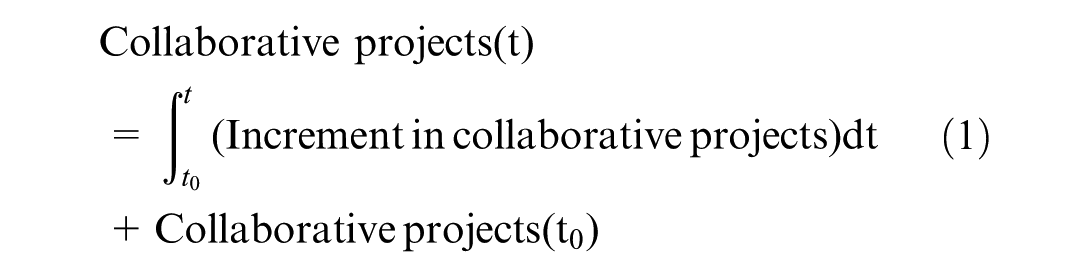
where the increase in collaborative projects is the amount of change at any time between the initial time (t0) and the current time (t), and collaborative projects (t0) are the level value at time (t0). According to the survey, the average value of collaborative projects is in the range of 0 to 10; thus, it is assumed that the initial value of collaborative projects is 1.
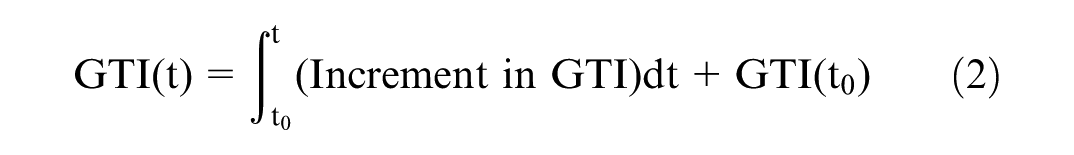
The GTI equation is given in Equation 2. GTI (t0) represents the initial value of GTI. According to the survey, the cumulative value of the number of green technology patents applied for by enterprises in the last 10 years is 7 to 35; thus, it is assumed that the initial value of GTI is 7.
We used the relevant influencing factors to build the functional relationships of variables such as cognitive proximity, social proximity, the amount of change in tacit knowledge, the amount of change in explicit knowledge, and the degree of synergy among the actors. The AHP was used to assign different weights to the influencing factors as coefficients to obtain the variable equation (Bu et al., 2020; Sahlol et al., 2021).
Seventeen expert consultation questionnaires were distributed, including 10 among the enterprise experts interviewed in the early stage and 7 among teachers from different universities in related disciplines. Seventeen valid questionnaires were recovered, for an effective response rate of 100% and 100% expert positivity. Before the experts scored, the experts were shown how these influencing factors drive the text data of enterprise GTI as a reference for the expert scoring process. Next, the specific steps included the construction of the judgment matrix, the calculation of the judgment matrix, and the consistency test. The weight coefficient value of each index was finally obtained, as shown in Table 7.
The Weight Coefficient Value.

Therefore, the equation of cognitive proximity is shown in Equation 3.

Social proximity is influenced by cognitive proximity, collaborative projects and the degree of recognition. The social proximity equation is given in Equation 4.

Changes in explicit knowledge are influenced by the amount of change from tacit knowledge to explicit knowledge, the homogenization of technology, organizational rigidity, green absorptive capacity, and the amount of shared explicit knowledge. The equation is given in Equation 5.
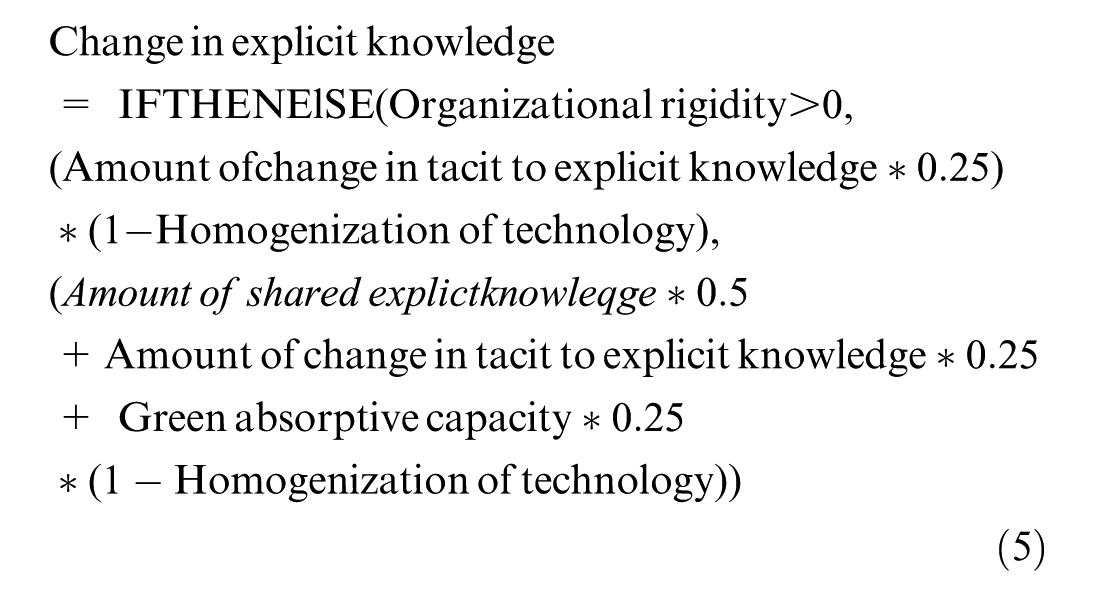
The idea underlying the construction of the equation is as follows. When organizational rigidity emerges, it acts as a suppressant to change in explicit knowledge and impedes the generation of new explicit knowledge. At this time, the coefficient of the amount of change in tacit to explicit knowledge is obtained by regression. When organizational rigidity is zero, the amount of change in explicit knowledge is jointly influenced by the amount of shared explicit knowledge, the amount of change in tacit to explicit knowledge, green absorptive capacity, and the homogenization of technology. Among these factors, the homogenization of technology has the opposite effect on the amount of change in explicit knowledge. The coefficients of the amount of shared explicit knowledge, the amount of change in tacit knowledge to explicit knowledge and green absorptive capacity are assigned the weight coefficient values from Table 8.
Comparison Between the Actual Values and Simulated Values.
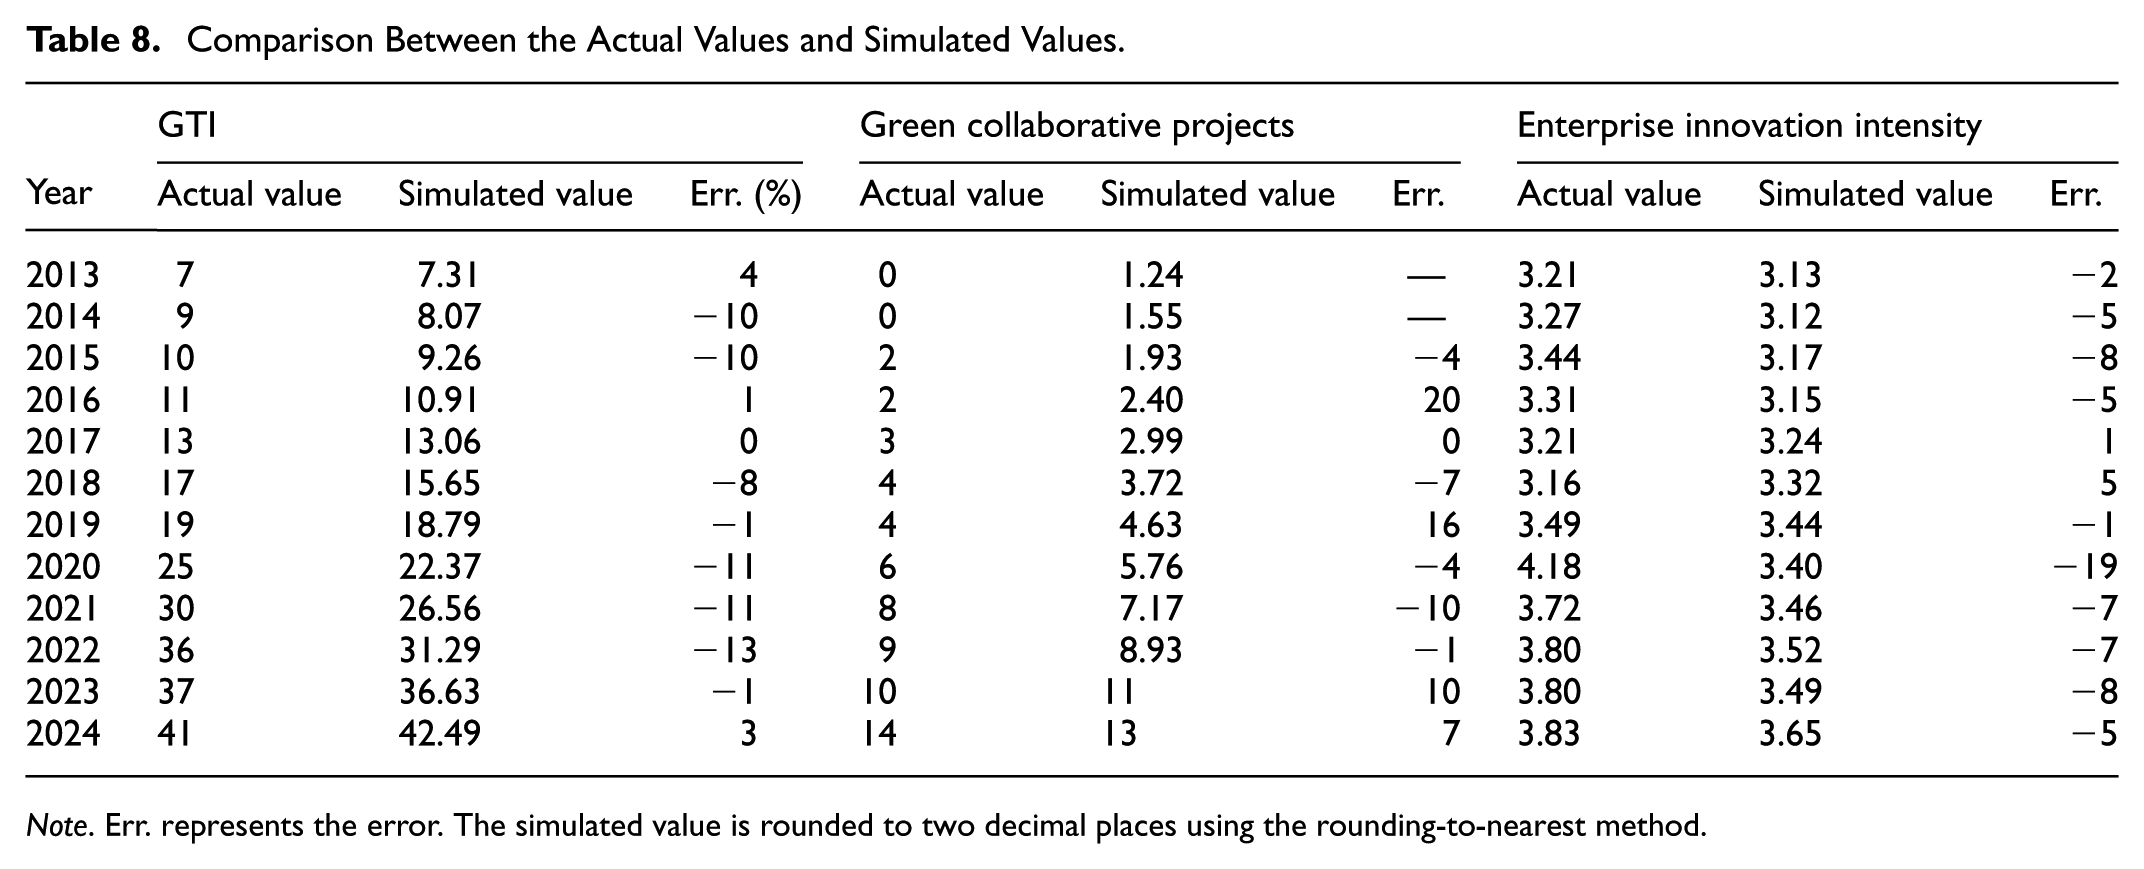
Note. Err. represents the error. The simulated value is rounded to two decimal places using the rounding-to-nearest method.
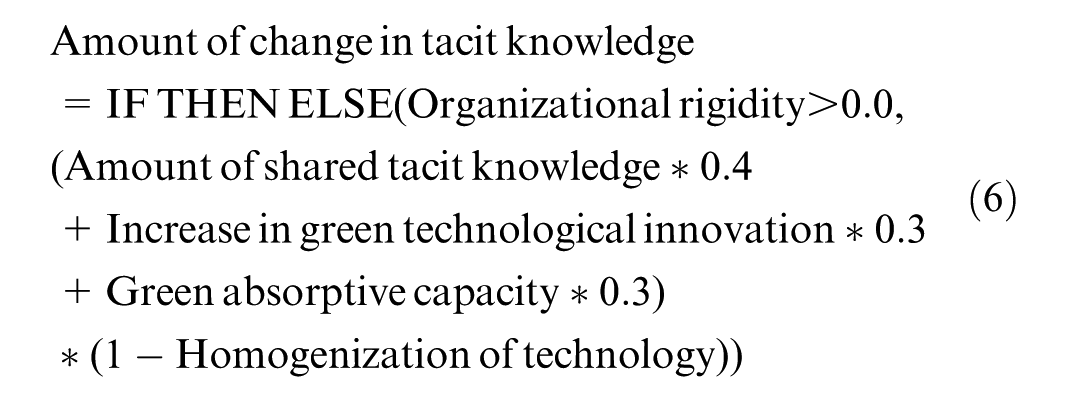
The amount of change in tacit knowledge is influenced by organizational rigidity, the amount of shared tacit knowledge, the increase in GTI, green absorptive capacity and the homogenization of technology. The equation is given in Equation 6.
The degree of synergy among the actors is influenced by social proximity and cognitive proximity. Their coefficients are assigned the weight coefficient values from the AHP. The equation is given in Equation 7.

Technological proximity is calculated using a ramp function, with the normalized mean obtained from the previous questionnaire survey and statistics set as the initial value. Through the Delphi method, which is based on the comprehensive judgments of 17 experts, the level of technological proximity is expected to reach 90% of its current value after 20 years. Technological proximity changes gradually. On the one hand, the degree of change is related to the number of patents in core technology fields owned by enterprises. With the continuous improvement in GTI, enterprises have more patents in core technology fields, and the technological proximity among actors may decrease. On the other hand, the degree of technological proximity is related to the number of technological partners of an enterprise. When there are more partners, a single partner has less influence on the enterprise knowledge base. The number of partners in the innovation network increases gradually. This stepwise increasing relationship can be expressed using a ramp function. Its equation is as follows.

where ST represents the start time, and FT represents the final time.
Variables such as enterprise innovation intensity are calibrated and simulated using a simulation experiment method to generate realistic data for the sample enterprises in the simulation scenario. The equation is given in Equation 9.

After the initial construction of the equation, we reconfirmed it with 10 enterprise experts from the 17 scoring experts. We showed them the system construction logic, debugged the system further and modified the system equations. The revised simulation values were then cross-checked against the data collected in the case study to improve the reliability and effectiveness of the system.
Model Test
Before conducting simulation analysis, it is crucial to validate the effectiveness of the model.
Historical Data Validation
Using Company B as an example, we compared objective statistical data with model simulation values to verify the fitness between dynamic model behavior and real-world system change patterns and to ensure the validity of the model constructed. From the survey, we obtained stock data for the number of green patent applications, green cooperative projects (including overall product solutions and joint investments), and enterprise innovation intensity (the ratio of R&D investment to main operating income; Choi & Williams, 2014), with a data time span from 2013 to 2024. Table 8 shows that the dynamic model simulation values are close to the actual values, with a generally consistent trend of change. Therefore, it can be inferred that the dynamic model constructed in this study can simulate real-world systems relatively realistically and that the simulation results have valuable reference significance.
Sensitivity Test
To validate the model’s robustness, a comprehensive sensitivity analysis was conducted. We not only tested the impact of 11 key variables—including social proximity, technological proximity, cognitive proximity, green collaborative projects, green absorptive capacity, increment in green technological innovation, amount of tacit knowledge, amount of explicit knowledge, innovation risk, organizational rigidity, and knowledge conversion factor—at different fixed levels (±30%, ±50%, ±70%), but also the impact of dynamic perturbations from seven variables on GTI, to test the system’s robustness in the face of unpredictable disturbances. The top 20 most sensitivity scenarios over the simulation period (Year 0–30) is shown in Figure 5. The x-axis represents the absolute value of the percentage change in GTI (0–160%), while the y-axis shows the names of each scenario. It is easy to observe that the greater the fluctuation, the more significant the change in GTI. Our analysis found the system to be highly sensitive to parameters such as social proximity, cognitive proximity, green collaborative projects and technological proximity.

Top 20 most sensitive scenarios.
System Simulation
In this study, social proximity, cognitive proximity, and technological proximity were set as input variables for sensitivity simulation. Enterprise GTI was set as the output variable. We changed the value of the variables representing proximity and then simulated and analyzed the evolutionary process of GTI from the perspective of the interaction mechanism of single proximity dimensions and combinations of proximity dimensions. First, we changed the value of a single proximity dimension and conducted a sensitivity simulation. Second, the values of the three proximity dimensions were combined in pairs for simulation. Finally, the values of the three proximity dimensions were changed together for simulation.
Single Proximity Dimension Simulation and Analysis
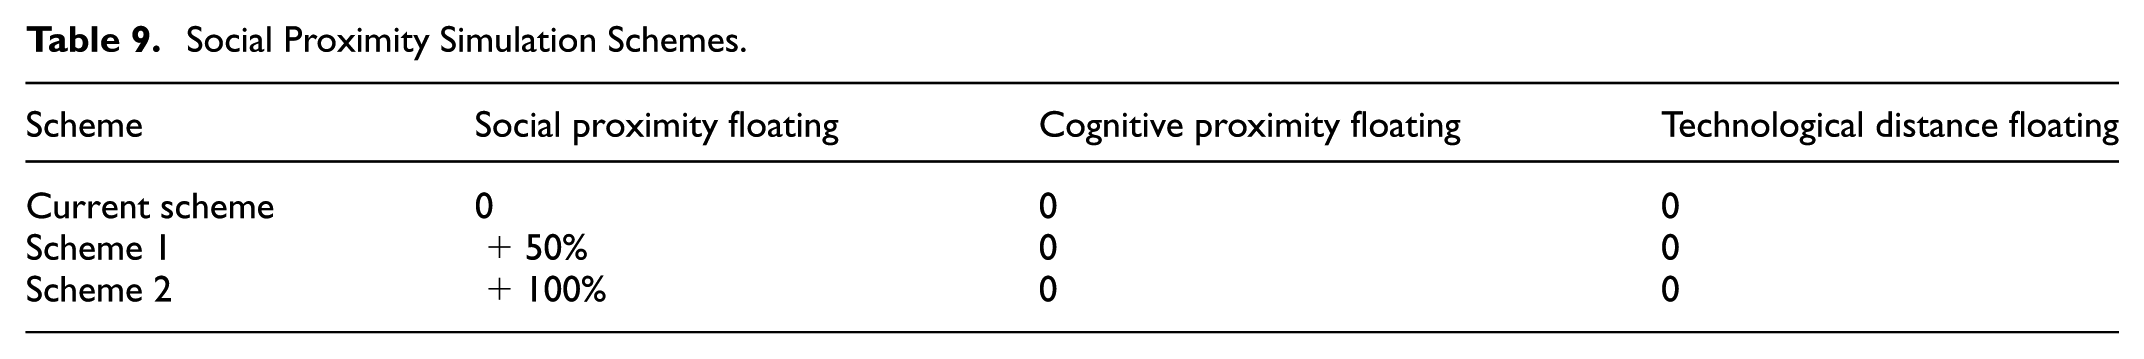
By adjusting the parameter value of the variable to change social proximity, the effect of social proximity on GTI was analyzed. See Table 9 for the simulation schemes. In addition to the current level of proximity, we set social proximity to be 50% and 100% higher than the current level, and the other proximity dimensions remained unchanged. The change trends of enterprise GTI under the different schemes are shown in Figure 6.
Social Proximity Simulation Schemes.
Simulation of GTI evolution under different social proximity levels.
Compared with the current scheme, social proximity can improve enterprise GTI. Different levels of social proximity have different influences on GTI. When social proximity between actors is moderately improved, GTI is improved. However, when social proximity is too high, organizational rigidity in an enterprise may occur, which inhibits GTI activities.
We set the cognitive proximity to be 50% and 100% greater than that of the current scheme, as shown in Table 10. Figure 7 shows that when cognitive proximity is improved, this can further GTI. The positive effect of Scheme 2 is obviously better than that of the current scheme and Scheme 1. In Scheme 2, the improvement in GTI gradually slows in the late stage of the simulation.
Cognitive Proximity Simulation Schemes.


Simulation of GTI evolution under different cognitive proximity levels.
The values of technological proximity were set to 50% and 100% of the initial value for simulation, as shown in Table 11. Figure 8 shows that moderate technological proximity is conducive to GTI. However, technological proximity should not be too high; otherwise, it may inhibit GTI. Among the three schemes, Scheme 1, with a 50% increase in technological proximity, is superior to the current scheme. In scheme 3, GTI is lower than that in the current scheme.
Technological Proximity Simulation Schemes.


Simulation of GTI evolution under different technological proximity levels.
Analysis of the Mixed Effect of Proximity
After clarifying the influence of different levels of social proximity, cognitive proximity, and technological proximity on GTI, we aimed to test and compare the effects of different combinations of proximity on GTI. Therefore, the three proximity dimensions were combined into pairs for sensitivity simulation. Then, the three proximity dimensions were set as sensitivity simulation variables for the experimental simulation.
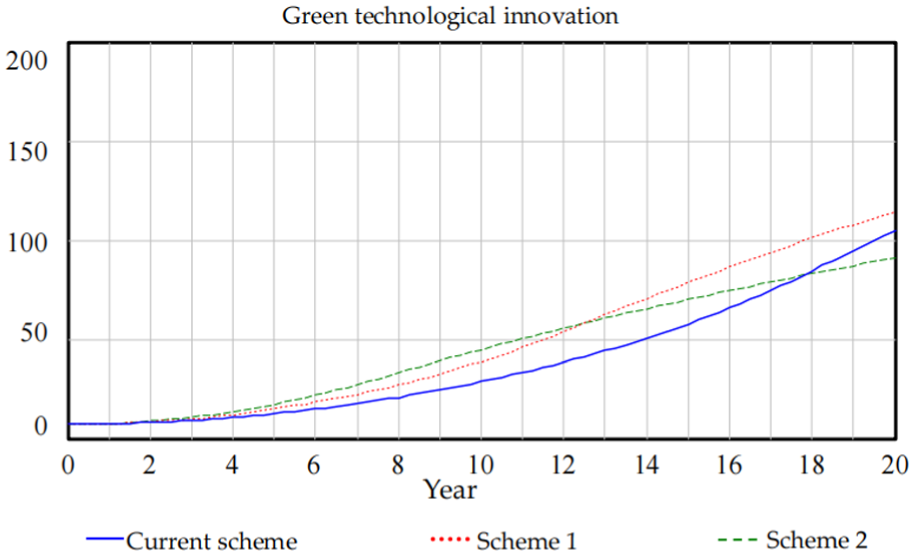
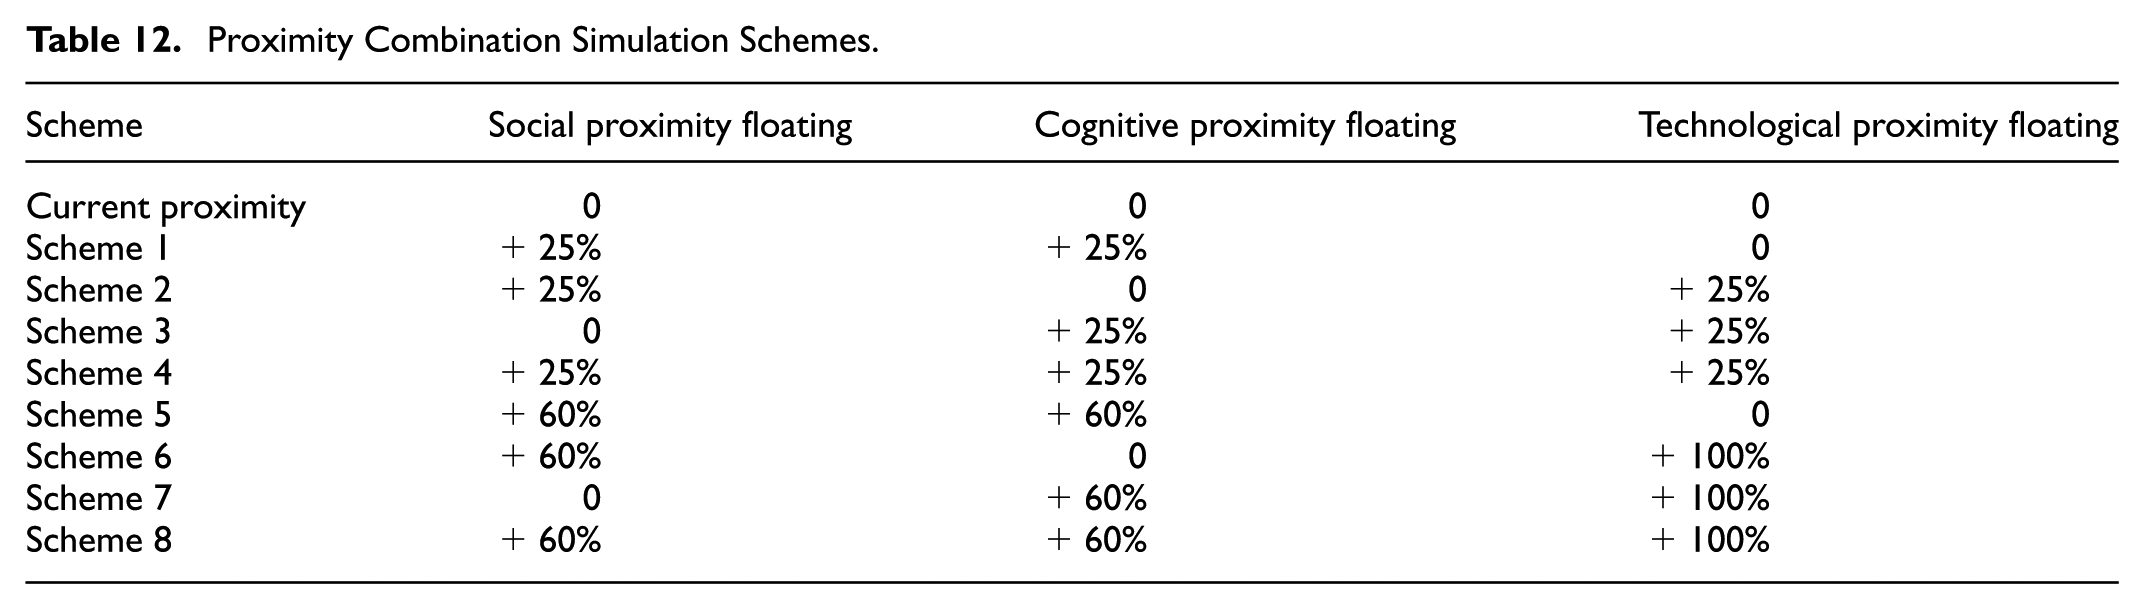
We set the two proximity dimensions to be moderately higher than the current level, and the other dimension remained unchanged, as shown in Schemes 1, 2, and 3 of Table 12. Then, the three proximity dimensions were set to be moderately higher than the current level, as shown in Scheme 4 of Table 12. On the basis of these schemes, we conducted an experimental simulation, and the change trend of GTI was obtained, as shown in Figure 9. Curve 1 represents the current level. Curve 2 shows the simulation results of Scheme 1. Curve 3 shows the simulation results of Scheme 2. Curve 4 shows the simulation results of Scheme 3. Curve 5 shows the simulation results of Scheme 4.
Proximity Combination Simulation Schemes.

Simulation of GTI evolution under different levels of proximity (schemes 1–4).
Figure 9 shows that all four schemes are better than the current scheme. The effects of the four schemes gradually increase over time. Schemes 4, 3, and 2 are better than the schemes of single proximity improvement. Among the four schemes, Scheme 4 is the best. The next-best scheme is Scheme 3.
We then continued to increase the degree of proximity for simulation through Schemes 5, 6, 7 and 8. Table 12 describes the scheme settings. Figure 10 shows that when the proximity dimensions in the combination schemes are excessively high, the GTI growth rate gradually slows and falls below that of the current scheme in the later stage of the simulation.
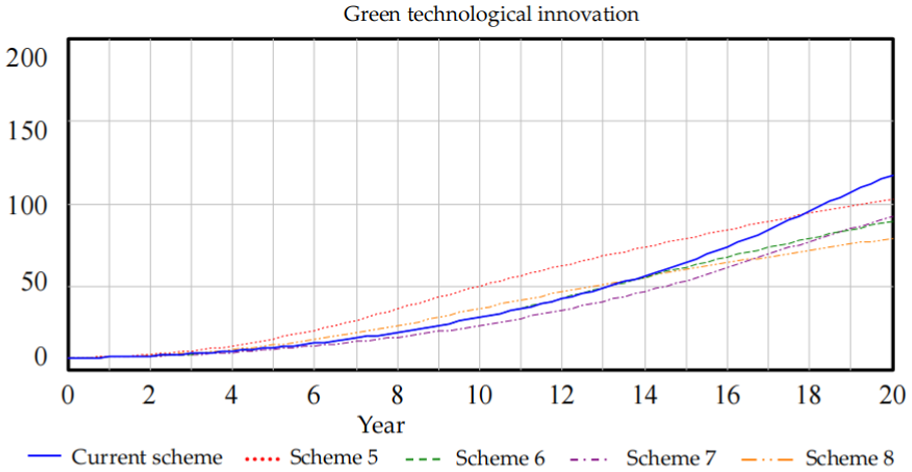
Simulation of GTI evolution under different levels of proximity (schemes 5–8).
Conclusion and Discussion
Discussion
Social Proximity and GTI
Social proximity influences enterprise GTI in both positive and negative ways. The social proximity among supply chain partners makes them more willing to share explicit and tacit knowledge. Moreover, social proximity may promote the willingness to cooperate, thus increasing the number of green cooperative projects and promoting explicit and tacit knowledge sharing. Enterprises integrate and innovate externally acquired knowledge, thus increasing the amount of explicit knowledge and tacit knowledge, and GTI may also be improved. In addition, social proximity enhances the trust between actors, which is conducive to improving coordination and reducing opportunistic behavior and innovation risk. These changes allow enterprises to invest more resources in knowledge integration and innovation, thus improving GTI. In turn, the improvement in GTI enhances actors’ recognition of capabilities, which increases social proximity. Hence, a virtuous circle of social proximity, knowledge sharing, and GTI is formed. As articulated by the chairperson of Company B, “We are a trusted supplier to downstream customers who have rated us as their best vendor. When these customers come up with new green product ideas, they approach us directly with personalized requirements. For example, they may recommend formula upgrades or seek our assistance in providing product solutions. In response, we customize and develop our products based on the specific needs of each customer. Through effective communication, we identify the most suitable formulation and processing conditions for each client.”
However, social proximity cannot be increased indefinitely. An improvement within a certain range helps GTI, but an overemphasis on it can lead to redundant resources from a single partner. If social proximity exceeds the threshold, then enterprises may become path dependent, which leads to organizational rigidity and affects innovation activities, exerting a negative impact on GTI. Through our investigation, we understand that the strategic focus of Company C is centered on serving its major clients. The company places a high emphasis on maintaining relationships with these clients while expending less effort to build and manage its relationships with other clients. Therefore, the company has established close collaborative partnerships with a major foreign client that represents the largest share of its sales. The company’s production processes have also been tailored to meet the specific requirements of this major client, with little collaboration or emphasis on green technology with other companies.
This finding regarding the dual effect of social proximity is highly consistent with the literature. The positive effect confirms the central role of trust in promoting interactive green knowledge learning (Cheng et al., 2008; Pan et al., 2021); the negative effect provides dynamic simulation evidence for the view proposed by C. L. Hu, Yang, and Yin (2022) that over-embedding can lead to a lock-in in green innovation, which is detrimental to green innovation performance.
Cognitive Proximity and GTI
An improvement in cognitive proximity means that an enterprise and the actors of the manufacturing network have common goals and similar philosophies and operating models. Cognitive proximity helps reach the goals of cooperation, and the number of cooperation projects increases. Through project cooperation, explicit knowledge and tacit knowledge are shared among actors, thus increasing the amount of explicit and tacit knowledge of enterprises. The GTI of an enterprise may also increase accordingly. Cognitive proximity is further conducive to improving coordination, reducing innovation risk, and enabling enterprises to invest more resources in knowledge integration and innovation, which promotes GTI. In turn, the improvement in GTI enables enterprises to gain more experience and resources in cooperation with external actors of the knowledge network. Enterprises can invest more resources to improve the embedding process of manufacturing networks, which is conducive to improving the cognitive proximity of enterprises. As the vice president of Company B stated, “Our shared vision with our partner is to maximize profits for the joint venture sales company while offering environmentally friendly and cost-effective products to the Chinese market, thereby contributing to alleviating environmental burdens.”
When cognitive proximity is particularly high, the improvement in GTI gradually slows in the later period. The reason is that cognitive proximity enhances social relationships. When social proximity is too high, enterprises often generate organizational rigidity, which has a negative effect on enterprise innovation capability.
These findings deepen the understanding of the role of cognitive proximity. Its positive effect on fostering cooperation and communication is consistent with the views of scholars such as Han and Xu (2022, 2024). However, the indirect negative pathway revealed by our dynamic model, which is triggered by increasing social proximity, provides new mechanistic evidence explaining why cognitive proximity is not a case of “the higher, the better.” This mechanism may also explain why some studies (J. W. Chen & Liu, 2023) have reported that cognitive conflict promotes green innovation.
Technological Proximity and GTI
On the one hand, technological proximity increases the willingness to cooperate between actors and facilitates the absorption of green knowledge. By sharing explicit and tacit knowledge, the amount of explicit and tacit knowledge of an enterprise increases, and the GTI of the enterprise also improves. On the other hand, when technological proximity exceeds a certain range, enterprises can hardly obtain heterogeneous technologies that complement the existing technology fields. Additionally, since technological proximity is high, enterprises may compete in core technology fields, preventing them from sharing knowledge with one another. According to the secretary of the board of Company C, “Our acquisition of green technology has allowed us to expand into new markets. The success of our acquisition is attributed to the leading position of our proprietary technology within the industry. However, when it comes to collaborating with companies possessing similar technology, we exercise extreme caution, as these companies are more likely to be our competitors.”
This double-edged sword effect of technological proximity reflects the inherent tension within firms between knowledge exploitation and exploration. On the one hand, a moderate technological overlap is a prerequisite for effective knowledge absorption, which in turn promotes GTI; this finding supports the core views of Y. Q. Liu et al. (2021), Y. Y. Li, Zhu, et al. (2022), and B. Zhang and Liu (2024). On the other hand, this study reveals that excessive proximity can inhibit GTI because of a lack of heterogeneous knowledge and increased competition. These findings echo research suggesting that some technological distance is crucial for GTI (Ardito et al., 2019; Han & Xu, 2024).
Combinations of the Proximity Dimensions and GTI
The following conclusions are drawn from the simulation results. The effect of combinations of the proximity dimensions is obviously better than that of a single dimension, and different combinations have different effects. The combination of the three proximity dimensions has the greatest effect on promoting GTI, followed by the combination of two proximity dimensions. Among the two proximity combinations, the combination of cognitive proximity and technological proximity has a stronger effect on promoting GTI, whereas the combination of cognitive proximity and social proximity has a weaker effect.
The possible reasons are as follows. Different proximity dimensions reduce uncertainty, enabling knowledge network formation, knowledge sharing and GTI improvement. Therefore, GTI improves significantly when all three dimensions are moderately improved. When cognitive proximity and technology proximity are appropriately improved, this improvement not only affects the willingness to cooperate and green absorptive capacity but also impacts GTI by influencing social proximity. Therefore, a modest improvement in cognitive proximity and technological proximity has a notable impact on promoting GTI. However, when the dimensions are excessively improved, even though collaboration and knowledge sharing are more likely, organizational learning is not optimized. The amount of tacit and explicit knowledge does not increase significantly, and GTI is inhibited. In addition, too much proximity triggers organizational rigidity and may hinder the development of new products or market opportunities. Excessive proximity may also pose competitive risk, as enterprises understand one another’s strategies, which prevents them from gaining access to the diverse knowledge required for GTI. As stated by the vice president of Company A, “Through comprehensive product solutions and the continuous promotion of green innovation, we are dedicated to serving our customers. Our business philosophy, state-of-the-art technology, and strong R&D capabilities form a mutually reinforcing cycle.”
Dynamic Evolution of Proximity’s Impact Across Innovation Stages
Our simulation results reveal that the impact of proximity on GTI is highly stage dependent. Initially, in the early phase of collaboration (e.g., years 0–7), the effects of different levels of proximity are modest as the system builds up its core stocks of tacit knowledge, explicit knowledge, and green collaborative projects. However, as collaborations mature into a middle stage (e.g., years 8–15), a critical inflection point occurs where the GTI trajectories diverge dramatically. During this period, the virtuous cycles of optimal proximity accelerate innovation, while the negative effects of excessive proximity—such as organizational rigidity —begin to actively suppress growth, causing these trajectories to lag. This divergence ultimately determines the long-term innovation performance in the later stages (e.g., years 16–20), when the consequences of early strategic choices become profound and lasting.
Conclusion
Despite possessing their own knowledge and technology, many enterprises find that achieving GTI is challenging and requires access to diversified knowledge through knowledge networks. Consequently, promoting GTI through proximity has become an important area of research. In this study, we first constructed a causal model of the effects of three proximity dimensions on enterprise GTI based on semistructured interviews and the literature. Second, we built an SD model to reflect how the three proximity dimensions affect the system and ultimately influence the evolution of enterprise GTI. Third, we comprehensively considered the impact of nonspatial proximity, simulated the evolution of enterprise GTI, and dynamically analyzed the effects of single proximity dimensions and combinations of proximity dimensions.
In response to how social, cognitive, and technological proximity influence GTI, we conclude that their influence is nonlinear and operates through complex feedback loops. Moderate proximity fosters cooperation, knowledge sharing, and trust, which in turn promote GTI. However, excessive proximity can trigger organizational rigidity and path dependence, ultimately inhibiting innovation activities.
Addressing the question of whether a higher degree of nonspatial proximity results in greater GTI performance, our answer is no. We conclude that an optimal, moderate level of proximity is most beneficial for GTI. Blindly increasing proximity without considering its potential negative consequences can be counterproductive. Furthermore, we conclude that a balanced combination of all three proximity dimensions is more effective than focusing on any single dimension, highlighting the importance of a holistic proximity strategy.
Implications
Theoretical Implications
First, we extend proximity theory by demonstrating the nonlinear and dynamic nature of its impact on GTI. Our SD model reveals that for social, cognitive, and technological proximity, the relationship with GTI follows an inverted U-shaped curve, where moderate levels are optimal and excessive levels become detrimental. This addresses the scholarly debate on whether proximity promotes or inhibits innovation by concluding that it does both, depending on the level and duration.
Second, this research enriches the understanding of the specific drivers of GTI by revealing the critical role of interfirm relational dynamics. While existing studies often identify drivers such as environmental regulations or market demand, our work provides a microlevel explanation of how firms operationalize their response through their innovation networks. Therefore, our study contributes a more dynamic and relationship-centric view of the antecedents of successful green innovation.
Third, this research contributes to innovation network theory by highlighting the importance of a holistic and balanced proximity portfolio. Our simulation of combined proximity dimensions shows that a balanced, moderate improvement across all three dimensions (social, cognitive, and technological) yields the best GTI performance, superior to maximizing any single dimension. This shifts the theoretical focus from managing individual relational dimensions to strategically curating a balanced portfolio of interfirm relationships.
Practical Implications
This study’s simulation results and analysis have several important implications for both enterprise managers and industrial policy-makers seeking to promote GTI.
For enterprise managers, the findings provide a clear directive: managers should abandon a “more is better” approach to collaboration and instead adopt a strategic, diagnostic, and balanced approach to managing their network relationships.
Implement a Proximity Diagnostic Process. To effectively manage proximity, managers must first assess it. We recommend that firms develop a systematic process for mapping and evaluating their relationships with key partners across the three nonspatial dimensions. This involves asking critical questions: To what degree do we share a common strategic vision for green development with a partner (cognitive proximity)? Is our relationship based on genuine trust and frequent informal contact, or is it merely contractual (social proximity)? Does our partner’s knowledge base offer complementary insights, or does it largely overlap with our own, posing a competitive risk (technological proximity)? This diagnostic process allows firms to identify relationships that are either too distant (requiring investment) or too close (posing a risk of innovation stagnation).
Pursue a Balanced and Dynamic Proximity Strategy. The optimal strategy is not to maximize a single dimension of proximity but to cultivate a moderate, balanced level across all three dimensions. When proximity is too low, firms should make targeted investments. This includes launching joint R&D projects to build a shared knowledge base, establishing common green performance metrics to increase cognitive alignment, and facilitating personnel exchanges or informal workshops to build the social trust necessary for tacit knowledge sharing. When proximity is too high, managers must proactively mitigate the risk of organizational rigidity and path dependence. This requires deliberately introducing novelty into the network. Actions could include seeking collaborations with partners from entirely different industries (e.g., a chemical firm with a software company), rotating the managers in charge of long-standing partnerships to bring fresh perspectives, and strategically partnering with firms that have complementary—rather than identical—technologies to ensure access to heterogeneous knowledge.
For government and industry policy-makers, the insights from this study can also inform the design of more effective industrial policy to foster a greener manufacturing sector. The government can play a crucial role by creating an environment that encourages the formation of optimally balanced innovation networks. This involves designing funding programs that specifically reward diverse collaborations—for instance, by providing a premium for projects that connect firms from different industries or bridge distant parts of the supply chain—thereby helping to prevent industry-wide technological lock-in. Furthermore, government agencies can act as network brokers, establishing platforms or innovation hubs that help firms identify and connect with partners possessing complementary knowledge, rather than reinforcing existing, homogenous cliques. Finally, because our simulation shows that the benefits of these relationships accrue over the long term, it is essential that these policies are stable and predictable. A consistent policy environment provides firms with the confidence to make the long-term investments in relationship-building that are required for achieving sustained GTI.
Limitations and Future Research
This study has several limitations. First, this study focused on Chinese fine chemical enterprises. However, the specific dynamics of innovation, collaboration, and environmental pressure in this sector and within the Chinese context may differ from those in other industries (e.g., electronics, automotive) or other geographical and institutional environments. Second, the impact of nonspatial proximity on GTI is highly complex, and we have explored only part of the conduction pathway. The SD model includes key variables identified through our qualitative data and literature review. However, the real-world process of GTI is influenced by a wider array of factors. Third, the model’s causal structure was constructed on the basis of qualitative data from a multicase study. While this approach provides detailed and in-depth insights, the views expressed are subjective and may not encompass the full spectrum of experiences. Although we validated the model’s behavior against historical data for key variables, obtaining comprehensive, longitudinal quantitative data for all the model variables is exceptionally challenging.
The limitations of this study suggest several important directions for future research. Future studies should test the proposed model in a wider range of contexts. This could involve comparative studies across different manufacturing sectors, such as high-tech versus low-tech industries, to explore how industry characteristics moderate the effects of nonspatial proximity. Future studies could work to validate and refine the model with larger and more diverse datasets. A large-scale survey across multiple industries could be used to statistically test the causal relationships proposed in our model. Moreover, leveraging longitudinal panel data, should it become available, would be invaluable for tracking the coevolution of proximity dimensions, collaborative activities, and GTI performance over time, thereby providing a more robust empirical foundation for the dynamic relationships simulated in this study.
Footnotes
Appendix A
Overview of the Studied Cases.
| Category | Company A | Company B |
|---|---|---|
| Nature | Private enterprise | Private enterprise |
| Field | Coating | Environmental protection solvents |
| Scale | Medium-sized | Large |
| Years of operation | >15 | >15 |
| Main business | R&D, production, operation, and service support of environmentally friendly paint coatings | R&D, production, and operation of green and environmentally friendly solvents, new materials, and new environmentally friendly plasticizers |
| Company C | Company D | |
| Nature | Private enterprise | Private enterprise |
| Field | plastic additives | fine chemical intermediates |
| Scale | large | medium-sized |
| Years of operation | >15 | >15 |
| Main business | R&D, production, and sales of modified plastic new materials as well as related technical services | R&D, production and sales of fine chemical products and new polymer materials |
| Company E | Company F | |
| Nature | Private enterprise | Private enterprise |
| Field | New materials, fine chemicals | Polymer materials, fine chemicals |
| Scale | Large | Large |
| Years of operation | >15 | >15 |
| Main business | R&D, production, and sales of high-end functional ceramic materials, including electronic ceramics, catalysts, and biomedical materials. | R&D, production, and sales of anti-aging additives for polymer materials, with core products being antioxidants and light stabilizers. |
| Company G | ||
| Nature | Private enterprise | |
| Field | Fine chemicals, photocuring materials | |
| Scale | Medium-sized | |
| Years of operation | >15 | |
| Main business | R&D, production, and sales of photoinitiators and pharmaceutical intermediates |
Appendix B
Ethical Considerations
Ethical review and approval were waived for this study. The research involved semi-structured interviews with professionals regarding their expert opinions and organizational practices, which posed no more than minimal risk to the participants. The study procedures were designed to fully protect the confidentiality and anonymity of the participants and their affiliated organizations.
Consent to Participate
Informed consent was obtained from all subjects involved in the study.
Funding
The authors disclosed receipt of the following financial support for the research, authorship, and/or publication of this article: This research is supported by Shandong Second Medical University Scientific Research Innovation Plan Project (04117201).
Declaration of Conflicting Interests
The authors declared no potential conflicts of interest with respect to the research, authorship, and/or publication of this article.
Data Availability Statement
The data that support the findings of this study are available on request from the corresponding author. The data are not publicly available due to their containing information that could compromise the privacy of research participants.