
Abstract
The present study examined the applicability of Buckner’s Community Integration Scale to China’s relocated migrant groups and tested its reliability and validity indicators. We used the Chinese version of Buckner’s Community Integration Scale to investigate 1,163 relocated immigrants. The Brief Sense of Community Scales (BSCS) and the Index of Well-being scale were used to check criterion validity. The scale was also retested for 101 relocated immigrants after 4 weeks. The Chinese version of the Community Integration Scale has 13 items, including three factors: attraction-to-neighborhood, neighboring, and psychological sense of community. The model fit for the three factors was good. Both the total score of the community integration scale and the scores of each factor had significant positive correlations with BSCS and the index of well-being, suggesting the good stability of this scale over 4 weeks. Based on the factor variance and covariance invariance model, the factor mean invariance appeared to hold by gender. The Chinese version of the Community Integration Scale may be used to effectively measure the community integration of relocated migrant groups in China. These results of the Community Integration Scale may help in designing community integration programs in the future.
Plain Language Summary
Immigrant community integration is crucial for fostering social cohesion and economic development. When immigrants successfully integrate, they contribute to their communities by enriching the local culture, filling labor shortages, and stimulating economic growth. Effective integration helps promote mutual understanding, and enhances the overall quality of life for both immigrants and native residents. An effective community integration scale can well assess the adaptation of immigrants.Based on the methodological approach, I have revised the original Community Integration Scale in order to make it applicable to immigrants. Based on psychometric methodology, the Chinese version of the Community Integration Scale consists of 13 questions covering three areas, including attraction-to-neighborhood, neighboring and psychological sense of community. This study also points out the stability of this measurement tool.
Keywords
Introduction
Migration is a crucial pathway toward establishing an open society (Castles, 2010). As per United Nations statistics, the global migrant population in 2020 approximated 281 million, constituting 3.6% of the world total population (United Nations, Department of Economic and Social Affairs, Population Division, 2020). The circumstances of immigrants undergo substantial modifications post-resettlement, as they confront an unfamiliar environment. In China, the living conditions of migrants relocated through poverty alleviation initiatives have markedly enhanced (Zeng et al., 2020). This improvement is facilitated via resocialization, enabling them to become acquainted with, adapt to, and fully integrate into their new environment (Su & Xu, 2005). The stability and orderliness of migrant communities, as well as the peace and contentment of individual migrants, are contingent upon their adaptation to the new community environment. This adjustment underscores the significance of community integration for immigrants. Consequently, community integration activities can expedite the process of assimilation into the new community, thereby mitigating anxiety and bolstering mental health.
In this article, we conduct a comprehensive review of studies that have quantified community integration and elucidate the procedure for selecting test items from Buckner’s Community Cohesion Scale (Buckner, 1988). Additionally, we present an analysis of the scale’s reliability and validity within the Chinese context. Consequently, this study posits the research hypothesis that Buckner’s Community Integration Scale maintains its stability in Chinese applications and is suitable for use with the Chinese population.
Overview
The movement towards community integration originated in Western countries during the 1980s, advocating for the right of all individuals to fully participate and establish membership within their communities (Powell, 1997). As a significant facet of community psychology, community integration explores the emotions and sense of belonging of community members. The degree of community integration among immigrants can serve as an indicator of their adaptation level. Consequently, for a more precise measurement of community integration, the availability of scientific tools that demonstrate reliability and validity in real-world applications is crucial (Douglas, 2022). Existing scales measuring community integration were initially tailored for specific groups.
To enhance the understanding of immigrant community integration, it is imperative to employ a scientifically rigorous instrument. Existing scales, specifically designed to measure community integration for individuals with mental illnesses post-rehabilitation, can be found in Baumgartner and Herman (2012), Baumgartner and Susser (2013), Townley et al. (2018), and Yanos et al. (2011). It is noteworthy that community integration is recognized as a critical outcome of rehabilitation, as Tsai et al. (2012) highlight. Furthermore, there are specific Community Integration Questionnaires tailored for individuals with brain injuries, such as the Community Integration Questionnaire (CIQ) (Sander et al., 1999; Willer et al., 1994) and the Community Integration Measure (CIM) (McColl et al., 1998). Distinct from these, Buckner (1988) introduced the Community Cohesion Scale, intended to measure the community integration of general community residents. This scale is equally applicable to the relocation immigrants addressed in this study.
Buckner supposed that community integration is characterized by residents possessing a strong sense of shared goals and values, thereby reflecting the cohesion within their collective life (Buckner, 1988). With this framework in mind, he devised the Community Cohesion Scale, encompassing three distinct dimensions. The first, labeled “attraction-to-neighborhood,” quantifies the extent to which a community retains its residents. The second dimension, “neighborhood degree,” measures the level of cooperative interaction among neighbors. Finally, the third dimension, termed `psychological sense of community,’ captures the feeling of ownership among community residents. The Community Cohesion Scale has demonstrated versatility in its applications, having been used in diverse populations across numerous countries. These include studies with African-American adolescents (Gepty et al., 2022), Israelis (Zanbar et al., 2023), Koreans (Seo & Lee, 2021), Australians (Abe et al., 2021), and Dutch residents (van den Berg et al., 2023). The scale consistently exhibits adequate reliability, with its internal consistency coefficient ranging from 0.81 to 0.90.
As previously noted, community integration is a multifaceted concept (Pahwa & Kriegel, 2018; Wong & Solomon, 2002; Yanos et al., 2011). Previous studies on community integration emphasized the participation in community activities and neighborhood relationship (Wong & Solomon, 2002), and the emotional connection to the community, such as identity and psychological belonging. These factors contribute positively to residents’ social relations, life satisfaction, and overall quality of life (Wynn et al., 2021). Community integration not only enhances residents’ sense of trust and belonging (Anderson, 2010; Chipuer & Pretty, 1999; Jason et al., 2016), but also influences their happiness and life satisfaction (Gerber et al., 2016; Lee et al., 2015; Obst & Tham, 2009; Prince & Gerber, 2005). Furthermore, it improves mental health, promoting better psychological adaptation (La Motte-Kerr et al., 2020). Previous researches had shown that community integration can mitigate risks of suicide and depression (Fisher et al., 2015; Hatcher & Stubbersfield, 2013) and foster a sense of belonging, which in turn supports mental health (Fone et al., 2007; Pérez et al., 2020) and facilitates the pursuit of happiness (Stewart & Townley, 2020).
From the perspective of the empowerment theory (Speer & Peterson, 2000), community integration can strengthen the sense of ownership among relocated individuals, fostering a feeling of gain. This process is a dynamic and gradual process, requiring continuous interaction, communication and adaptation among residents. Effective integration of immigrants into the community promotes a more cohesive social structure. Consequently, the researches on community integration hold significantly practical value.
In China, the effective implementation of the relocation policy and achievement of a “moving out, stable and fast integration” necessitates stability in the lives of the relocated immigrants. The term “relocation migration” refers to the movement of impoverished individuals from remote areas to urban cities, where they subsequently become urban residents. Such Immigrants often face psychological discomfort and social challenges upon entering a new environment with differing national cultures and religious beliefs. The concept of community integration reflects the sense of identity and belonging among relocated migrants and could potentially stimulate their endogenous development (Tai & Wang, 2022). Therefore, the establishment of a robust system for community integration post-relocation is crucial. Effective tools for community integration form the foundation for understanding the immigrants’ community integration. Nevertheless, certain studies conducted in China have proposed sociological perspective questionnaires on community integration without confirming their reliability and validity (Cheng et al., 2019; Liao, 2020), indicating a lack of adequate measurement tools for discussing community integration. Buckner’s Community Integration Scale, measuring community integration through community attractiveness, neighborhood relationships, and community psychological awareness, has demonstrated stability across diverse groups (Robinson & Wilkinson, 1995). This scale is frequently utilized by researchers due to its consistent high reliability and validity among residents of different countries. Therefore, this paper aims to translate Buckner’s Community Integration Scale into Chinese and test its reliability and validity within the Chinese context, in order to effectively measure the community integration of displaced immigrants from a psychological perspective.
The development of tools for scientifically measuring community integration scientifically within the Chinese context remains in its infancy. This study examines the cross-cultural applicability of Buckner’s Community Integration Scale, specifically its Chinese iteration, to investigate its psychometric attributes and relevance to immigrant resettlement. In doing so, it challenges existing research paradigms on community integration. The study underscores the significance of immigrants' involvement in interpersonal relationships and their overall happiness. Furthermore, it establishes a foundational framework for subsequent research in community psychology, including studies focused on immigrants' life satisfaction.
Method
Participants
Sample 1: In our study, we employed cluster sampling to reach immigrants and their children from three relocated communities and resettlement schools for immigrant children in Guizhou Province, China. We disseminated 565 questionnaires, out of which 559 were returned, and 527 were deemed valid, yielding an effective response rate of 94.28%. The composition of sample 1 includes 250 males and 277 females ranging in age from 12 to 72, with a mean age of 23.68 years (standard deviation (SD) = 12.94). This sample was utilized for the item and exploratory factor analyses of the Chinese version of the suggested scale.
Sample 2: In our research utilizing the group testing method, we surveyed immigrants from seven relocated communities situated in Guizhou Province, China. We distributed a total of 566 questionnaires. Following the exclusion of invalid responses, which included those with missing or multiple answers for a single item, we were left with a total 535 valid questionnaires. This represented an effective response rate of 93.46%. The composition of sample 2 included 262 males and 273 females, all aged between 12 and 74 years. The average age of the participants was 32.33 years (SD = 13.14). We employed Sample 2 for the confirmatory factor, internal consistency, and criterion validity analyses of the Chinese version of the proposed scale.
Sample 3: After a four-week interval, 122 individuals were randomly chosen from Samples 1 and 2 to undergo retesting of the scale. Following the exclusion of 21 invalid data points, a total of 101 valid pairs of matched data points were obtained. Sample 3 encompasses 42 males and 59 females ranging in age between 12 and 56, with a mean age of 19.51 years (SD = 11.65). This sample was employed for the analysis of test-retest reliability.
All participants gave written informed prior to their involvement in the study. Their participation was voluntary and anonymous. For those participants under 18 years of age, a parental informed consent form was provided for them to take home and sign.
Research instruments
Community Integration Scale
The Community Integration Scale utilized in this study was formulated by Buckner (1988). Comprised of 18 items, the scale measures three dimensions: community attraction, neighborhood relationships, and psychological sense of community. The community attraction dimension is represented by Items 1, 5, and 13, while the neighborhood relationships dimension includes Items 3, 7, 9, 11, 15, and 17. Finally, the psychological sense of community dimension features Items 2, 4, 6, 8, 10, 12, 14, 16, and 18. Participants were asked to rate these items on a five-point Likert scale, with one indicating strong disagreement and five indicating strong agreement. The total score, a cumulative sum of each dimension’s scores, serves as an indicator of the level of community integration. Higher scores suggest a greater degree of community integration. This scale has been translated and revised for use in Chinese.
Brief Sense of Community Scale
The Brief Sense of Community Scale (BSCS), as proposed by Peterson et al. (2008), is comprised of eight items, with responses evaluated on a five-point Likert scale from one (strongly disagree) to five (strongly agree). The higher scores suggest a greater sense of community. In this study, the internal consistency coefficient for the scale stands at 0.844.
Index of Well-being
The scale, as proposed by Campbell (1976), includes the General Emotional Index Scale and the Life Satisfaction Scale. It is comprised of nine items, eight of which are in the first part, with the remaining one in the second. Responses are evaluated on a seven-point scale that ranges from “very dissatisfied” to “satisfied.” The total well-being score is calculated by adding the average score of the General Emotional Index Scale to the score of the Life Satisfaction Scale, the latter of which carries a weight of 1.1. Scores vary between 2.1 (indicating the lowest happiness) and 14.7 (representing the highest happiness). A higher score corresponds to a higher well-being index. The internal consistency coefficient of the scale is .928.
Procedures
Translation
The translation of the Community Integration Scale was accomplished through several steps. Initially, the original scale was translated into Chinese by two psychologists and two English language experts in order to clarify any ambiguous or incomplete expressions. Following a process of discussion, modification, and consensus, the first draft of the Chinese scale was produced. Subsequently, the staff from the resettlement area reviewed, revised, and refined the language in the initial version of the Community Integration Scale. Finally, in an effort to more accurately capture the original meaning of the scale, each item in the Chinese version was expressed with clarity and conciseness. At the same time, the scale was adapted to reflect Chinese linguistic norms and included a Chinese translation for measurement and evaluation purposes.
Implementation
The testing process was facilitated by two psychology researchers who functioned as examiners, while four research assistants were deployed to relocation and resettlement areas for the distribution of questionnaires. The test was completed independently by the participants. However, for older immigrants or those with limited literacy, a one-to-one, face-to-face testing method was employed. In this method, the primary examiner would read each question aloud to the subjects and provide explanations for the meaning of each item. Subsequently, participants would make their selections and verbally communicate their chosen options to the primary examiners.
Data Analysis
The data analysis for this study was conducted using two software programs: SPSS 26.0 and Mplus (Muthén & Muthén, 1998–2017). The item analysis focused on item-level descriptive statistics and the corrected item-scale correlation. Construct validity was assessed through factor analysis, with the suitability for factor analysis was evaluated using the Kaiser-Meyer-Olkin (KMO) test and Bartlett’s test of sphericity. Exploratory factor analysis (EFA) with parallel analysis was employed to identify the appropriate number of factors to extract. Confirmatory factor analysis (CFA) was conducted to test the three-factor solution identified in the previous step and to define the item-factor structure of the Chinese version of community integration scale. To access the criterion-related validity, BSCS and the index of well-being scale were used as criteria. For the reliability analysis, Cronbach’s alpha coefficient was used to assess the internal consistency, and the test-retest reliability coefficient was calculated using panel data. Finally, measurement invariance was tested to ascertain whether the scores of the Chinese version of community integration scale remained consistent across gender.
Result
Item Analysis
The item-scale correlation refers to the relationship between the score for a particular item and the total score for the entire scale (Costello & Osborne, 2005). It was determined by correlating the score on an individual item with the sum of the scores on all other items in the scale. This correlation helps to assess whether an item is consistent with the overall construct that the scale was designed to measure. A high item-scale correlation suggests that the item is strongly related to the underlying construct and is contributing meaningfully to the overall scale. In contrast, a low correlation may indicate that the item does not align well with the scale’s intended purpose and may need to be revised or removed (DeVellis & Thorpe, 2021). We showed the mean, standard deviation, and corrected item-scale correlation for each item in sample 1 (N = 527) in Table 1. Item 15 was removed due to its non-significant correlation with the overall scale. Item 5 and 11 were excluded because of their extremely low correlations.
Descriptive Statistics for Items and the Corrected Item-Scale Correlation.

Note. The scores of item 5 and 15 were reversed from their raw values, as they are negatively worded questions.
Validity
Prior to the factor analysis, the Kaiser-Meyer-Olkin (KMO) test, Bartlett’s test of sphericity, and parallel analysis were conducted in sample 1 (N = 527). The KMO value, 0.898 > 0.8, and the result of Bartlett’s test of sphericity,
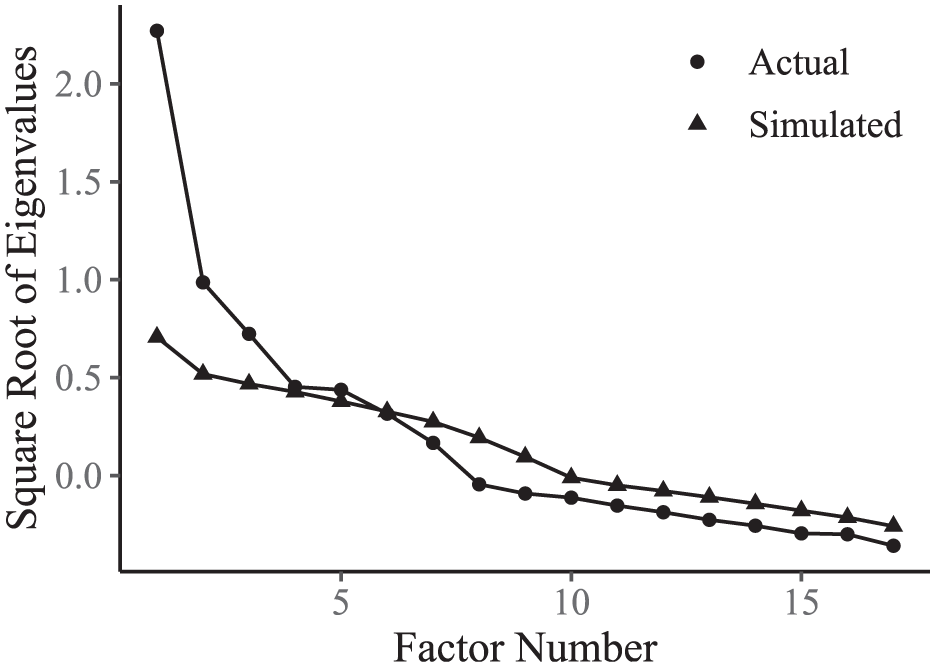
Parallel analysis and scree plot of EFA for community integration items.
The three-factor EFA was performed on sample 1 (N = 527) to examine item performance, using maximum likelihood estimation and direct oblimin rotation. Based on the result of the pattern matrix, the item 4 and 12 were removed due to cross-loading. Cross-loadings refer to instances where an item in a factor model loads significantly on more than one factor (Kline, 2000). In other words, an item may have substantial correlations with multiple latent variables in the model, which can complicate the interpretation of the item’s association with any single factor (DeVellis & Thorpe, 2021). After their removal, the three-factor EFA was repeated. No cross-loading was found, and all factor loadings were larger than 0.40.
CFA was performed on sample 2 (N = 535), using maximum likelihood mean-adjusted as the estimation method. Given the large sample size (Muthen & Kaplan, 1992) and the scale of 5-point Likert (Bollen, 1989), the item scores were treated as continuous variables. The factors were intercorrelated, with the restriction for model identification being “factors have a mean of 0 and a standard deviation of 1”.
We found that the item-factor structure was consistent with that of the original community integration scale developed by Buckner (1988), except for item 2. Consistent with the adjustment made by T. J. Wilkinson (2007b), item 2 was shift to factor 1. Another reason for shifting of item 2 was the practical convention, which arises from the requirement of model identification, that every factor should have at least three items (Floyd & Widaman, 1995). In addition, we added a latent variable, termed the deflector, which indicates six items whose stems contain the special word, neighbor. This word may induce different cognitive processing because neighbors hold a special role in Chinese culture (Yang, 2016). The deflector constituted a bifactor model which could control this kind of nuisance in factor scores (Wang et al., 2015). The model fit was shown in Table 2. For the bifactor model,
Model Fit Index for CFA.

Chinese Version of the Community Integration Scale.


Path diagram of the Chinese version of community integration scale.
To evaluate the criterion-related validity of the Chinese version of community integration scale, the present study used BSCS and the index of well-being scale as criteria and conducted analysis on sample 2 (N = 535). As shown in Table 4, both the total score of the community integration scale and the scores of each factor had significant positive correlations with BSCS and the index of well-being. The scores of the Chinese version of community integration scale were significantly correlated with all criterion validity indicators. These results showed that the Chinese version of the Community Integration Scale had good reliability and validity.
Criterion-Related Validity Analysis of the Chinese Version of the Community Integration Scale.

p < .01.
Internal Consistency and Test–Retest Reliability
Internal consistency coefficients were calculated using sample 2 (N = 535). Sample 3, consisting of 101 participants randomly selected from Samples 1 and 2, was established to assess retest reliability by having these individuals complete the community integration scale for a second time, approximately 4 weeks after their initial participation. Test–retest reliability coefficients were calculated using data from participants who passed quality checks at both timepoints (N = 101). As shown in Table 5, both coefficient ω and coefficient α suggested acceptable internal consistency between items. Pearson correlations between the two timepoints were strong and significant, suggesting the good stability of the Chinese version of community integration scale over 4 weeks.
Reliability Coefficient of the Chinese Version of the Community Integration Scale.

p < .01.
Measurement Invariance
Measurement invariance is essential for ensuring that a scale measures the same construct across different groups, allowing for meaningful comparisons. Specifically, in the context of this paper, we examined measurement invariance across genders, which is crucial for confirming that the model behaves equivalently for both males and females. If the scale functions differently across genders, any observed differences in the scores could be due to the measurement method itself rather than true differences in the construct being measured (Putnick & Bornstein, 2016; Tifferet, 2020).
The measurement invariance test was conducted on sample 2 (N = 535). As detailed in Table 6, the test proceeded step-by-step, with each subsequent model nested within the previous model. First, fit for the configural model grouped by gender exhibited good fit to the data. Based on the configural model, the metric invariance appeared to hold by gender, ΔCFI = 0.007, ΔRMSEA = −0.001. Based on the metric invariance model, the scalar invariance appeared to hold by gender, ΔCFI = 0.001, ΔRMSEA = 0.002. Based on the scalar invariance model, the residual variance invariance appeared to hold by gender, ΔCFI = 0.001, ΔRMSEA = 0.002. Based on the residual variance invariance model, the factor variance and covariance invariance appeared to hold by gender, ΔCFI = 0.003, ΔRMSEA < 0.001. Lastly, the results from the factor variance and covariance invariance model indicate that factor mean invariance by gender holds, as evidenced by the ΔCFI = 0.002 and ΔRMSEA = −0.001. These values suggest that the Chinese version of the Community Integration Scale demonstrates measurement invariance across gender, supporting its validity for comparisons between male and female respondents.
Model Fit Index for the Measurement Invariance Across Gender.

Note. The test for residual covariance invariance was omitted because the baseline model (configural invariance model) did not include any residual covariances.
Discussion
The topic of community integration, a key area of focus within the field of community psychology, continues to garner considerable attention in academic literature. Community integration reflects the process by which diverse groups, with varying beliefs, values, behavioral norms, and lifestyles, adapt within a community. This process involves the active participation of resettlement immigrants in community communication, facilitating their adaptation to new living environments and lifestyles, and ultimately leading to the establishment of a sense of belonging and identity. Therefore, empirical research on community integration is intrinsically linked to the application and effectiveness of scientific evaluation tools. The current study examines the factor structure of the Community Integration Scale among migrant populations in China. Consistent with the original scale (Ross & Searle, 2021), the Chinese version also encompasses three dimensions. Moreover, further analyses of reliability and validity indicate that the Chinese version of the scale demonstrates strong reliability and validity. Additionally, based on the model of factor variance and covariance invariance, the factor mean invariance appears to be consistent across genders. These findings collectively support our hypothesis that Buckner’s Community Integration Scale maintains stability within the Chinese population.
When analyzing the items of the community integration questionnaire, for Items 5 (“I would like to move out of this community if I have the opportunity”), Item 11 (“I borrow things and exchange favors with my neighbors”), and Item 15 (“I rarely have neighbors over my house to visit”), we find that the total correlation coefficient of the question is lower than .3 and should be discarded. The Item 5 and Item 15 were graded in reverse, so they have negative meanings. Hence, some subjects may not be willing to report the real situation and may provide an infavorable answer (Barnette, 2000). While the Item 11 only uses “borrowing things” to reflect the relationship between community members, which is not a comprehensive approach. Therefore, the answers to the Item 11 may not fully reflect the situation of migrants’ lives, resulting in the Item 11 low relevance to the overall score. Eventually the Item 11 was dropped. At the same time, after the EFA, the Items 4(“The friendships and associations I have with other people in my neighborhood mean a lot to me”) and 12(“I would be willing to work together with others on something to improve my neighborhood”) were removed because they had cross loadings.
The item analysis results show that the 15 items of the Chinese version of the Community Integration Scale are significantly correlated with overall scale. Through exploratory and confirmatory factor analyses, we investigate the internal factor structure of community integration. We extract three factors: attraction-to-neighborhood, neighboring and psychological sense of community. The three-factor structure exhibits an adequate model fit, indicating that the scale has good construct validity.
After the reliability and validity test of the Chinese version of the Community Integration Scale, the first factor, which includes Items 1, 2, and 13, is called attraction-to-neighborhood, which highlights residents’ willingness to live and continue living in the community. The second factor, which includes Items 3, 7, 9, and 17, is called neighboring, which highlight interactive behavior between residents and neighbors including sincerity, mutual help, and cooperative communication. The third factor, which includes Items 6, 8, 10, 14, 16, and 18, is called psychological sense of community, which involves community trust (Jason et al., 2016), the satisfaction of needs (needs satisfaction perceived by community members) (McMillan & Chavis, 1986), and influence (community members are aware of the extent to which they have a role to play in the community) (Peterson et al., 2008).
The Item 2, “I feel I belong to this community,” belongs to attraction-to-neighborhood, and in the original scale belongs to psychological sense of community. However, the Item 2 reflected the following meaning: feel like I belong in this community, don’t would like to move, and attracted to living in community. Therefore, the Item 2 may belong to attraction-to-neighborhood, which is also consistent with previous research (Ross & Searle, 2021; D. Wilkinson, 2007a).
Overall, attraction-to-neighborhood indicates that the community’s living and human-centered environments meet the residents’ activity needs, motivating people to settle in the community. Hence, residents are willing to actively choose the community. Neighboring refers to the actual interaction of the neighbors, and it focuses on a behavior. The neighboring represent not only interaction but also support, and the interaction and support with others in one’s community is important at both individual and group levels. A good neighboring relationship implies that residents in the community help each other, treat each other sincerely, and develop harmonious relationships. The psychological sense of community refers to the shared beliefs of the members of a community (McMillan & Chavis, 1986). By doing so, residents gain understanding and trust.
The internal consistency and reliability of the total score and subscale scores of the Community Integration Scale and the test-retest reliability after 4 weeks are all acceptable, indicating that the scale has high directivity and stability. The criterion validity analysis reveals that the total score of community integration and the scores of the three factors is significantly and positively correlated with community awareness and well-being, in line with previous research (Choi et al., 2019; Gerber et al., 2016; Gurdak et al., 2020; Jason, et al, 2016; Soriano-Miras, 2020). In other words, the higher the level of community integration of individuals, the greater their sense of community awareness and happiness. The results of the present study also show that the measurement of the Chinese version of the Community Integration Scale in different genders is consistent and reliable, which ensures the accuracy of its results and improves the applicability of it.
Conclusion
This study provides robust evidence supporting the reliability and validity of the Chinese version of the Community Integration Scale when applied to relocated immigrant populations. Our findings demonstrate that the Chinese version of the Community Integration Scale retains the original item-factor structure developed by Buckner (1988), suggesting its cross-cultural applicability. Furthermore, the scale shows strong correlations with both the BSCS and the Index of Well-Being, indicating sound concurrent validity. Its test–retest reliability over a four-week interval, along with its demonstrated measurement invariance across gender, further confirms its psychometric strength.
Beyond its methodological contribution, this study offers important practical implications. Community integration is a critical determinant of social cohesion, psychological well-being, and community resilience—particularly among mobile populations. By providing a culturally adapted and scientifically validated tool, the Chinese version of the Community Integration Scale enables researchers, policymakers, and community practitioners to systematically assess and monitor the integration process of immigrants in urban and rural Chinese communities.
The availability of such a tool makes research in community psychology more standardized and replicable, fostering evidence-based decision-making. It also equips community workers with actionable insights to design and implement more targeted, inclusive, and effective integration interventions. As urbanization and internal migration continue to reshape the demographic landscape of China, the Chinese version of the Community Integration Scale holds promise for broader application among other mobile populations, such as rural-to-urban migrants and the children of migrant workers.
In conclusion, this study not only fills a critical gap in the measurement of community integration in the Chinese context but also lays a foundation for future longitudinal and comparative studies on the mechanisms and outcomes of immigrant integration. Further research should investigate the dynamic and contextual factors influencing integration processes, thereby contributing to the development of more inclusive, harmonious, and resilient communities.
Limitations and Recommendations
While the focus of this study was to develop a scientific tool for measuring community integration, specifically for Chinese immigrant communities, this focus also represents a limitation. The tool was primarily designed from the perspective of psychometrics, and it does not explore how broader contextual factors—such as the diversity of community types of community residents—may influence community integration.
Additionally, the stability of the community integration measures across varying community contexts has not been addressed. For instance, how the economic situation or cultural differences within communities might affect the validity or reliability of the scale is yet to be explored. These are important areas that warrant further investigation. Future research should aim to clarify whether community characteristics, such as socioeconomic status or cultural diversity, influence the stability and generalizability of the scale.
In conclusion, while this study provides a strong measurement tool, its application should be considered within specific contexts, and future research is needed to examine its broader applicability and robustness in different community settings.
Footnotes
Ethical Considerations
All study procedures were approved by the Ethics Committee of Minzu Normal University of Xingyi (No. MNUXY2023033).
Consent to Participate
Each participant was required to sign a written form of informed consent. All methods were carried out in accordance with relevant guidelines and regulations.
Consent for Publication
All authors have approved the submission and publication of the current manuscript.
Author Contributions
Conceptualization, L.X. and J.J.; Data curation, L.X. and R.Y.; Methodology, L.X., J.J., W.P.; Validation, J.J.; Writing original draft, L.X.; Writing review & editing, R.Y., W.P., K.Y., and J.J. All authors have read and agreed to the published version of the manuscript.
Funding
The authors disclosed receipt of the following financial support for the research, authorship, and/or publication of this article: The present study was approved by the Qianxinan Prefecture Science and Technology Plan Project of China (2021-2-44).
Declaration of Conflicting Interests
The authors declared no potential conflicts of interest with respect to the research, authorship, and/or publication of this article.
Data Availability Statement
The data presented in the present study are available on request from the corresponding author.