
Abstract
Numerous studies have shown that trust has cross-cultural differences. Currently, China has limited tools and scales for measuring trust. Referring to Wu and Huang’s three-factor model of Chinese trust, we develop a Chinese Trust Scale (CTS) for Chinese people and measure its reliability and validity. This scale contains 20 items and three factors: (1) public awareness, (2) trust from others, and (3) trust in others. We explore the dimensions and preliminary items of the CTS using item analysis and exploratory factor analysis on one sample (N = 551) and confirmatory factor analysis on a second sample (N = 831) to replicate the suggested factor structure and validate the scale’s reliability and validity. Both the overall and subscale scores of the CTS were significantly correlated with inclusive general trust, belief in a just world, social capital, and satisfaction with life. The results suggest that newly developed CTS could be an effective tool for Chinese trust measurement.
From ancient times to the present, the importance of trust has been self-evident. In the West, trust is considered to be the basis of the entire fabric of day-to-day living and social order (Rotter, 1971), “an important lubricant of a social system” (Arrow, 1974, p. 23), and the boundaries of morality (Mitkidis et al., 2017). In Chinese culture, there are also ancient sayings that promote people’s concern for trust, such as “If people do not trust their rulers, there is no standing for the State” (Kong, 2007) and “Trust is the most important of all virtues and good deeds” (Tan, 1981). Through empirical research, trust has gradually been confirmed to have a significant impact on social development, economic growth, teamwork, and so on (Ahmad & Hall, 2017; Balliet & Van Lange, 2013; Gur & BjoRnskov, 2017), and it is even regarded as “the currency of the new economy” (Botsman, 2012). From an individual perspective, trust is negatively associated with loneliness and social anxiety, and also positively associated with subjective well-being and technology adoption, among other things (AlHogail, 2018; Jovanović, 2016; Rotenberg et al., 2010; Thomson et al., 2015; Jia et al., 2019). Therefore, the research and measurement of trust has been in continuous development.
Early researchers focused on trustees, and referred that trust is the extent to which we think others are trustworthy (Mayer et al., 1995), which requires individuals to make trust judgments based on the trustee’s character, competence, behavior, and other factors. In recent years, with the continuous development of trust research, the specificity of trust components has also been emphasized (McEvily & Tortoriello, 2011). Numerous researchers have suggested that trust is not only a rational judgment of the trustworthiness of the trustee, but also includes the subjective characteristics and tendencies of the trustee himself (Lucas et al., 2011). For example, Thielmann et al. (2015), based on a literature review, proposed that trust includes two aspects. One is conditioned on the specific situation’s variables (e.g., other’s trustworthiness). Another is a stable tendency to (dis)trust, which shows a cross-situation consistency of trust behavior (Fleeson & Leicht, 2006). Yamagishi et al. (2015) proposed and validated a two-component model of general trust in Japanese participants, consisting of trust beliefs and trust preferences. Trust beliefs refer to an individual’s estimate regarding the trustworthiness of another. Trust preferences refer to a preference for self-identity as a person who acts in a trustful manner or is trustful. Zhang (2021), distinguished between individuals’“other-focused trust” and “propensity to trust” through empirical research of participants in Western countries. The former is similar to “trust beliefs” and refers to the degree to which one feels that others are trustworthy. The latter refers to the degree to which one may trust others. Although there are some differences in the concepts proposed by these studies, they all emphasize the binary perspective of trust on the trustor and trustee.
At the same time, the above viewpoints did not further consider the possibility of cultural heterogeneity, and the samples involved were mainly Western participants. As a culturally embedded phenomenon, trust is restricted by the social and cultural norms and values of individuals, and the formation of trust structure also depends on the specific social structure and cultural environment (Zhao et al., 2014). Numerous studies have demonstrated the cross-cultural differences in trust (Bi et al., 2021; Jasielska et al., 2021; Thomson et al., 2015), and these differences are not only manifested in the level of trust, stages of trust development, etc. (Chua et al., 2012; Dirks et al., 2009), but also in structure. For example, Wang and Yamagishi (1999) compared Chinese, Japanese, and American participants using the general trust scale of Yamagishi and Yamagishi (1994), and the results of factor analysis showed that Japanese and American participants showed a strong one-dimensional structure, whereas the structure of Chinese participants was difficult to explain in terms of one-dimensionality. Xia (2005) explored the trust structure of Chinese people through a set of triple trust game experiments and compared the results with Cox (2004), finding differences between them; specifically, Chinese participants preferred a particular trust structure. These studies have confirmed the differences in trust structure between Chinese and other cultures through empirical methods, but there is still a lack of more systematic and clear exploration of Chinese trust structure.
Following this, Chinese scholars Wu and Huang (2012) explored the structure of trust in Chinese people from the bottom up by using the qualitative research method of grounded theory regarding Chinese culture. The study found that “trust,” as perceived by Chinese people, is a component of the concept of “integrity.” It includes three specific dimensions: “trust from others,”“trust in others,” and “public awareness.”“Trust in others” refers to trust in others based on long-term interests or the others’ character and ability. “Trust from others” refers to the assessment of one’s trustworthiness, with the belief that to gain others’ trust, one must practice honesty, integrity, fairness, and live up to others’ expectations. It embodies the ideas of “self-reflection” and “self-discipline,” which are formed under the influence of traditional Confucian culture. This “self-appointed” characteristic may be fully highlighted in traditional Chinese adages, such as, “A person who speaks dishonestly will not achieve anything” and “A person who fails to keep his promise will lose his reputation.” These sayings demonstrate that when discussing trust, Chinese people focus more on how to achieve mutual trust by maintaining their trustworthiness. Meanwhile, “public awareness” refers to the public’s inner principles and the social environment guarantees that help individuals achieve and maintain trust. Wu and Huang (2012) noted that trust in Chinese culture is based on a certain moral foundation. This makes the generation of trust depend on the demonstration of moral role models and certain supporting objective conditions. This study provides a clear theoretical basis for the multidimensional structure of Chinese trust.
Through comparison, we determined some correlations and differences between Wu and Huang’s (2012) three-factor model and the perspectives of the two-dimensional model of trust in foreign countries. First, the dimensions of “trust in others” and “public awareness” are somewhat similar to trustworthiness (or trust beliefs and other-focused trust). They may both be regarded as assessments of the trustworthiness of others, except that the evaluation object of “public awareness” is the overall social environment. “Trust in others” is similarly oriented toward the people with whom we interact. However, for measures in scales that are related to trustworthiness (e.g., “most people are trustworthy”; Yamagishi & Yamagishi, 1994), it is often difficult to focus on specific and detailed characteristics or situations that do not quite match our conceptualization of trustworthiness. Nevertheless, this is the way that most traditional trust assessment methods are currently used (Zhang, 2021). Second, “trust from others” has certain similarities with trust preferences (or self-focused trust). Both relate to an individual’s preference for self-identity as a person who acts in a trustful manner or who is trustful. The longitudinal study by Yamagishi et al. (2015) demonstrated the importance of a preference for trust as a determinant of behavioral trust. It shows that “trust from others” is an integral component of trust that cannot be ignored. In addition, the role of “trust from others” may also be explained by the social projection mechanism of trust (i.e., projecting one’s trustworthiness onto others; Krueger et al., 2012). However, the difference is that “trust from others” emphasizes self-restraint at the conscious level. This type of conscious “self-reflection” and “self-requirement” also highlights the characteristics of traditional Chinese culture to some extent. To sum up, Chinese people’s trust structure not only continues the two-dimensional structural view of foreign countries, but also highlights some differences formed in Chinese social culture. Therefore, we think that it is necessary to take these differences into account when studying and measuring Chinese trust.
A self-rating scale is a direct way to measure trust, and its measurement of multidimensional structures has advantages over other methods (e.g., trust games). However, compared with some viewpoints and concepts that have been put forward in the two-dimensional structure of trust, the tools for measuring the components of trust have not kept up with the pace (Lewicki et al., 2006). Although new measurement tools have been developed by researchers in recent years (Baltatescu, 2012; Couch et al., 1996), three are the most influential and widely used (Frazier et al., 2013; Jasielska et al., 2021), these are Rotter’s (1967) Interpersonal Trust Scale (ITS), Yamagishi and Yamagishi’s (1994) General Trust Scale (GTS), and the single-item general trust measure (GSStrust) commonly used in large social surveys (e.g., World Values Survey), such as “Generally speaking, would you say that most people can be trusted or that you need to be very careful in dealing with people?” (Delhey et al., 2011). The same is true in China. However, these scales were designed on a single dimensional basis and have been subject to some structural controversy in subsequent studies, such as the most widely used Rotter’s (1967) ITS, which has shown inconsistent dimensional results in some studies (Frazier et al., 2013). Yamagishi and Yamagishi’s (1994) GTS also showed a non-monotonic structure among Chinese participants (Wang & Yamagishi, 1999). As analyzed above, there are some subtle differences between the three-factor structure of Chinese trust and the two-dimensional structure, such that a single-dimensional measurement scale may not be able to provide a complete measure of Chinese people’s trust. In addition, trust measurement tools in China are even more limited. Among them, ITS is the most widely used, which includes culturally different contexts such as “official elections” and “participation in politics,” which has been controversial in domestic research (Ding & Peng, 2020). Based on this, we consider that it is necessary to develop a multi-dimensional trust scale for Chinese people on the basis of localization theory.
To this end, this study is based on the three-factor model of Wu and Huang (2012), adopts a standard and complete questionnaire preparation process, and tries to develop a more comprehensive trust scale suitable for Chinese people, in order to provide an effective measurement tool for Chinese trust research. At the same time, it provides a reference for the measurement of cross-cultural and multi-dimensional trust.
Methods
Participants
A total of 1,502 participants were recruited in two rounds through three universities (located in eastern and southwestern China) and a Chinese online survey platform (wjx.cn). The participants’ IP addresses covered 27 provinces, municipalities, and autonomous regions in China. Participants were filtered according to the five polygraph items set in the questionnaire (e.g., “I don’t care at all about other people’s comments,”“I never get angry”); those who answered “6” on three or more items were removed. The final sample comprised 1,382 participants. In the survey’s first round (sample 1), data from 551 participants were used for the item analysis and exploratory factor analysis (EFA). This sample included 274 males (49.73%) and 277 females (50.27%), with an age range of 18 to 63 years (M = 23.57, SD = 3.60). In the survey’s second round (sample 2), data from 831 participants were used for confirmatory factor analysis (CFA), and reliability and validity testing. This sample included 436 males (52.47%) and 395 females (47.53%), with an age range of 18 to 60 years (M = 22.64, SD = 4.10). Eighty-one college students in sample 2 were selected for a retest after 3 weeks, and 70 (32 [45.71%] males and 38 [54.29%] females) of them completed the retest. Their age range was 18 to 23 years (M = 20.20, SD = 1.14), and the results were used for test-retest reliability.
The study conforms to recognized standards as per the Declaration of Helsinki. All the study participants provided informed consent, and the study design was approved by the appropriate ethics review board. The study received ethics approval from the Ethical Committee for Scientific Research at Soochow University. The ethical principles of voluntariness, anonymity, confidentiality, and the ability to withdraw from the study at any time were adhered to. The participants were advised of what was required of them and the ethical principles governing their participation.
Item Development
Based on Wu and Huang’s (2012) three-factor model of Chinese trust, there were mainly two ways to develop the items: The first was based on the original qualitative interview materials of Wu and Huang (2012). We extracted specific interview contents and compiled them into items. The second strategy referred to existing trust scales (Couch et al., 1996; Rotter, 1967; Wang et al., 1999; Yamagishi et al., 2015; Yamagishi & Yamagishi, 1994). We developed items based on the connotations of the three factors. In addition, considering that “trust” has a certain value orientation and social approval element in the Chinese cultural context, we included some negative expressions in these items. For example, “The reason why most people develop a relationship is usually because it is profitable.” After merging and adjusting these items, which were collected via the two methods, the initial 40 items were formed.
In addition, these initial items were reviewed and discussed by a team consisting of one psychology professor, four doctoral students, and six masters’ students. Following DeVellis and Thorpe’s (2021) suggestions, unnecessary words were deleted, and ambiguous items were clarified; items that have nearly the same meaning or reflect the same indicators were also removed (Kaynak et al., 2021). Thereafter, three non-psychology undergraduate students were requested to complete the initial scale, mark the places with unclear expressions, and participate in an interview after the test. We revised the items based on their advice, which resulted in an initial scale of 31 items. Considering that Chinese people may have an obvious tendency to compromise or take a neutral stance, this scale used a six-point Likert scale (1 = completely disagree, 6 = completely agree) to increase the likelihood that participants would select the response options. It also encouraged participants to make more detailed judgments and avoid central tendency bias (Zheng, 2009). The higher the total score, the higher the individual’s level of trust.
Measures
The initial CTS contained 31 items and 5 polygraph items. A 6-point Likert scale (1 = completely disagree, 6 = completely agree) was used to evaluate the score. In the investigation’s second round, the measuring tools of inclusive general trust (Yamagishi et al., 2015), social capital (Bouchillon, 2014), satisfaction with life (Zhang, 2020), and belief in a just world (Zhang, 2021) were included to ensure criterion-related validity.
Inclusive General Trust
The Inclusive General Trust Scale (IGTS; Yamagishi et al., 2015) was used to measure the grade of inclusive general trust. This scale includes nine items and two subscales for trust tendency (GTS; Yamagishi et al., 2013; Yamagishi & Yamagishi, 1994) and trust preference. All items are rated on a 5-point Scale (1 = strongly disagree, 5 = strongly agree). The Cronbach’s α coefficient in this study was .81.
Belief in a Just World
The Chinese version of the Belief in a Just World Scale (BJW; Dalbert, 1999; Su et al., 2012) was adopted. It is a self-report instrument with 13 items and two dimensions: personal beliefs in a just world and general beliefs in a just world. All items are rated on a 6-point scale (1 = strongly disagree, 6 = strongly agree). The Cronbach’s α coefficient in this study was .93.
Satisfaction with Life
The Chinese version of the Satisfaction with Life Scale (SWLS; Diener, 1985; Xiong & Xu, 2009) was used to assess the level of satisfaction with life. The scale includes five items and responses, ranging from 1 (strongly disagree) to 7 (strongly agree). The Cronbach’s α coefficient in this study was .91.
Social Capital
Social capital was measured using the Social Capital Scale (Dallago et al., 2009), which includes three items. The items are rated on a 5-point Scale (1 = totally disagree, 5 = totally agree). The Cronbach’s α coefficient in this study was .82.
Data Analyses
Data analyses were conducted in two stages. First, EFA was performed on sample 1 using SPSS 23.0 to explore the factor structure of CTS. Second, CFA was conducted on sample 2 using AMOS 23.0 to verify the structure of the scale, and SPSS 23.0 was used to test the reliability and validity of CTS.
Results
Scale Structure
Item Analysis
Discriminant analysis and the homogeneity test were used for item analysis. First, according to the high–low grouping method, the total score of the scale of sample 1 was arranged in descending order; the top 27% and bottom 27% of the participants were respectively recorded as high and low groups. An independent sample t-test was performed on the high and low groups of each item. The results showed that both groups of all items were significantly different (ps < .01), indicating that each item has a good discrimination. Second, a correlation analysis was performed between the scores of each item and the total score. The results showed that the correlation coefficients of all the items were higher than .40, which indicated that these items had a certain degree of homogeneity with the overall trust. Therefore, no items were deleted in this analysis either.
Exploratory Factor Analysis
The results of Bartlett’s test of sphericity (χ2 = 8,642.48, df = 465, p < .001) and the Kaiser–Meyer–Olkin measure (.94) indicated that sample 1 was suitable for an EFA.
Because the current, commonly used methods of EFA have their limitations, this study followed the suggestion of Goretzko et al. (2021), conducting a comprehensive exploration based on the four most commonly used methods: (1) Principal component analysis (PCA): PCA was employed to extract factors. The results showed four factors whose eigenvalues were greater than one, which accounted for 56.16% of the total variance; (2) Scree test: After inspecting the results of the scree test, we found a relative break and slowing trend after the third factor in the scree plot; (3) Parallel analysis (PA): PA was performed using the Monte Carlo PCA software (Watkins, 2000) to determine the number of factors. The results indicated that the eigenvalues of the original data started with smaller values than those of the randomly generated 1,000 simulated data from factor 4; therefore, the number of factors according to the mean of PA was three; (4) Theory interpretability: The items in this scale were developed based on Wu and Huang’s (2012) three-factor model. The first three factors extracted by PCA could correspond to the three dimensions of this model. Considering that the three items (i.e., most people today are trustworthy, honest, and conscientious) included in factor four could be included in factor three according to the content validity, and the PCA method has the limitation of over-extraction (Wang et al., 2016), we decided to keep three factors for further investigation.
PCA was again used to extract three factors in a fixed manner, and the maximum variance was used for orthogonal rotation. Items were deleted based on the following criteria: having a factor loading value of <.40, a common degree of <.40, a cross-loading of <.20, and factor loading values >.40 on two or more factors. After removing 9 items, PCA was repeated with the remaining 22 items. Table 1 shows that the three-factor model explained 57.82% of the total variance. According to Wu and Huang’s (2012) three-factor model of Chinese trust, factor 1 corresponds to the “trust from others” dimension (eight items); factor 2 to the “trust in others” dimension (seven items); and factor 3, to the “public awareness” dimension (seven items), which explain 34.87%, 15.25%, and 7.70% of the total variance, respectively.
Results of EFA and Reliability Analysis.

Scale Validation
Confirmatory Factor Analysis
To validate the scale’s structure, CFA was employed on sample 2 to replicate the 22-item three-factor structure, and the results were as follows: χ2(206) = 1,519.83, p < .001; RMSEA = .09 (90% CI [0.08, 0.09]); SRMR = .08, CFI = .87, TLI = .86, IFI = .87. The model’s fit was not entirely satisfactory. From post corrections through the modified index (MI), we found that A27 was a cross-correction term (the first two corrections both included A27). It was the only item with a standardized factor loading of less than .60. Therefore, we deleted A27, and the model fit was significantly improved, χ2(186) = 1,254.99, p < .001; RMSEA = .08 (90% CI [0.08, 0.09]); SRMR = .07, CFI = .89, TLI = .88, IFI = .89. After deleting A2 (a cross-correction item) by the same standard, the model’s results suggested a good fit (see Figure 1), with χ2(167) = 982.35, p < .001; RMSEA = .08 (90% CI [0.07, 0.08]); SRMR = .07, CFI = .91, TLI = .90, IFI = .91. Considering the possible heterogeneity between samples, we also performed CFA on sample 1. Through comparison, we determined that the model fit of sample on was also significantly improved after deleting A27 and A2. Before deletion, χ2(206) = 839.28, p < .001, RMSEA = .08, SRMR = .06, CFI = .89, TLI = .88, IFI = .89. Post deletion, χ2(167) = 622.95, p < .001, RMSEA = .07, SRMR = .05, CFI = .91, TLI = .90, IFI = .91). Therefore, we finally confirmed a 20-item three-factor structure.
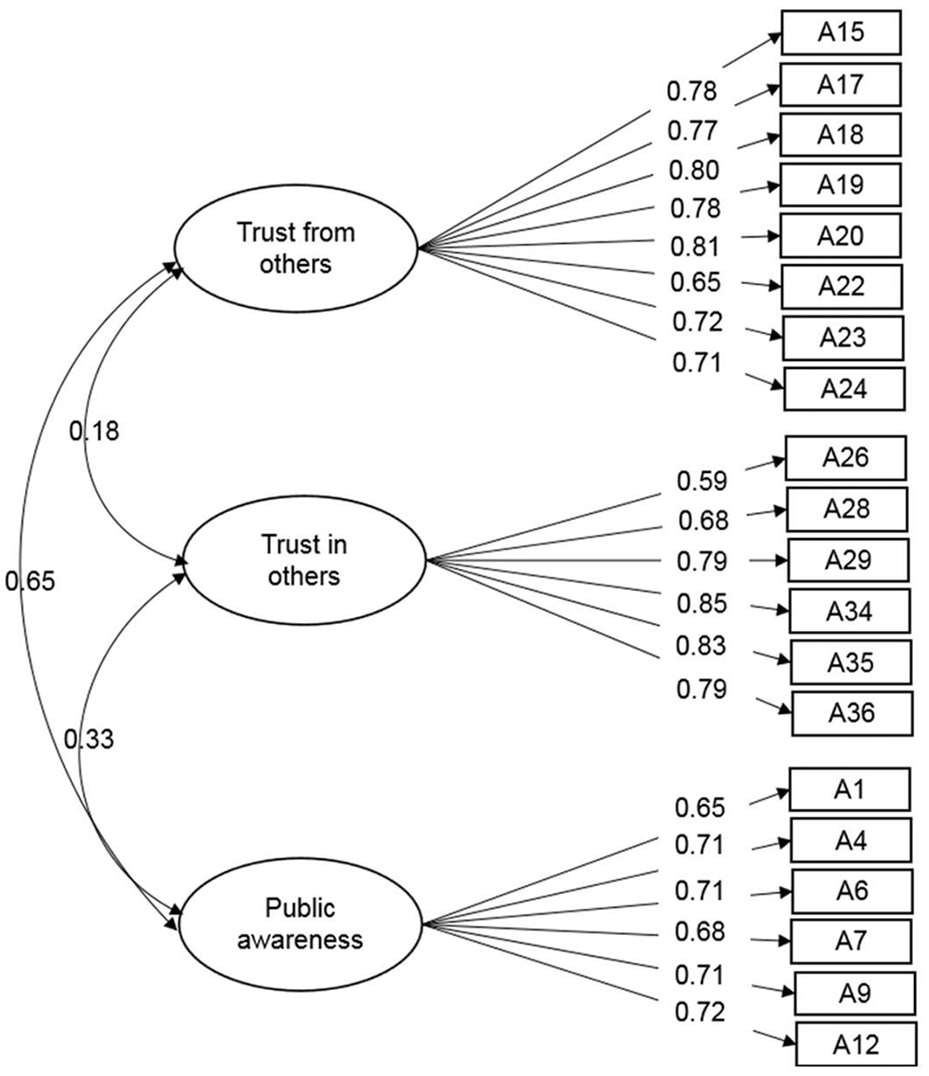
Standardized coefficient model of CFA.
Scale Validity
To test the scale’s convergent validity, we calculated its composite reliability (CR; Raykov, 1997) and average variance extracted (AVE; Fornell & Larcker, 1981). The results (see Table 2) indicate that the CR values of each factor of the scale were .91, .89, and .85, respectively, which were higher than .80, indicating good construct reliability (Raykov, 1997) and convergent validity (Hair et al., 2014). The AVE scores of each factor were .57, .58, and .49, although the AVE value of public awareness (.49) was slightly less than the optimal criterion of .50, according to Fornell and Larcker’s (1981) suggestion, when the AVE score is less than .50, if the combined reliability is higher than .60, the convergent validity of the scale is still acceptable. In addition, the heterotrait-monotrait ratio of correlations (HTMT) was calculated to test the discriminant validity (Henseler et al., 2015; see Table 2). The value of each factor was .23, .65, and .34, which were lower than .85, indicating that the standard for discriminant validity was met (Henseler et al., 2015).
Composite Reliability, AVE Scores, and HTMT Correlations.

Note. AVE = average variance extracted; CR = composite reliability; HTMT = heterotrait-monotrait ratio of correlations.
Thereafter, we conducted the Pearson’s correlation analysis to examine the criterion-related validity of the scale. The results showed that the total scores of CTS were positively correlated with the total scores of IGTS (r = .54, p < .001), BJW (r = .54, p < .001), SWLS (r = .52, p < .001), and Social Capital Scale (r = .49, p < .001). The scores of each factor were also positively correlated with the total scores of IGTS (r = .18 to .55, p < .001), BJW (r = .14 to .59, p < .001), SWLS (r = .30 to .53, p < .001), and Social Capital Scale (r = .08 to .59, p < .001). The results are consistent with previous research. That is, the higher the degree of trust, the higher the level of inclusive general trust, social capital (Bouchillon, 2014), satisfaction with life (Zhang, 2020), and belief in a just world (Zhang, 2021). These findings were also consistent for each dimension of CTS, indicating that the criterion-related validity of this scale was good.
Scale Reliability
The reliability of CTS was tested using the Cronbach’s alpha (α), McDonald’s omega (ω) coefficients, and test-retest reliability values. The results are depicted in Table 3. The Cronbach’s α coefficient for the whole scale and the subscales were .90, .91, .89, and .85. Considering the limitations of Cronbach’s α coefficient (McNeish, 2018), we also used the Omega macro recommended by Hayes and Coutts (2020) to calculate the McDonald’s ω coefficient (McDonald, 1999) for the whole scale and the subscales. The results were .87, .91, .90, and .85. The coefficients of Cronbach’s α and McDonald’s ω were all higher than the suggested standard of .70 (Hair et al., 2014), indicating that the scale had good internal consistency reliability. In addition, the test-retest reliability values of the entire scale and the subscales (N = 70, 3 weeks apart) were .78, .78, .79, and .71. It is generally considered that test-retest reliability values above .75 are excellent, and values between .40 and .75 are considered moderate to good (Fless, 1986). Therefore, this scale showed good temporal stability and external consistency.
Results of Reliability Analysis.

Discussion
This study developed a tool to measure multidimensional trust in Chinese people in general. Differing from previous studies that mainly developed theories through the data-driven method, our study adopted a combination of theory-driven and data-driven methods. This is thought to potentially develop more robust models and measures (Xiong et al., 2018). We used Wu and Huang’s (2012) three-factor model—a bottom-up and culturally adaptable theory developed for the Chinese people—as the theoretical basis for generating the preliminary items. We then validated it based on an empirical survey of 1,382 Chinese participants. While developing the items, we also considered the characteristics of Chinese social values and the tendency of Chinese people to compromise and take a neutral stance. After several rounds of group discussions and expert demonstrations, a more representative, clear, and comprehensive initial scale was formed.
Thereafter, we used an approach of PCA, PA, scree plot, and theory interpretability (Goretzko et al., 2021) to extract three factors, and the content of the factors also basically corresponded to Wu and Huang’s (2012) three-factor model, which verified the rationality of the three-factor model of trust and again demonstrated the possibility of a multidimensional trust structure for Chinese people (Wang & Yamagishi, 1999). Among the results of the factor analysis, the dimension of “trust from others” explained the highest percentage of the total variance of the items (34.87%), which again reflects the important role of the individual’s own trustworthiness in trust and supports the social projection mechanism (Krueger et al., 2012). It also suggests that the trustor’s own traits (e.g., propensity to trust, trust preferences) deserves more attention. In addition, this also reflects the focus of Chinese people on “self-requirement” in trust, and highlights the concept of “leading by example” and “strict self-discipline,” which is formed by Chinese people under their collectivist culture.
After forming the initial scale, this study also tested the reliability and validity of the scale through multiple indicators. First, in terms of validity, the results of construct validity, convergent validity, discriminant validity, and criterion-related validity showed that the three-factor structural model fit well, and the test indicators of convergent validity and discriminant validity have also achieved satisfactory results. The variables such as social capital (Bouchillon, 2014), satisfaction with life (Zhang, 2020), and belief in a just world (Zhang, 2021), which have been shown to be strongly related to trust in previous studies, have also been shown to be significantly related to the results of CTS, and these suggest that CTS has good validity. Secondly, in terms of reliability, the results of Cronbach’s α, McDonald’s ω and test-retest reliability have all reached the statistical standard, which also shows that CTS has good reliability and temporal stability. Among them, the Cronbach’s α coefficient is between .85 and .91, which is relatively good compared with the internal consistency coefficient of ITS, GTS and IGTS in Chinese participates (Cao et al., 2022; Li et al., 2019; Yuan et al., 2021).
As a scale developed on the basis of the three-factor structure of Chinese trust, CTS mainly has three positive aspects. The first one is about the expansion of multidimensional measurement of trust structure. As mentioned before, although some new theories of trust structure have been proposed in recent years, the corresponding measurement tools have not yet kept pace. CTS focuses on both the trustor and the trustee, and the results also confirm the existence of multi-dimensionality, which enriches the development of multi-dimensional measurement tools for trust to some extent. The second is the deepening of cross-cultural research on trust. Although cross-cultural research has received a lot of attention in the field of trust, most of them focus on trust levels, influencing factors, etc., while the exploration of structural differences mostly starts from theories or foreign measurement tools. However, as mentioned earlier, Chinese people’s trust structure is influenced by traditional culture and there may be some differences (Wu & Huang, 2012), which may lead to incomplete Chinese people’s trust measurement. The CTS contains both the trustee perspective of traditional trust scales and a new dimension based on cultural differences, which provides a new perspective and tool for cross-cultural study of trust structures. The third is in terms of practical application. With the rapid development of information technology and the continuous increase of social mobility, the traditional “acquaintance society” is being impacted by the “stranger society” in China. Trust has been a long-standing multidisciplinary research field, and has continued to receive attention in the fields of management, psychology, education, and technological development. At the same time, in recent years, trust has also been widely used to reveal the intermediary and regulatory mechanisms between the environment and psychological outcomes (Alessandri et al., 2020; Lin et al., 2021). However, there is still a lack of trust scales available in China, and we hope that CTS can provide more vitality for China’s trust research.
As a preliminary attempt to develop a trust measurement instrument in the Chinese cultural context, this study has some limitations. First, regarding the validation of trust structures, since this scale was developed and validated based on an existing theoretical model, we did not verify other possible model structures (e.g., the higher-order model). Although the results of the validation factor analysis confirmed the good construct validity of the three-factor structure, the results of the PCA showed four factors, and the existence of additional structures from a data-driven perspective remains to be further explored. Second, about the homogeneity of the sample. Although this study also expanded the scope of participants through the online platform, the age of the sample is still mainly concentrated in the 20s, which may be related to the higher level of online activity in this age group than in older age groups. Trust was confirmed to have age differences (Bailey & Leon, 2019); therefore, the indicators of the scale need to be interpreted with caution, while future studies need to adopt more diverse survey methods and include more diverse groups from different cities, age stages, occupations, and ethnicities to further test the reliability of the scale and explore the differences in CTS results on demographic variables such as age and gender. Third, although the CTS was developed based on the Chinese theory of trust structure, since the samples were all Chinese, whether cross-cultural differences exist, and their type of differences in the scale and structure need to be validated, compared, and explored in other cultural contexts.
Conclusion
In conclusion, this study confirmed the validity of the three-factor model of Chinese trust and developed the CTS that includes 20 items and three dimensions, namely, trust from others, trust in others, and public awareness. Moreover, the CTS developed in this study was found to have good reliability and validity, making it a potentially effective tool for Chinese trust measurement.
Supplemental Material
sj-docx-1-sgo-10.1177_21582440241266431 – Supplemental material for Development and Validation of the Chinese Trust Scale: A Culturally Appropriate Measure Based on the Three-Factor Model of Chinese Trust
Supplemental material, sj-docx-1-sgo-10.1177_21582440241266431 for Development and Validation of the Chinese Trust Scale: A Culturally Appropriate Measure Based on the Three-Factor Model of Chinese Trust by Yunzi Xie, Zhengmin Zhang, Jixia Wu and Wenjing He in SAGE Open
Footnotes
Authors Contributions
Conceptualization, J. W.; Items development, J. W., Y. X., Z. Z., and W. H.; Data collection and analysis, Y. X. and Z. Z.; Writing—original manuscript, Y. X. and Z. Z.; Writing—review and editing, J. W. All authors contributed to the development of this manuscript, reviewed drafts, and approved the final version.
Declaration of Conflicting Interests
The author(s) declared no potential conflicts of interest with respect to the research, authorship, and/or publication of this article.
Funding
The author(s) disclosed receipt of the following financial support for the research, authorship, and/or publication of this article: This study was supported by the Social Science Foundation of Jiangsu Province [Grant No. 20SHA004].
Ethical Approval
This project was approved by the Ethics Committee of Soochow University. Informed consent was obtained from all participants included in the study.
Data Availability Statement
The data that support the findings of this study are available from the corresponding author upon reasonable request.
Supplemental Material
Supplemental material for this article is available online.
References
Supplementary Material
Please find the following supplemental material available below.
For Open Access articles published under a Creative Commons License, all supplemental material carries the same license as the article it is associated with.
For non-Open Access articles published, all supplemental material carries a non-exclusive license, and permission requests for re-use of supplemental material or any part of supplemental material shall be sent directly to the copyright owner as specified in the copyright notice associated with the article.