
Abstract
The optical component industry is an industry that generates a high profit, yet it has rarely been explored on its management in the previous research. This study aims to investigate the impact of environmental (E), social (S), and governance (G) performance (ESGP) on firm competitiveness. Specifically, by using ordinal least square (OLS) regression, we analyze how overall ESGP and its components (E, S, G) impact the competitiveness including component of marketability, profitability, and innovation ability of global optical component firms, including those from Taiwan, Japan, China, and South Korea. We developed a meta-frontier data envelopment analysis (DEA) model including meta frontier, group frontier, and operational technology gap ratio to estimate firm competitiveness and analyzed 95 firm-year observations from 2016 to 2020. The meta-frontier DEA results indicate that optical component firms from Taiwan and Japan exhibit relatively higher competitiveness. Additionally, the ordinary least squares and truncated regression results reveal a significant positive association between ESGP and firm competitiveness, aligning with the resource-based view theory, where firms that performs in ESG practices obtaining unique resources and capabilities would develop a long-term competitive advantages, and also aligning with stakeholder theory, where firms that engage in ESG attract support from stakeholders, leading to a higher firm performance and competitiveness. The findings of the provides insights for the optical policymakers of the proper resource allocation to maximize firm competitiveness under the influence of ESGP.
Plain Language Summary
The optical component industry plays a crucial role in modern technology and generates high profits. However, little research has explored how companies in this industry manage their business performance. This study examines how Environmental, Social, and Governance (ESG) performance affects the competitiveness of optical component firms worldwide, focusing on companies from Taiwan, Japan, China, and South Korea. To measure firm competitiveness, we use a method called meta-frontier data envelopment analysis (DEA) and support our findings with ordinary least squares (OLS) regression analysis. Competitiveness is assessed in three key areas: marketability, profitability, and innovation ability. Our study analyzes 95 firm-year data points from 2016 to 2020 to understand the link between ESG performance and business success. The results show that firms in Taiwan and Japan generally have higher competitiveness compared to their counterparts in China and South Korea. Additionally, we find that companies with strong ESG performance tend to be more competitive. This aligns with two well-known theories: 1. Resource-based view theory – Companies that invest in ESG build unique resources and long-term advantages. 2. Stakeholder theory – Companies that perform well in ESG attract greater support from investors, customers, and society, leading to better business performance. Our findings provide useful insights for business leaders and policymakers in the optical component industry, helping them allocate resources effectively to enhance firm competitiveness through ESG strategies.
Introduction
The optical component industry has always been in a competitive and profitable situation, where the profit-generating ability of an organization always draws the attention of investors. Although firms aim to expand the organization, competitiveness is the main focus of firms to keep up with competitors (D. Yang et al., 2022). In this study, the firm competitiveness of the optical components industry viewed in three dimensions, namely, innovation ability, profitability, and marketability efficiency. Companies must invest in R&D to secure competitive advantages through differentiation and intellectual property. Profitability reflects financial health and attracts investors, while marketability shows the market's response to the company's performance.
In this modern era, the importance of chips for intelligent machines is like the heart of humans; it is essential for aerospace, military industry, automatic controls, medicine, transportation, telecommunication, safety controls. Optical components, such as the lens and camera lens, are the eyes of all types of equipment to comply with chips in the aforesaid areas, allowing equipment to implement the intelligent operation. Vantage Market Research (2022) forecasted that Asia Pacific is the fastest-growing region of optical component industry, where Taiwan, Japan, South Korea, and China are the regions that are mainly covered. The optical component market was valued at USD 42.32 billion in 2021 and is projected to attain a value of USD 60.55 billion by 2028 at a compound annual growth rate of 4.9% in 2022 to 2028. Hence, the companies chosen in this study cover the top-performing companies in the optical component industry. This could help company CEOs or managers to understand their competitiveness and shortcomings compared with their rivals in the field.
In addition, the relationship between environmental (E), social (S), and governance (G) performance (ESGP) and companies’ performance have been looked into in many prior studies that focus on different regions and industries, which will be covered in Section “Literature Review.” The European Commission (2021) proposed the Carbon Border Adjustment Mechanism, where it set a series of policies to trade with EU countries to fight climate change, targeting a 55% reduction in carbon emissions by 2030 compared with 1990 levels and to become a climate-neutral continent by 2050. The carbon emissions generated in the process of manufacturing optical components would be covered if the company excels in E performance, where it monitors the impact of the company's operational process on the environment. The European Commission has initiated several reform activities to enhance the quality of corporate governance, where ESGP is one of the main focuses, causing the increasing importance of ESGP (Velte, 2017). As the inevitable trend of incorporating ESG into corporate governance, the organization's resource allocation could be affected, with the importance of understanding the impact of ESG on the company's competitiveness and performance.
However, prior academic studies do not have enough coverage of the relationship between ESGP and the competitiveness or efficiency performance of the optical component industry, where most of the literatures focused more on LED/LCD industry (Chiu et al., 2008; Z.-Y. Lee & Pai, 2011; Sun, 2014; C.-N. Wang et al., 2018; K. Wang et al., 2021).None of the aforementioned previous studies had examined firm competitiveness, which includes various aspects by combining innovation capability, profitability, and marketability efficiency, as in this study. In addition, it is rare to examine the possible impact of ESGP on the firm competitiveness of the optical components industry.
This study focuses on exploring the relationship between the ESGP and the competitiveness of nineteen top optical component manufacturing organizations from four Asian countries, namely, Taiwan, Japan, South Korea, and China, from 2016 to 2020. The study first identifies the firm competitiveness using meta-frontier data envelopment analysis (DEA) and then examines the impact of ESGP on firm competitiveness by using ordinal least square (OLS) regression model. This study fills the gap where scant research focused on solely optical component industry, incorporate R&D efficiency, profitability efficiency, and marketability efficiency as the competitiveness. The optical component industry is an innovation-intensive industry, which is suitable for exploring the competitiveness that includes the R&D efficiency of the firms. The companies from these four countries were chosen because they are the best performance companies in Asian region.
The Data Envelopment Analysis (DEA) model is a linear programming-based method used to measure the efficiency performance of decision-making units (DMUs) with multiple inputs and outputs (Charnes et al., 1978, 1997). Various kinds of DEA methods have been developed throughout the years for various functions and purposes (Cheng et al., 2020). In the present study, the meta-frontier DEA method was used to measure the meta-frontier and group frontier efficiencies and inefficiencies by including the technology gap ratio among the organizations. This method could serve as the first contribution of this study. The meta-frontier DEA method is new to the optical component industry but is used in various studies of other industries (Chiu et al., 2012, 2016; Q. Wang et al., 2013; Yu & Chen, 2020; Zhang et al., 2013). On the other hand, this study combines the innovation ability, profitability, and marketability efficiencies to identify the firm competitiveness of the optical component companies is the innovative contribution to the literature where rare prior studies had been done. Prior studies only studied one of the components but not all three. This serves as the second contribution of study.
Prior studies on the relationship between the ESGP and the competitiveness of companies from the optical component industry are few, serving as the third contribution of study. The importance of how the results show the ESGP could positively affect firm competitiveness, aligning with the stakeholders theory and resource-based view (RBV) theory, emphasized to raise awareness among stakeholders and investors, which is the fourth contribution of this study. This study will continue with literature review in Section “Literature Review,” research design in Section “Research and Data Methodology,” empirical results and analysis in Section “Empirical Results and Analysis”, and concluding remarks in Section “Empirical Results and Analysis”.
Literature Review
Overview of Optical Industry
The optical industry is the opto-electronic industry that covers five main sectors: optical technology, communications, components, device and equipment, and application (Chang et al., 2002). The optical technology sector consists of three sub-sectors, namely, optical storage, optical output, and optical input. The optical communications sector consists of products, such as fiber and optical cables, optical connectors, optical active components, and more. The optical component sector consists of laser diode, LED, and LCD. The optical device and equipment sector consists of optical elements and optical equipment. The optical application sector consists of optical-electronic measurement, laser medical instruments, laser machinery, and solar application.
Prior Studies in Optical Industry
Due to its various advantages, DEA has been widely applied in prior studies. Table 1 presents the prior studies used DEA models for measuring efficiency. As shown in Table 1, most of the studies have been used the traditional DEA models, such as CCR, BCC, Malmquist, Window Analysist (Broekel et al., 2018; Jens & Petra, 2009; Vladislav et al., 2016). Although traditional DEA is simple and widely used, it assumes one common frontier for all units, limiting its ability to capture technology differences. This assumption implies that all firms operate under the same production technology, regardless of regional, sectoral, or technological differences. In practice, however, firms often face heterogeneous environments—such as varying resource endowments, regulatory conditions, or technological capabilities—that shape their production possibilities.
DEA Models Used in Prior Studies.
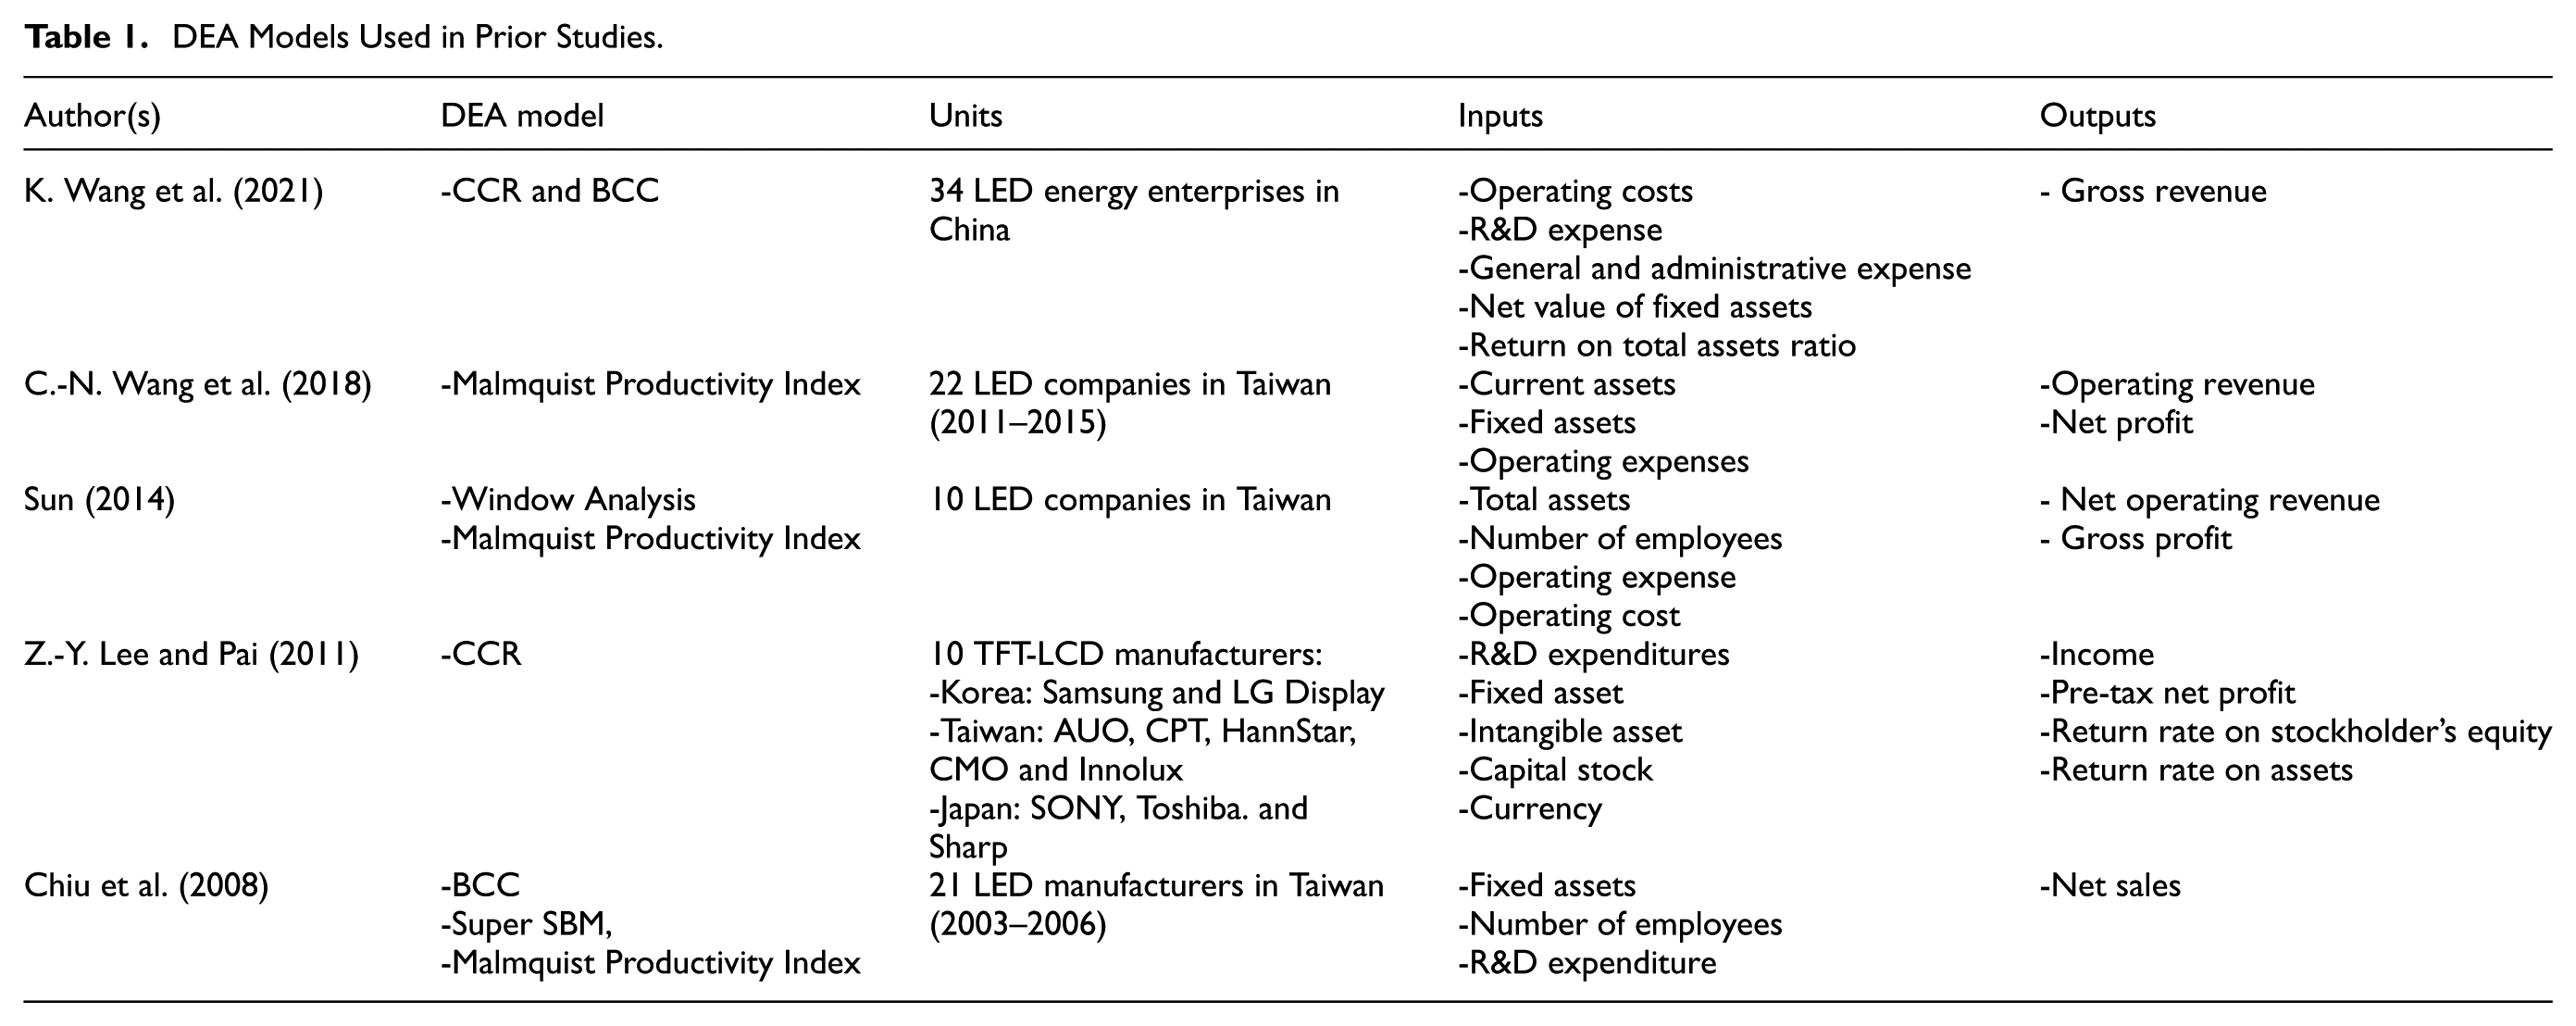
Accordingly, several DEA models have been developed throughout the years to serve different functions, and they obtain different findings (Cheng et al., 2020). Among them, the two-stage meta-frontier DEA model incorporates the production process and intermediation approaches to identify the inputs, intermediates, and outputs using a two-stage network system and identify the group frontier and technology gap ratio using the meta-frontier (Chiu et al., 2016; Fei & Lin, 2016; Q. Wang et al., 2013). The two-stage meta-frontier DEA model overcomes the disadvantages of traditional models by integrating both production and intermediation processes by modeling inputs, intermediates, and outputs within a two-stage network system. It further identifies group frontiers and quantifies the technology gap ratio (TGR), offering a more comprehensive assessment of cross-group efficiency (Chiu et al., 2016; Fei & Lin, 2016; Q. Wang et al., 2013).
ESG and Competitiveness
The association between ESG performance (ESGP) and firm outcomes has received growing attention among managers and policymakers (Nirino et al., 2021). According to the resource-based view and Stakeholder theory, the strategic allocation of resources and the effective implementation of ESG activities can serve as valuable assets that provide firms with sustainable competitive advantage (Elia et al., 2021). Zheng and Lee (2025) stated that ESG components have been contributed to shape firms' outcomes across varying market contexts and time periods. ESG practices demonstrate that businesses affect not only profits but also the environment, society, and governance (Gillan et al., 2021). Specifically, (E) initiatives such as sustainable sourcing and emission reduction lower costs and appeal to eco-conscious stakeholders (C. L. Lee & Liang, 2024), while (S) engagement enhances reputation, loyalty, and long-term resilience (Abdi et al., 2022). Meanwhile, (G) is strongly linked to efficiency by promoting transparency, reducing risks, and attracting investors (Xie et al., 2019).
Prior studies suggest that ESGP may enhance corporate value creation and strengthen sustainable competitive advantage (Behl et al., 2022; Miralles-Quirós et al., 2019; Zumente & Bistrova, 2021). Firms that commit to sustainability are often found to attract a broader investor base, lower their cost of capital, and improve operational efficiency (Bridoux & Stoelhorst, 2022; Freeman et al., 2021). However, the empirical evidence on the ESGP–firm competitiveness relationship remains mixed, with some studies reporting strong positive effects, while others find weak or even indirect links (as shown in Table 2). Consequently, there is a pressing need to re-examine this relationship, particularly in underexplored industries such as the optical sector, where ESG practices and performance outcomes may follow different patterns compared to more widely studied industries like LCD/LED (Chiu et al., 2008; Z.-Y. Lee & Pai, 2011; Sun, 2014; Q. Wang et al., 2018; K. Wang et al., 2021). Based on the discussion above, the following hypothesis is developed:
H0: ESGP would significantly impact the firm competitiveness.
Literature Review ESG and Competitiveness.

Research and Data Methodology
Research Framework and Competitiveness Evaluation Model
The conceptual framework that contains the variables studied in this paper is shown in Figure 1. Financial statements and ESG data of the companies were obtained from the Thomson Reuters datastream database. ESGP was an independent variable and consists of three components: E, S, and G. The return rate on assets (ROA), leverage (LEV), age (AGE), and size (SIZE) are the control variables.
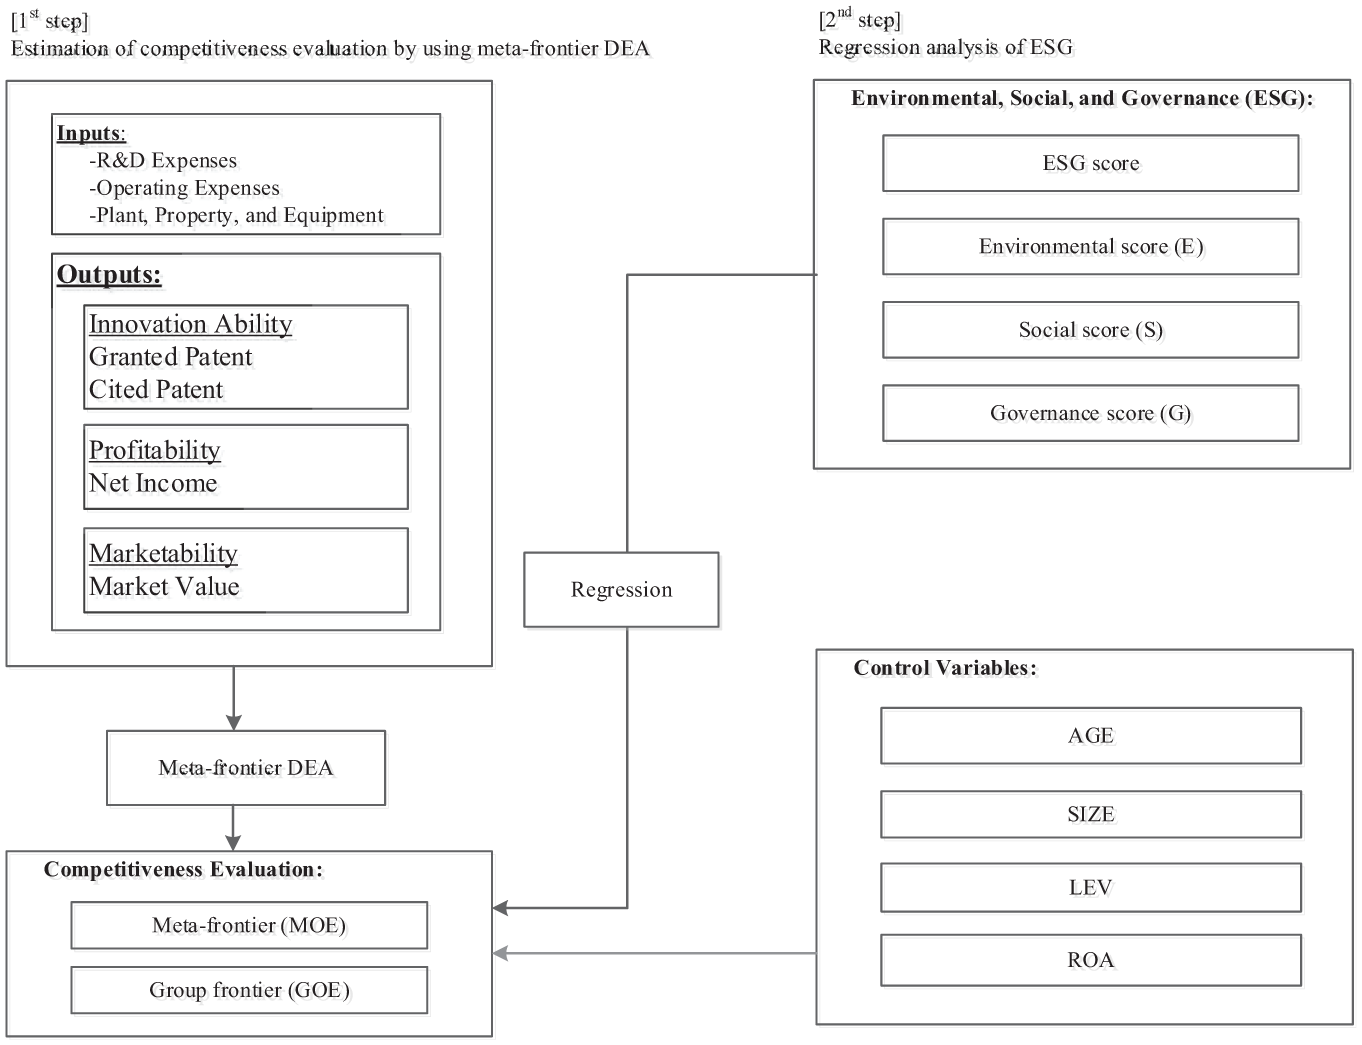
Conceptual framework.
This study obtained the data from multiple sources. While the granted patents and cited patents are collected from the Lens, variables used for DEA measurement and regression analysis are from Thomson Reuters Eikon database. During the data collection, missing data were eliminated. The sample data for this study includes 19 firms during a period of 2016–2020, with 95 firm-year observations. The variables used for DEA model are based on previous studies which are summarized in Table 3. For the regression analysis, ESGP is served as independent variable which includes three components: Environment (E), Social (S), and Governance (G), with the measurement scores range from 0 to 100. To be specific, firms with higher ESG score are considered to perform well on the ESG activities. Control variables included in the regression consists of return on assets (ROA), leverage (LEV), firm age (AGE), and the firm size (SIZE).
Definitions of DEA-related Variables.

Figure 1 illustrates a two-step framework for evaluating the impact of ESGP on firm competitiveness, incorporating meta-frontier DEA and regression analysis. The first step focuses on measuring firm competitiveness through an efficiency assessment that compares inputs and outputs across firms using the meta-frontier DEA method. The details of meta-frontier DEA models and variables are discussed below. The second step, by using OLS regression model, examines how ESGP affect firm competitiveness while controlling for various firm-specific variables. E-score measures the firm's environmental practices, such as resource use score, emission score, and innovation score. On the other hand, S score measures the aspects of workforce, human rights score, community score, and product responsibility score. G score shows the quality of corporate governance, including management score, shareholders score, and CSR strategy score. The additional truncation and bootstrap step ensure that the data is pre-processed to remove outliers or inconsistencies, thereby improving the robustness and reliability of the DEA and regression results.
Table 3 shows the meta-frontier DEA input variables (R&D expenses, operating expenses, and fixed assets) and output variables including innovation capability (granted and cited patents), profitability (net income), and marketability (market value) to evaluate the competitiveness of the optical components industry.
R&D expenditure represents a company's investment in innovation and technological advancement, which is the company’s innovation input. Operating expenses reflect the resources spent on the business operation process, where it includes the non-R&D operating costs. Property, plant and equipment records the firm's capacity to produce goods and services. Including this variable ensures that the assessment takes into account the role of capital infrastructure in supporting R&D and overall firm productivity. Granted and cited patents demonstrate the effectiveness and quality of the firm's R&D investments. Net income shows the profit generation situation of the company. Market value represents the investors' perception of the firm's future growth and profitability.
Meta-frontier Data Envelopment Analysis
Meta-frontier includes all data from different regions to investigate firm competitiveness as a whole. Group frontier divides the data according to the region of the companies to identify the technological difference that occurs among regions or groups. The operational technology gap ratio (OTGR) shows the technological gap between the meta-frontier and group frontier. Several prior studies also utilized the meta-frontier DEA in identifying the efficiency and inefficiencies of different fields (Chiu et al., 2012; Feng et al., 2021; Ma et al., 2021; Xiao et al., 2022). The meta-frontier DEA approach offers several advantages. First, it accounts for technological heterogeneity by allowing firms to be evaluated relative to both their own group frontier and the global meta-frontier, which reflects the best available technology across all groups (Q. Wang et al., 2013). This enables more meaningful cross-group comparisons than conventional DEA, which assumes all decision-making units (DMUs) operate under a common technology as the benchmark could not view the industry in whole. Group frontier considers the optical firm as a structure itself, while meta-frontier taking all the firms into account at once (Goyal et al., 2019). Second, OTGR, which measures the distance between a group frontier and the meta-frontier (O’Donnell et al., 2008), thereby identifying the extent to which firms lag behind the global best practice. Third, it improves the fairness and accuracy of efficiency measurement, as firms are not unfairly penalized for operating under less advanced technologies. Finally, the meta-frontier framework offers useful insights for policy and managerial decision-making to enhance overall competitiveness. The details and formulae of the meta-frontier, group frontier, and OTGR are elaborated in Sections “Meta-frontier and Group Frontiers of the Directional Distance Function” and “Technology Gap Ratio and Derivation of Meta-Frontier Inefficiency.”
Meta-Frontier and Group Frontiers of the Directional Distance Function
O’Donnell et al. (2008) established meta-frontier and group frontiers, where the meta-frontier includes the DMUs from all groups and the group frontiers are the DMUs for individual groups, to evaluate the influence of technological heterogeneity. Assume that a batch of N companies and these companies can be allocated into p dissimilar groups (

The meta-technology and group-specific technology sets were established as the formula:
Furthermore, the meta-technology set includes the G group-specific technology set


where
Consequently, the operational efficiency in the meta-technology and group-specific technology sets are defined as
Technology gap ratio and derivation of meta-frontier inefficiency

The ratios between the meta-frontier efficiency of the input and the group-specific frontier efficiency of the input and between the meta-frontier efficiency of the output and the group-specific frontiers efficiency of the output were connected as the OTGR. The ratios are formulated as:

The closer the OTGR is to one, the narrower the gap of the ratio is. In other words, the efficiencies of the input and output of the group frontiers are more adjacent compared with those of the meta-frontier.
According to the OTGR, the target firm in group-specific frontiers only differentiates between the ratios of the two frontiers and could not investigate the derivation of meta-frontier inefficiency (Chiu et al., 2012, 2013). Consequently, this paper further breaks down the inefficiencies of the target firm under the meta-frontier into operational technology gap inefficiency (OTGI) and operational technical inefficiency (OTI).
Furthermore, OTGI represents the inefficiency of the target firm in group-specific frontiers. According to the technical gap between the meta-frontier and group-specific frontiers, OTGI is expressed as:

Furthermore, OTI exhibits the managerial inefficiency of the group-specific frontiers of the target firm. According to the input excess in the operational or output shortfall in the production process, OTI is expressed as:

Thus, the operational inefficiencies examined using the meta-frontier can be expressed as:

Empirical Results and Analysis
Descriptive Statistics
Table 4 shows the descriptive statistics of the variables used for DEA model to examine the efficiency of optical firms. Overall, the total sample showed that most of the variables had negative percentage changes except for operating expenses, PPE, and market value. Granted patent had the highest negative percentage change of 0.13% whereas market value had the highest positive percentage change of 0.39%. Companies from the mainland had the best overall results, as all of their variables had positive percentage changes. In comparison, the companies from Korea had the worst overall results, as almost all their variables had negative percentage changes except for market value.
Descriptive Statistic of DEA Variables in Country or Region.

Note. All variables have units of thousands (TWD) except for Granted Patent and Cited Patent. K-S test shows that p-value is significant at .01 level.
The Pearson correlation coefficients of the input and output variables of the meta-frontier DEA model are shown in Table 5. The results show a remarkable positive relationship between all the input and output variables. The positive relationship between variables indicates that if an increase in inputs occurs, outputs will increase as well, which means that it achieves the assumption of DEA of the isotonicity relations. Hence, the number of samples used should be at least twice the sum of the number of input and output variables. The criterion was met for this study when seven variables and 95 firm-year observations were included. In other words, the validity of the dynamic DEA in this study was established.
Correlation Coefficients of DEA Variables.

Correlation is significant at .05 level.
Technology Gap Ratio Analysis from the Global Optical Component Industry
This study has two stages. The first stage utilizes the meta-frontier DEA model to identify the competitiveness of the optical component industry. The mean of efficiency (MOE) and mean of inefficiency (MOI) values of the meta-frontier and group-specific frontiers (GOE) were examined, and the empirical results are presented in Table 6. Among the 19 companies, three companies (Asia Optical, Canon, and Largan Precision) are relatively efficient (MOE and GOE are equal to 1) when the meta-technology set and group technology set were considered the evaluation basis. Therefore, these companies are competitive. Among the efficient companies, one is in Japan, and two are in Taiwan, indicating that the three efficient companies allocate their resources more efficiently to increase their efficiency.
Mean Efficiency and Inefficiency of Meta-frontier and Group Frontiers of Optical Component Industry.

When the group technology set was utilized as the evaluation basis, only one company (Hoya from Japan) turned out efficient (GOE = 1), which indicates that it is efficient by viewing it under the group technology set, the heterogeneity of technology between the meta-frontier and group frontiers occurs in this company. Considering that only Hoya from Japan was considered efficient under the group technology set, then no technology heterogeneity exists in the companies in Taiwan, China, and South Korea. In terms of OTGI, Ohara from Japan had the highest OTGI (0.386), followed by Sekonix from South Korea (0.383). Ohara and Sekonix had the largest heterogeneity of technology between the meta-frontier and group frontiers among all the studied companies.
The results of the mean of efficiency and inefficiency of the meta-frontier and group frontiers of the country or region from 2016 to 2020 are shown in Table 7. Overall, the results show that no company was operationally efficient (MOE and GOE are equal to 1). However, the companies in Japan and Taiwan had a relatively higher efficiency performance compared with the companies in China and South Korea, meaning that they have higher competitiveness. The companies in South Korea had the lowest efficiency performance.
Mean Efficiency and Inefficiency of Meta-frontier and Group Frontiers of Country or Region from 2016 to 2020.

When using the group technology set as the evaluation basis, the companies in South Korea turned out efficient (GOE = 1) in 2016 and 2018, but the companies in Japan had a higher GOE in the five-year period. Generally, the companies in South Korea also had the highest OTGI whereas the companies in Taiwan had the lowest OTGI in the 5-year period.
Meta-Frontier Inefficiencies from the Global Optical Component Industry
Many studies explored the efficiency performance of companies from different industries using various types of DEA models, but few studies focused on meta-frontier efficiencies (Chao et al., 2018; Chiu et al., 2016; Lu et al., 2023). The studies that explored the meta-frontier efficiencies focused on companies from different industries. The present study is the first to explore the meta-frontier inefficiencies of global companies from the optical component industry.
The MOI values of the global companies in the optical component industry are shown in Tables 6 and 7. The main reason for the results of the MOI could be due to its breakdown as the inefficiencies of the target company in GOE (OTGI) and the managerial inefficiencies of the target company in GOE (OTI). The OTI has to be equal to zero when GOE is unity. The MOI is derived primarily from OTGI, such as that in Hoya from Japan. The GOE has to be equal to MOE when OTGI is equal to zero, such as that in Olympus from Japan. These results indicate that the inefficiency might be extracted from the input and output excess or output shortfall.
According to Table 6, Sekonix from South Korea had the highest MOI (0.447) among the 19 companies, followed by Ohara from Japan (0.400). According to Table 7, the companies in South Korea had the highest MOI overall, and they had the highest MOI in 2019 (0.446). In comparison, the companies in Taiwan had the lowest MOI in 2018 (0.066).
Relationship Between ESGP and Competitiveness
The second stage examines the relationships of ESGP and its components with MOE, GOE, and OTGR using OLS and truncated regression. The OLS regression results of the relationships of ESG score and ESG components with MOE, GOE, and OTGR are shown in Table 8. ESG affected MOE positively (coefficient = 0.003, p < .01). The ESG components also positively affected MOE (E coefficient = 0.003, p < .01; S coefficient = 0.003, p < .01; G coefficient = 0.003, p < .01). By contrast, ESG had no significant relationship with GOE (coefficient = 0.001, p > .01). E and G positively affected GOE (coefficient = 0.001, p < .10; coefficient = 0.001, p < .05 respectively).
Regression Results of ESG and ESG Components.

Note. ESG = ESG score; E = environmental score; S = social score; G = governance score; ROA = net income/total assets; LEV = total liability/ total asset; AGE = logged firm age; SIZE = logged total asset.
Statistical significance at 1% level.
Statistical significance at 5% level.
Statistical significance at 10% level.
Furthermore, ESG positively affects OTGR (coefficient = 0.003, p < .01). The components of ESG also positively affect OTGR (E coefficient = 0.002, p < .01; S coefficient = 0.003, p < .01; G coefficient = 0.002, p < .01). The results indicate that the effect of ESG and its components on MOE and OTGR were remarkable, whereas only the effects of the E and G on GOE was substantial.
Four control variables were added to the regression model. The result showed that only ROA positively affected MOE, and LEV and AGE positively affected GOE, where the effect of LEV was more substantial than the effect of AGE on average. ROA and LEV positively affected OTGR, where the effect of ROA was slightly more remarkable than the effect of LEV on average. SIZE had no considerable effects on MOE, GOE, and OTGR. The unablated variance inflation factor of all the components was lower than 5, which indicates the absence of a multicollinearity issue in this study (Khong et al., 2020; Pakravan-Charvadeh et al., 2021).
The result accepting H0 as ESGP positively impacts firm competitiveness, which is similar to prior studies (Broadstock et al., 2020; Brogi & Lagasio, 2019; Dalal & Thaker, 2019; Di Simone et al., 2022; Kluza et al., 2021; Nekhili et al., 2021; Tang, 2022; Zhao et al., 2018; Zhou et al., 2022). This result could be interpreted as firms with strong ESGP are viewed more favorably by consumers, investors, and other stakeholders. A positive reputation helps attract and retain customers, leading to higher sales and market share. Therefore, stakeholders and investors should be aware of the importance of ESGP in making decisions and investing more in ESG, as ESG engagement benefits from its involvement in firms’ financial activities and social responsibility engagement (Chouaibi et al., 2022).
Discussion
This study explored firm competitiveness in the optical component industry in East Asia, which is rare to find in prior studies. Prior studies focused on other optical-related industries, such as LED or LCD manufacturing and optical fiber manufacturing. Moreover, the relationship between ESGP and competitiveness by integrating meta-frontier DEA and OLS regression model has been rarely examined in prior studies, especially in the optical component industry.
The results from Table 6 indicate that Asia Optical, Canon, and Largan Precision are highly competitive, as they are efficient for meta-frontier and group frontier. They allocate their resources and investment efficiently to obtain the most ideal outcome and increase their competitiveness (Du et al., 2014). Companies with lower competitiveness should try to reallocate their resources in a more efficient form and spare their investment into R&D investment to obtain more competitive advantage (Xu et al., 2019)
The findings are consistent with both RBV and stakeholder theory. From the RBV perspective, ESGP can be seen as a strategic capability that enhances competitiveness when it is effectively embedded in firms’ resource allocation and operational processes. The high efficiency of Taiwanese and Japanese firms, particularly Asia Optical, Canon, and Largan Precision, suggests that these firms have developed ESG-related capabilities that are valuable, rare, and difficult to replicate. Their ability to leverage ESGP to strengthen both efficiency and competitiveness highlights the role of ESG as a dynamic capability that supports long-term advantage. However, the weak significance of environmental and governance dimensions on GOE indicates that institutional structures and existing regulatory frameworks in the region may reduce the differentiation effect of these pillars. Environmental initiatives may be shaped more by national policy frameworks than firm-specific strategies, thereby limiting their contribution to performance variation. The positive association between ESGP, MOE, and OTGR further reinforces the notion that ESG-related capabilities function as dynamic resources that enable firms to adapt to technological heterogeneity and industry demands.
From the perspective of Stakeholder Theory, the consistently positive role of ESGP in shaping efficiency and competitiveness underscores the value of aligning with stakeholder expectations. The higher GOE or OTGR observed in firms such as Hoya (Japan), Ohara (Japan) and Sekonix (South Korea) reflect disparities in R&D intensity and innovation ecosystems across the region. Countries with stronger R&D support and industrial policy, such as Taiwan and Japan, appear better positioned to translate ESG practices into technological competitiveness, whereas firms in South Korea and China face greater challenges in bridging the technology frontier. These results highlight that ESGP contributes not only to firm-level resource advantages but also to stakeholder trust and legitimacy, with regional policy environments and innovation capacity acting as critical boundary conditions. Overall, the findings suggest that ESGP operates as both a strategic resource and a stakeholder engagement mechanism, while policy and R&D disparities mediate its effectiveness in addressing technological heterogeneity.
The results of the meta-frontier DEA model in DDF could exhibit the meta-frontier and group frontier among the companies and show the inefficiencies of the companies. Some of the companies that are included in the samples were removed due to data unavailability. The regression results of ESGP and GOE were unremarkable possibly because of the small number of samples in each group. Future research could try using a similar method with a larger number of samples in each group so that the method could be more accurate.
Conclusion
This study explores the relationship between the ESGP and the competitiveness of top-performing optical component manufacturing organizations from four Asian countries, namely, Taiwan, Japan, South Korea, and China, from 2016 to 2020. The results show that the optical component companies from Taiwan and Japan have better results, which means that they have higher overall competitiveness. Hence, the companies from China and South Korea are suggested to refer to the companies from Taiwan and Japan to improve their competitiveness. ESGP has a remarkably positive relationship with MOE and OTGR and a less remarkable relationship with GOE.
This study utilized meta-frontier DEA to evaluate the efficiency of optical component companies, where firm competitiveness was explored, which has never been done in prior studies. A meta-frontier DEA model was developed to evaluate the DMUs from all groups and individual groups from group frontiers to identify the effects of technological heterogeneity. Traditional DEA could not identify group frontier and technological heterogeneity as compared to meta-frontier DEA. This study also compares samples from different countries and years of observation.
Even though some prior studies investigated the relationship between ESGP and efficiency performance using DEA models, they focused on the LED manufacturing industry instead of the optical component industry. This study provides a meta-frontier analysis to examine the operational management efficiencies and inefficiencies of optical component companies. It also explores the impact of ESGP toward the competitiveness of firms in the optical component industry. As shown in the Appendix, robust tests were conducted using truncated regression and bootstrap truncated regression.
Future research could dive into the role digital technology (i.e. artificial intelligence, big data analytics, and IoT) in improving the competitiveness and efficiency of the optical components industry. Production processes, enable predictive maintenance, and foster innovation in product development could be improved. In addition, the use of digital tools for ESGP monitoring and reporting can help companies achieve the stakeholder expectations and regulatory requirements.
In this study, some limitations were identified. First, top-performing companies from the optical component industry were included, but some companies were removed because of limited data availability. Second, the main advantage of utilizing the meta-frontier DEA model, which is the consideration of undesirable outputs, was not included in this study. For instance, the undesirable variable such as CO2 Emissions and energy use could be added to include the sustainability aspect of the company. Third, the study only included a one-stage DEA model. More aspects of efficiency and the causal relationship of the efficiency performance could be demonstrated if a two-stage DEA model is used.
Managerial Implication
This study highlights the critical need for optical component decision to strategically allocate their resource especially on R&D investments. During the process of engaging in ESGP initiatives, managers should prioritize innovations following the industry trends to enhance their competitive advantage. Optical firms in China and South Korea can improve their competitiveness by learning from the ESG strategies of Taiwanese and Japanese firms. Companies should incorporate ESG practices into business decisions and daily operations is essential for reducing technology gaps and improving efficiency. By identifying inefficiencies which could assist in optimizing their resource use, companies can achieve greater operational efficiency and help in long-term growth. High-performing companies can serve as benchmarks for best practices, helping others refine their strategies.
Practical and Social Implication
This study provides practical insights for companies seeking to improve their competitiveness in the optical components industry. The use of meta-frontier DEA and OLS regression provides a robust framework for evaluating performance and identifying areas for improvement. Companies can use these methods to assess their relative efficiency, reallocate resources, and enhance investment strategies. By integrating ESGP into their operational strategy, companies can align financial goals with environmental and social performance to ensure sustainable growth in a highly competitive marketplace. The findings highlight the need for platforms that support cross-country knowledge sharing, training programs, and resource planning that connect ESG adoption with technological progress. Governments and regulators play a key role to promote ESG integration in helping firms to enhance competitiveness with long-term social and environmental goals.
Optical component companies that engage in ESG could contributes to broader societal goals such as sustainability and climate change mitigation. Stronger ESG performance in the optical component industry supports sustainable growth, builds trust among stakeholders, and improves regional competitiveness, even potentially benefits for other manufacturing sectors in Asia. By aligning business practices with stakeholder expectations, companies can foster trust and cooperation with communities, regulators and consumers. This approach not only enhances brand reputation, but also promotes a more sustainable industry ecosystem.
Footnotes
Appendix
Bootstrap Truncated Regression Results of ESG and ESG Components.

| Variables | MOE | GOE | OTGR | |||||||||
|---|---|---|---|---|---|---|---|---|---|---|---|---|
| Intercept | 0.722*** | 0.622*** | 0.718*** | 0.665*** | 1.071*** | 1.069*** | 1.029*** | 1.105*** | 0.626*** | 0.525*** | 0.665*** | 0.529*** |
| ESG | 0.003*** | 0.001* | 0.003*** | |||||||||
| E | 0.003*** | 0.001** | 0.002*** | |||||||||
| S | 0.003*** | 0.000 | 0.003*** | |||||||||
| G | 0.002*** | 0.001*** | 0.002** | |||||||||
| ROA | 0.262*** | 0.266*** | 0.261*** | 0.258*** | −0.010 | −0.009 | −0.011 | −0.010 | 0.294*** | 0.296*** | 0.294*** | 0.290*** |
| LEV | 0.024 | −0.043 | 0.005 | 0.045 | −0.228*** | −0.240*** | −0.236*** | −0.212*** | 0.260*** | 0.204** | 0.250*** | 0.266*** |
| AGE | 0.000 | 0.000 | −0.000 | 0.001 | 0.001** | 0.001** | 0.001*** | 0.001** | −0.000 | −0.000 | −0.001 | 0.000 |
| SIZE | 0.000 | 0.007 | 0.001 | 0.002 | −0.007 | −0.007 | −0.004 | −0.009* | 0.007 | 0.014* | 0.006 | 0.012 |
Note. 2,000 bootstrap replications are used. ESG = ESG score; E = environmental score; S = social score; G = governance score; ROA = net income/total assets; LEV = total liability/total asset; AGE = logged firm age; SIZE = logged total asset.
Statistical significance at 1% level.
Statistical significance at 5% level.
Statistical significance at 10% level.
Author Contributions
Tzu Kuan Lin: Formal Analysis, Writing – Original Draft, Review & Editing, Data Curation, Resources. Fang Chen Kao: Supervision, Software, Methodology
Funding
The authors received no financial support for the research, authorship, and/or publication of this article.
Declaration of Conflicting Interests
The authors declared no potential conflicts of interest with respect to the research, authorship, and/or publication of this article.
Data Availability Statement
The datasets generated during and/or analyzed during the current study are available from the corresponding author on reasonable request.