
Abstract
As in other sectors, increasingly higher performance and efficiency are also being required from health care employees. To achieve this goal, every health care organization should have a suitable human resource management system. The selection, education, training, effective performance appraisal, and evaluation of leaders are particularly of key importance for every organization. Data envelopment analysis (DEA) is used in this study to develop a model of practice outputs and inputs to help identify the most efficient nurse leaders. The employees’ performance appraisals are often closely related to their specific organizations. As leaders’ behaviors are also influenced by external, non-discretionary factors, the three-stage DEA was used to include inputs not controlled by individual leaders. This article proposes a performance appraisal based on competency models of leadership for a larger professional group working across several different organizations, yet in similar professional and institutional environments. The empirical data in this article are based on two surveys that were conducted in 15 Slovenian public hospitals.
Introduction
An efficient and effective health care system significantly contributes to a higher quality of life and a higher level of human development. The effects of a good health care system can be observed in the productivity of the workforce, which in turn contributes to higher economic growth. Therefore, the assurance of a successful health care system should be a priority in any country. Health care expenditures in developed countries comprise 8% to 16% of GDP, whereas employees in the health and social work sector account for 6% to 20% of all employees (Organization for Economic Co-Operation and Development, 2014). The health care systems in the majority of European countries are designed so that the largest portion, in terms of both health service providers and funding, remains within the public sector (Organization for Economic Co-Operation and Development, 2014). The state should use its powers to ensure public sector organizations (including health care organizations) operate in an efficient and effective manner. One of the characteristics of the majority of public sector organizations is that their performance greatly depends on the successful management of human resources.
Employee performance appraisals (PA) can support a wide range of human resource decision-making activities including pay raise, promotion, demotion, termination, and training of employees (Osman, Berbary, Sidani, Al-Ayoubi, & Emrouznejad, 2011). Well-designed and properly used appraisal systems are essential for effective functioning of organizations (Manoharan, Muralidharan, & Deshmukh, 2009).
Research on PA has evolved from a pure focus on how to measure performance to examining the social context where performance appraisal takes place (Prasad, Suar, & Taraban, 2014; Zheng, Zhang, & Li, 2012). Evaluating and ranking the employees working in organizations are challenging tasks involving several factors. Each employee achieves certain performance levels in various factors, and the resulting information can be overwhelming (Manoharan et al., 2009).
The development of PA system is especially important for leaders. Leaders can affect organization performance in different ways. Devising more effective ways of managing the performance of managers and leaders has become a cornerstone of organizational and leadership development in recent years (Cheng, Dainty, & Moore, 2005). Effective management and leadership are critical aspects of well-performing organizations and programs.
One of the most frequently used new approaches in human resources management is the study of competencies and competency models (Cappellen & Janssens, 2008; Wu, 2013). A competence is an action that can be monitored, evaluated, and whose efficiency can be measured. On that basis, we can define a leadership competence model as a system of key competences, designed based on research of key indicators of effective behavior of leaders (Kvas, Seljak, & Stare, 2013). Competencies can only be defined on the basis of observation of the behavior of the individual (actions in real situations; Stare & Seljak, 2013). They have become an important tool for introducing changes in organizations and in changing the behavior of the individual (Plessius & Ravesteyn, 2010).
In the competency approach, we compare employees’ performance against performance standards or desired behaviors (Cheng et al., 2005). Competency based PAs have been seen as a powerful tool to underpin many human resource management activities also in healthcare organizations (Osman et al., 2011; Rosenfeld, Pyc, Rosati, & Marren, 2012). Such assessments can help to define job characteristics and desired levels of performance and hence, can provide a basis for many aspects of the human resource management in health care (Cheng et al., 2005).
Nurse leaders need to be familiar with the operation of the health care system, possess knowledge and skills from the areas of leadership, communication, and employee motivation, and possess the ability to work in a team, ability to solve complex problems, and ability to work with health and other institutions. They usually perform a dual role—a professional and a leadership role, which require additional knowledge and skills (Hogan & Nickitas, 2009; Yoder-Wise, 2011b).
A relatively long chain of leadership hierarchy has been forged in professional groups such as nursing: ranging from the nursing director, leaders of wards, clinics, and sectors at the top level to the charge nurse and team leader on the first-line management level. Not only are people in top positions (top managers and leaders) important in the organization here, but also the entire hierarchical management structure within it (Kvas & Seljak, 2013b; Twedell & Jackson Gray, 2007).
The competency model of leadership in nursing emerged in Slovenia between 2009 and 2011 (Kvas & Seljak, 2011; Kvas et al., 2013). It consists of generic leadership competencies (behaviors or actions) that show the characteristics of all leaders and role-specific competencies that are considered to be characteristic of leaders in nursing. Generic competencies comprise flexibility at work, creativity, leadership, organizational climate, organization, networking/influence, and realization skills.
Based on analysis of the theory of nursing, leadership, and competency models (Biesma et al., 2008; International Council of Nurses, 2012; Yoder-Wise, 2011b), three groups of role-specific competencies were selected:
Ethics: competencies demonstrating the ethical or non-ethical conduct of nurses in leadership positions
Interprofessional relationships: competencies demonstrating correct understanding of the position of nurses in the health care system and their relationships to doctors
A positive attitude toward knowledge and education: competencies demonstrating the attitude of nurses in leadership positions toward their own and their subordinates’ education
A PA can only be successful if it includes as many different aspects and results of employees’ work as possible. Leadership outputs in particular should cover a wide range of performance measures (Osman et al., 2011). The complex nature of the relationship between multiple inputs and multiple outputs involved must be taken into account when developing and applying competency models. The main research problem of our study was how to incorporate a large number of different aspects and results of nurse leaders’ work into a unified system that enables consistent classification. Data envelopment analysis (DEA) is a method that has often been used for performance appraisals based on a large number of inputs and outputs.
The main aim of this study is to assess leader performance in nursing care using a competency-based PA. DEA will be used to
identify the leaders with the highest and lowest performance appraisals,
identify peers for leaders with the lowest performance appraisals,
identify what areas leaders with the lowest appraisals should improve performance and quantify the performance improvement required in these areas, and
compare leadership performance among the 15 hospitals that participated in the study.
Method
Basic DEA
DEA was proposed by Charnes, Cooper, and Rhodes (1978), as a non-parametric method of efficiency analysis to compare the relative performance of units relative to their best peers (efficient frontier) rather than average performers, and to identify benchmarks for inefficient units. The virtual productivity ratio

subject to


where
Originally, DEA was designed to empirically measure productive efficiency of homogeneous DMUs. When expanding the use of DEA to other areas (public administration, measuring employee efficiency in various organizations, etc.), one should ensure that the precondition of homogeneity of the DMU is met. The efficiency of a DMU is usually influenced by a variety of factors that are difficult to define with a small number of inputs.
DEA is most commonly used for assessing the efficiency of organizations and individuals. The most commonly assessed organizations include banks (Jablonsky, 2012), police departments (Aristovnik, Seljak, & Mencinger, 2013), physician practices (Rosenman & Friesner, 2004), hospitals (Pham, 2011), and nursing homes (Garavaglia, Lettieri, Agasisti, & Lopez, 2011).
DEA-based employee PA or efficiency assessments are used for employees in industry (Tao, 2012), physicians (Chilingerian & Sherman, 2011), and nurses (Osman et al., 2011). Most of these studies assessed efficiency within a single organization or in similar cultural or working environments. To compare employees in different organizations and at different levels of leadership, the analysis must include additional variables to offset the influence of elements outside the control of an individual (or the organization that employs them).
DEA With Non-Discretionary or External Inputs
The basic DEA models assumed that all inputs were discretionary. However, in practice, the results of production processes also depend on the effect of another type of variables that are beyond the DMU control (Cordero, Pedraja, & Santín, 2009). These non-discretionary or external inputs affect the transformation of discretionary inputs into outputs (Ruggiero, 1998). Therefore, the only way the DMU can correctly be evaluated is by taking into account the influence of those external variables on efficiency scores, so that they can be interpreted as an appropriate measure of their performance.
This approach in the first stage estimates efficiency scores with basic DEA program using only the discretionary inputs. This produces a measure of the total inefficiency for the different DMUs comprising contributions both from the non-discretionary variables and non-measurable DMU inefficiency. Subsequently, a regression analysis is used in the second stage to decompose both of them. Therefore, exogenous variables (zj) are explanatory variables, and the dependent variable is the first-stage efficiency score (

This regression can be estimated by ordinary least squares, although the use of a Tobit regression is more widespread (Deyneli, 2011). Tobit regression is often used for data that are censored or truncated. Censored data occur when the values of the data are clustered around some threshold, either lower (left-censored) or upper (right-censored; Walker & Maddan, 2008). From the value of estimated coefficients, it is possible to identify the influential variables and their sign (positive or negative) and also to weigh the importance of each external variable in the efficiency estimate (Cordero et al., 2009).
In the third stage, DEA will be conducted using the discretionary and non-discretionary input variables. The newly obtained values are introduced to the original DEA framework as an input, adjusting for the uncontrollable environmental factors through the use of a combined non-discretionary input. This model restricts the comparison set by removing from the potential reference set any DMU that has a more favorable environment than the unit under analysis.
There has been a growing interest in the literature to study how the effect of exogenous variables can be included in efficiency measures in such different sectors as education, banking, or sports (Cordero et al., 2009). We can find articles that have addressed this issue also in the health sector. DEAs with non-discretionary inputs are used to compare nursing homes (Fizel & Nunnikhoven, 1992), hospitals (Chilingerian & Sherman, 2011), or dialysis facilities (Kontodimopoulos, Papathanasiou, Flokou, Tountas, & Niakas, 2011).
Research Design and Participants
The study was part of a larger research project titled “Leaders in Health Care.” Following a literature review and input from an expert group, two questionnaires were designed specifically for the purposes of the research. In the first questionnaire, subordinates assessed the levels of 95 actions of their leaders. In the second questionnaire, leaders assessed what traits and characteristics they possess. Two surveys were conducted within a research project carried out from May 18, 2010, to April 30, 2011.
The survey was conducted in 13 greatest Slovenian general and special hospitals and 2 university medical centers that account for 87% of all hospital health care employees in Slovenia.
The sample from the first survey included 1,311 health care professionals who assessed the level of competencies of their immediate superiors. Of the 1,311 health care professionals, 84.3% were female. The average age of subordinates was 38.5 years; 59.2% had a secondary education, 34.4% postsecondary or professional college, 2.7% bachelor’s degree or higher.
The sample from the second survey included 236 nurse leaders, who were asked to provide information regarding their education and job experience, and assess their knowledge, job satisfaction, organizational commitment, and levels of interpersonal and interprofessional relationships. The data from second survey were used as discretionary inputs. Of the 236 nurse leaders, 7.2% were men. The average age of subordinates was 42.3 years. Those who had a postsecondary education or professional college comprised 88.6%, and those with a bachelor’s degree or higher comprised 11.4%.
The interconnection of the data from first and second surveys was ensured with a coding system. The data for non-discretionary inputs were obtained from hospital records.
Data
DEA can incorporate various types of data. Our study combined interval and ordinal data. Although interval data have been used for DEA since it was developed, the use of ordinal data has become more frequent only recently. Many authors utilized a 5-point Likert-type scale to convert qualitative data into quantitative data for use in evaluations of performance using DEA (Manoharan et al., 2009).
Our study used data from various sources and aspects; therefore, we also needed to prevent a possible data imbalance. One of the best ways of making sure there is not much imbalance in the data sets is to have them at the same or similar magnitude. A way of making sure the data are of the same or similar magnitude across and within data sets is to mean normalize the data. The process to mean normalize is taken in two simple steps. First step is to find the mean of the data set for each input and output. The second step is to divide each input or output by the mean for that specific factor (Sarkis, 2007). Mean normalization was used to normalize data for outputs and discretionary inputs.
Outputs
The focus of our model is to enhance the output, rather than decrease the inputs. The outputs for evaluation that can be controlled by the entities are important, because it is generally not very informative or motivating to be judged on the basis of factors that you cannot control (Bogetoft & Otto, 2011). On the output side, it is important that the specification encompasses the full range of leaders’ behaviors. The competency models are based on the assessment of behavior in actual situations. Contrary to the prevailing method of self-evaluation in measuring leadership behavior, we propose subordinates evaluation. The most reliable assessments of leaders are provided by people who are most familiar with their work—their immediate subordinates. Subordinates assessed 95 actions of their leaders, which were divided into four groups of competencies. This resulted in four outputs: (a) generic competencies of leaders in public sector, (b) ethical competencies, (c) interprofessional relationship, and (d) positive attitude toward knowledge and education (Kvas et al., 2013). Each of the groups of competencies was used as a single output variable, representing an aggregate performance indicator of the level of leadership in a specific area (Table 1).
Descriptive Statistics of Inputs and Outputs.

Values above 100 signify that the assessed leader exceeds the norm in an individual area, whereas values below 100 signify failure to meet the norm.
Ratings based on 5-point Likert-type scale.
1: team leaders; 2: senior nurses, small department heads; 3: leaders of wards, clinical departments, operational blocks, hospital units, outpatients’ clinic groups; 4: head nurses of clinics/hospital centers; 5: head nurses of hospitals, assistant directors of nursing.
1: small specialist hospitals; 2: middle-sized general hospitals; 3: large university medical centers.
Assessments of each leader and their behavior provided us with information regarding the degree to which they meet the norm defined in the competency profile. The assessed level of competencies of each nurse leader was compared with leadership competency profiles developed within the research of the leadership competency model in nursing care (Kvas & Seljak, 2011).
The relationship between the output variables was estimated using the Pearson’s coefficient. Pearson’s coefficients among the output variables scored between 0.789 and 0.876, p < .01 (Table 2), which means they were lower than the maximum threshold, which in DEA studies was 0.95 (García-Sánchez, 2009). Therefore, all four were included in the analysis.
Correlation Coefficients Between Variables.

Discretionary inputs
All discretionary inputs are (or could be) influenced by individual leaders. Input data were obtained from a survey submitted to leaders. We defined six indicators, which indicate what traits and characteristics leaders possess and which they presumably utilized for efficient leadership: (a) level of formal education, (b) skills and experience (total years of employment), (c) self-assessment of knowledge, (d) job satisfaction, (e) communication and interpersonal relationships, and (f) organizational culture and commitment to the profession (Hogan & Nickitas, 2009; Kvas & Seljak, 2013a; Westover, Westover, & Westover, 2009).
Pearson’s coefficients among the output variables scored between 0.09 and 0.35. Therefore, all six indicators were included in the analysis.
Non-discretionary inputs
The second phase of the DEA includes non-discretionary inputs that influence leadership performance, but are not directly related to the leader. Therefore, influences not directly linked to an individual but rather to the characteristics of the hospital and their job position needed to be excluded from the first phase of DEA. Non-discretionary inputs represent characteristics of the leader’s job position or the leader’s organization: (a) the type (level) of leadership position, (b) number of subordinates, (c) type of hospital, and (d) number of health care employees.
The correlation between the non-discretionary inputs was low. The only statistically significant correlation arose between the number of health care employees and the type of hospital (r = .737, p < .01). The analysis therefore includes all four variables.
Statistical Analysis
The data were analyzed using Frontier analyst 4.1.0 and SPSS 19.0. Output-oriented DEA model with constant returns to scale is used in this study. Relationships between variables were analyzed using a one-way ANOVA. A significance level of alpha = .05 was used for all statistical tests.
Results
Leaders with an efficiency score of 100 are efficient, and less than that value are categorized as inefficient (Table 3). This efficiency is a relative term, and it is related with a subgroup of individuals with whom the examined DMU is best compared.
Efficiency Scores for Nurse Leaders.

Values above 100 signify that the assessed leader exceeds the norm in an individual area, whereas values below 100 signify failure to meet the norm.
A total of 203 (86%) leaders could improve their leadership performance based on their potential. The average age of inefficient leaders is 42.9 years. Seventeen of 203 (8.4%) are men. Thirty-three leaders achieved an efficiency score of 100 and represent a role model for peers displaying lower assessments.
Table 4 shows the basic demographic data and leadership performance appraisals of the two lowest scoring leaders. The performance appraisal values achieved by leaders and possibilities for improvement are shown for each of the four groups of competencies (outputs). The assessment shows the degree to which they would need to improve, based on existing inputs to achieve the performance level of their role model. Similar representations can be compiled for each of the 203 leaders performing below requirements.
Data for Least Efficient Leaders and Their Peers.

Leader 1 achieved a relatively high score in ethics, but scored significantly lower in other areas. This leader has a peer within the same hospital with whom to compare himself or herself against and learn from and exchange experience with.
One of the major advantages of DEA is its ability to show the improvements necessary to achieve efficiency. In the comparison with the peer, Leader 1’s greatest potential for improvement lies in the area of generic competencies. This illustration shows that an increase in outputs does not depend merely on the absolute values of outputs of an individual leader but also on peers in their organization. The logic behind this example is that the improvement process begins with an exchange between higher and lower scoring leaders within an organization.
The second poorest score was achieved by a leader whose assessment showed the lowest results in ethics and attitude toward education. Leader 2 also has a peer within his or her hospital who could help improve Leader 2’s outputs.
We then prepared an overview of leadership performance in all 15 hospitals within the scope of the final research question of the analysis (Table 5). It is in the interest of hospitals to use their leaders as efficiently as possible, for the performance of health care organizations, particularly in the public sector, greatly depends on the efficiency of their leaders.
Efficiency Scores and Potential Improvements for Hospitals.
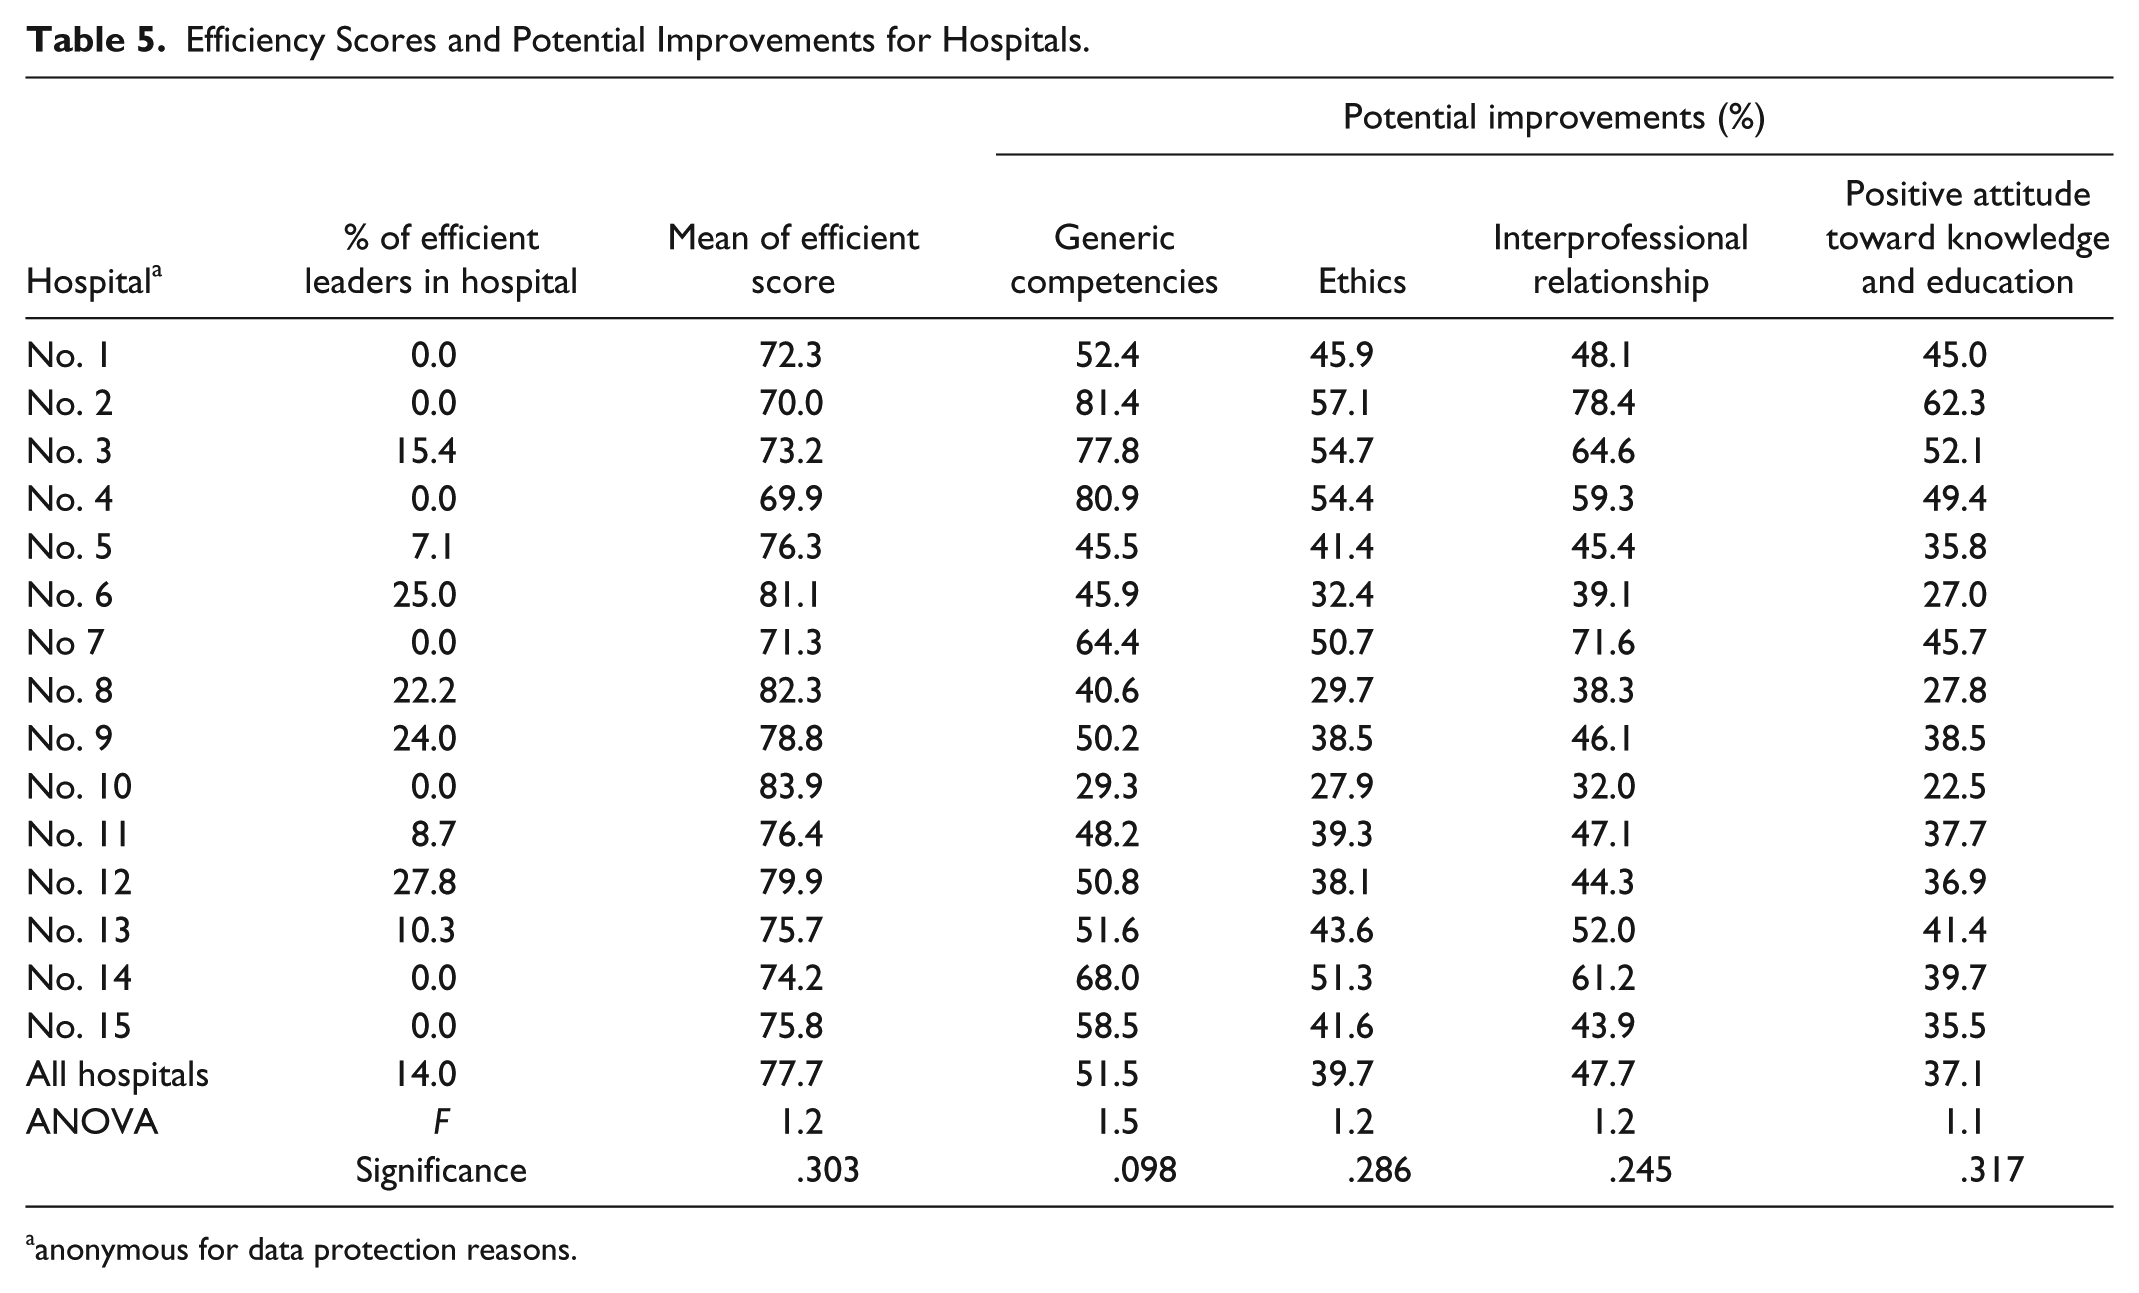
anonymous for data protection reasons.
This overview shows that eight hospitals employ efficient leaders who could serve as role models for their peers. Hospitals 6, 8, 9, and 12 employed more than 20 % of efficient leaders. The average efficiency score exceeded 80 in only 3 hospitals. In comparison, the two ranking orders of hospital scores show certain differences. Although the hospital with the highest score, Hospital 10, has no efficient leaders, Hospital 12, with 27.8% of all highest scoring leaders, only has an average performance score of 79.9, ranking fourth among all hospitals.
The ANOVA analysis reveals that arithmetic means of efficiency score of hospitals do not show any statistically significant differences. Therefore, we also used the post–ad hoc analysis. The lowest-ranking hospital, Hospital 4, shows statistically significant differences from Hospitals 8 (p = .021), 10 (p = .041), and 12 (p = .020). The highest ranking hospital shows statistically significant differences from Hospitals 2 (p = .049), 4 (p = .030), and 7 (p = .045). Based on these results, Hospital 4 could cooperate with Hospital 8, 10, or 12, and attempt to improve performance by exchanging good practices with them. Similarly, the top-ranking three hospitals could work together and organize leadership seminars or workshops.
Table 5 shows the necessary percentages of improvement for the four groups of competencies. The improvements are necessary in the areas of competencies related to interprofessional relationships (Hospitals 7, 10, and 13) and generic competencies (all remaining hospitals).
Discussion
The poorest score was achieved in the competence area of generic competencies. The lack of generic leadership competencies and the importance of their development in nurse leaders have also been shown in other studies. To achieve better leadership, in the future, nurse leaders will require a higher level of competencies in the areas of strategic thinking, use of financial/quantitative data, quality commitment (Bradley, Maddox, & Spears, 2008), leadership, strategic view (Furukawa & Cunha, 2011), and job planning and assignment and goal setting (Lin, Wu, & White, 2005).
Nurse leaders view nursing care as empathetic and caring work (Boeck, 2014) rather than as a rational decision-making process required from leaders and managers. They are not prepared to fully accept the role of leaders. The problem of role transition has also appeared in other research (Twedell & Jackson Gray, 2007). Nurse leaders even at the lowest leadership level should be aware of the importance of their role as leaders and become active in developing and changing health care practices and leadership (Currie, Tolson, & Booth, 2007). A survey of nurse leaders in Slovenia showed that nurse leaders were aware that they did not have enough management and leadership knowledge—generic leadership competencies (Lorber & Skela Savič, 2011). This indicates that the work of nurse leaders requires new knowledge that expands beyond the borders of specific professional fields. Most continuing education programs for nurses are organized for narrow professional fields of nurses’ work (cardiology, psychology, etc.). In addition to field-specific professional knowledge, other programs also need to be organized that would focus not only on a single topic or field but also on comprehensive education (Yoder-Wise, 2011a). One such area is leadership as it incorporates different scientific fields (human resources management, sociology, psychology, economics, etc.)
The second poorest score was achieved in the competence area of interprofessional cooperation. Leadership in nursing depends on relationships within the professional group of nurses as well as relationships with other professions in the health care sector. These relationships depend on the role of the medical profession in society and the state’s approach to health and health care. In the past, the role of leader in the health care team was assumed by the physician (Hall, 2005). However, nowadays, the successful implementation of team work can only be carried out through equal participation of all professions working in the field of health care in the form of interprofessional and trans-professional teams (Thylefors, Persson, & Hellstrom, 2005).
Nurse leaders would above all focus on interpersonal relationships between nurses and other members of the health care team (West & Lyubovnikova, 2013). Communications of nurse leaders with other leaders are frequent both inside and outside the organization. Best practices in health care teams should therefore comprise good interpersonal and interprofessional relationships (Furukawa & Cunha, 2011; Spicer et al., 2011) that incorporate respect for the work of other team members. A study of other professional groups also showed appropriate communication between team members (and with other stakeholders) to be an important component of team success, being even more important than experience, work history, and education (Stevenson & Starkweather, 2010).
The analysis based on our research provides important information for three groups of stakeholders:
Nurse leaders can use the analysis results as a guideline for which areas they need to improve their competencies. During their studies, nurses adopt professional values and accept learning and training as an integral part of their profession. Based on the PAs, individual leaders can find peers within the organization to serve as role models. The assessment also shows the degree to which they would need to improve to achieve the performance level of their role model.
Less efficient leaders and their role models (or “nurse trainers”) could form study groups in which they could exchange ideas and learn. The highest management structures of hospitals have the task of ensuring the appropriate conditions for nurses to become and remain good leaders. Hospital managers need to ensure that potential of nurse leaders is realized in the form of better leadership and a higher quality of health care.
National Health Service managers: All 15 participating hospitals are included in the public health care system and are, thereby, a part of the public sector. The state as the owner of all public organizations should understand these results as an indication that certain differences in leadership performance exist. Differences exist both among leaders and among hospitals. The state should promote better leadership in nursing care through its representatives in hospital management. The state should also, within its competencies, organize training for nurse leaders in areas showing poorer scores and promote exchanges of good practices among hospitals.
In future, it would be worthwhile conducting the surveys in all Slovenian health care organizations. The study included only nurse leaders in Slovenian public hospitals. Conditions are probably different in smaller health care organizations (health centers or nursing homes) and in private hospitals. A larger sample of leaders would also allow for the inclusion of additional inputs in the DEA.
Further research would also be required in assessing the level of competencies. Assessment of the competencies of leaders by subordinates was used in this study. The ratings would have been different if assessments of superiors or leader self-assessments had been used. Some studies suggest that these estimates could differ significantly (Kvas & Seljak, 2013b). In the future, surveys should be carried out among all three groups and the evaluations compared.
Conclusion
Tasks performed by nurse leaders are similar, as are their cultural and working environments. Nurses are a professional group, and a characteristic of professional groups is that one does not become a member solely on the basis of education and training but also by sharing the values of the professional group. The employees’ PAs are often closely related to their specific organizations. This article proposes a PA based on competency models of leadership for a larger professional group working across several different organizations, yet in similar professional and institutional environments.
Leaders’ PAs are also influenced by the characteristics of the job position and organization. By including non-discretionary inputs, the analysis also takes into account these additional factors. To assess the PA, this research used the three-stage DEA, which incorporated both discretionary inputs—inputs related to leaders’ characteristics, which they can influence—and non-discretionary inputs on which leaders have no influence, at least not in the short term. This enabled us to ensure better comparability among leaders employed in different organizations and improved the homogeneity of the DMU. The calculated values of leadership performance allow comparisons among leaders employed in different organizations.
Footnotes
Declaration of Conflicting Interests
The author(s) declared no potential conflicts of interest with respect to the research, authorship, and/or publication of this article.
Funding
The author(s) received no financial support for the research and/or authorship of this article.