
Abstract
This study evaluates the performance of the financial industry with meta-frontier (MF) dynamic network data envelopment analysis (DN-DEA) from 2009 to 2015. We divide the sample into two groups, Financial Holding group (FHG) and Insurance & Securities group (ISG), for all decision making units (DMUs) of the financial industry. Our goal is to study the effects of operating performance across divisions and across periods and to compare the differences between these two different groups within Taiwan’s bank industry. We find the best business performance was during 2013, where the average value was 0.5485. The best average value of FHG was 0.7192 in 2012, and ISG was 0.7099 in 2010. FHG has best average overall efficiency (OE) value in 2009–2015 periods. However, the average technical efficiency gap ratio (TGR) value of ISG’s (0.7490) is larger than FHG (0.6959), indicating that business performance is affected by group and meta-frontier. FHG has a larger scale than ISG, and so, those firms can input a relatively large proportion of investments and resources to produce better performance. Finally, many DMUs have excess inputs of labor costs and operating expenses, resulting in an average TGR value that is lower than ISG in 2009–2015.
Keywords
Introduction
The financial industry is a strong symbol of economic development for countries or regions, as their business performance impacts the flow and activation of funds. This industry dominates the funding needs of many listed companies or for general business transactions and provides a number of commodities and derivatives for the public. As a result, any excessive relaxation or tightness will lead to financial problems. How to use an effective business performance evaluation and to utilize the results of these evaluations to understand the differentiation problem of business strategies and then to check and control risk are important issues for this sector.
The Taiwan government promoted the second financial reform in 2004, resulting in a consolidation trend for the finance industry yet at the same time financial confusion. Following the 2008 global crisis, the financial markets experienced the European debt crisis in 2012, which then slowly recovered in 2013, after Europe (EU) and the United States (US) continued to implement quantitative easing (QE) policies. In 2014, the Financial Supervisory Commission (FSC) of Taiwan proposed to build a digital financial environment (3.0 version). With the progress of information technology, the change of economic situations, and the evolution of market participants’ needs, the trading environment and the financial industry have been constantly updated, leading to the growth and decline of companies. Future financial problems may not be due to a lack of effort or from major mistakes being made, but rather from a failure at dealing with rapid changes in the external environment by not adjusting a development strategy in the process of business.
Concerning methods of evaluating business performance in the financial industry, these use separately comparative analysis, financial ratios, and Camels model, such as Islam et al. (2014), Adam (2014), Rostami (2015), and Shar et al. (2010). Mengistu (2015) proposed data analysis to evaluate the financial performance of the banking sector in Ethiopia. Many studies employ the traditional (data envelopment analysis [DEA]) approach, such as Yen et al. (2012), Fukuyama and Weber (1999), Fang and Hu (2010), Zhang et al. (2006), and Adjei et al. (2014) use a two-stage model DEA, such as Lo and Lu (2006) and Yen and Yang (2013), or use a three- or four-stage model DEA such as Hu et al. (2012).
These financial performance of previous research main results are focused on (a) finding single-period efficiency for BCC or CCR, and so on; (b) finding multiple periods efficiency for 2SDEA or 3SDEA, and so on; and (c) using other data analysis method such as comparative analysis. The above article lacks analysis of financial performance combining the dynamics of period change and the network of division linkages. However, they commonly assume the use of identical technology sets and practice with the same frontier technology. However, those research studies neglect to consider that the financial industry has different operating types that result in different technology sets. Thus, this study refers Tone and Tsutsui (2009), Tone and Tsutsui (2014), and Wongchai et al. (2012) to develop meta-frontier (MF) DN-DEA (MF-DN-DEA), to assess financial performance in Taiwan for the period 2009–2015. The meta-frontier (MF) DN-DEA (MF-DN-DEA) method explores the effect of performance within a cross-period and cross-stage (division), as well as the technology gap.
Taiwan’s financial industry contained financial holding, insurance, securities, and bank—four groups. The bank’s business characteristics are quite different from those of the other three groups, and it can direct deposits and loans and other financial services, and its proactive service features are more difficult to measure performance against the same benchmark. The business strategy of these other three groups will be related to the future development of Taiwan’s overall financial industry. Therefore, this study selected financial holding, insurance, and securities as research targets, and this study divides the meta-frontier group into two groups, Financial Holding group (FHG) and Insurance & Securities group (ISG), to assess the business performance of meta-frontier efficiency (MFE) and group-frontier efficiency (GFE) for 2009–2015 in Taiwan. The results will help us find the reasons for efficiency and inefficiency in MFE, FHG, and ISG. We can also get the catch-up effect efficiency, frontier-shift effect efficiency, and MPI of total factor production (TFP), which will help to understand the changing situation of technical efficiency change (TEC) (or catch-up effect) and technique change efficiency (TCE) (or frontier-shift effect) of MFE, FHG, and ISG in 2009–2015. The results of MF can get the technology gap ratio (TGR), which will help us find the difference in business performance for the two groups of FHG and ISG.
Literature Review
The influencing factors of economic development are global issues, especially in financial markets that had been seriously affected in the financial crisis of 2007–2008. How to maintain stable financial markets is the focus of all countries or regions. Many studies use a performance evaluation approach to understand the business performance of financial institutions, to analyze the factors that produce good or bad performance, and to offer advice to governments as a reference for developing management strategies to control financial risk. In the following, we summarize the empirical literature.
These research used Camels model or financial data to explore financial performance, such as Mengistu (2015) used financial ratios (such as profitability ratios and liquidity ratios) and descriptive statistical techniques to analyze the financial performance of the banking sector in Ethiopia with a special focus on Zemen Bank S.C. for the period 2009–2014, noting that the bank performed well in profit earnings and efficiently managing its assets for generating revenue. Adam (2014) used a similar method to assess the financial performance of Erbil Bank for investment and finance in the Kurdistan region of Iraq during the period 2009–2013. Rostami (2015) and Shar et al. (2010) employed the Camels model to, respectively, assess the financial performance of an Iranian bank and Pakistani bank. There are many research methods using financial information such as labor costs, assets, expenses or incomes of a business, shareholders’ equity (SE), net profit (NP), earnings per share (EPS), return on assets (ROA), and return on equity (ROE) to conduct a comparative analysis. For example, Almazari (2011) measured the financial performance of Jordanian commercial banks for the period 2005–2009; used a simple regression to estimate the impacts of independent variables represented by bank size, asset management, and operational efficiency on dependent variables of financial performance as represented by ROA and interest income; and found that there exists a positive correlation between financial performance and asset size, asset utilization, and operational efficiency. Islam et al. (2014) evaluated the performance of a commercial bank in the Kurdistan Region of Iraq by using NPM, ROA, ROD, and ROE as profitability indicators affected by a group of financial factors (capital ratio, bank size, and loans) as liquidity indicators, finding a positive influence behavior of the financial position for Erbil Bank and some of its financial factors’ variables. Alexei’s et al. (2019) evaluated the performance and productivity of Islamic and conventional banks using financial ratios and meta-frontier Malmquist productivity index (MPI) within periods 2006–2012 and found that Islamic banks exhibit worse cost and profit performance but are on a par with regard to revenue performance compared to the conventional ones.
A lot of research has focused on the DEA approach to evaluate financial performance in single period, such as Yen et al. (2012) who proposed a super SBM efficiency model and co-plot analysis to evaluate the performance of 14 financial holding companies in Taiwan, finding that Waterland was the leader in the management efficiency matrix. However, Cathay and Fubon were the leaders according to the co-plot analysis. The literature of cross multiple periods used two-stage or three-stage DEA to assess financial performance, such as Fang and Hu (2010) adopted zero-sum gains DEA to measure the efficiency scores of securities firms (SFs) and indicated that the traditional DEA model underestimates the efficiency scores of inefficient SFs. They focused on 266 integrated securities firms in Taiwan from 2001 to 2005, whereby the input items contained fixed assets, financial capital, and general expenses, and the output item was market share. They found foreign-affiliated ownership of SFs positively affects the efficiency scores. Zhang et al. (2006) looked at the technological progress, efficiency, and productivity of the U.S. securities industry between 1980 and 2000 with the DEA approach. Their results showed that this industry in general is less efficient than the existing technology allows, and the relative productivity of the U.S. securities industry in general declined. Adjei et al. (2014) analyzed the efficiency of the banking industry in Ghana over the period 2001–2010 using the DEA method, showing that Ghana banks are inefficient, well-capitalized banks are less cost efficient, bank size has no influence on bank cost efficiency, and the GDP growth rate negatively influences bank cost. Lo and Lu (2006) who proposed a two-stage production process, including profitability and marketability performance, by using a non-parametric frontier method-DEA that can help explore the performance of financial holding companies (FHCs) in Taiwan. They found that big-sized FHCs are generally more efficient than small-sized ones, FHCs with its main body under its insurance arm have an average performance value better than banks and securities, small efficient FHCs can easily become benchmarks, and big efficient FHCs are deemed as competitive niche players. Fukuyama and Weber (1999) examined production technology and measured overall cost-efficiency for Japanese securities firms during the period 1988–1993, decomposing overall cost-efficiency into allocative efficiency, pure technical efficiency, scale efficiency, and congestion efficiency. Yen and Yang (2013) used the super SBM efficiency model to assess the performance of Taiwanese FHCs in 2010 and 2011, employing a two-stage DEA management efficiency matrix to analyze the high-efficiency group and the low-efficiency group. They found that Yuanta Securities Investment Trust was a leader in the high-efficiency group, while Shin Kong Securities Investment Trust trailed behind due to low efficiency. Hu et al. (2012) applied a four-stage DEA approach to measure the operational environment-adjusted efficiency of sixty mutual funds in Taiwan from 2006 to 2010 and found that balance funds perform better than the others and that female fund managers perform more outstandingly than male fund managers both in cost control and risk management. Azad et al. (2017) used two-stage DEA and the Malmquist meta-frontier approach to evaluate the performance of bank efficiency in Malaysia for the period 2009–2013.
The business performance of the financial industry is affected by the operating environment or condition. Some studies have focused on the effects of meta-frontier and group-frontier, such as Huang et al. (2010) who used the meta-frontier cost function to evaluate bank efficiency and technology gaps in 16 European countries and combined it with the stochastic frontier approach (SFA), the distribution free approach (DFA), and DEA for 1994–2003. They found that the average efficiency of financial sectors improves over time and that the technology gap between a country’s cost frontier and the potential meta-frontier shrinks over time. Naceur et al. (2011) used DEA and the meta-frontier approach to calculate efficiency scores in a cross-country setting. Focusing on Middle Eastern and North African (MENA) countries in the period 1994–2008, they showed that despite similarities in the process of financial reforms undertaken in the five MENA countries, the observed efficiency levels of banks vary substantially across markets. They noted that the results from double bootstrap regression confirm that bank ownership, bank nature, and gross domestic product have a significant influence on bank efficiency, and Islamic banks have outperformed. The frontier results reveal that local Islamic banks have moved toward the group technology and foreign Islamic banks have taken the lead in country frontier technology. Ghroubi and Abaoub (2016) used stochastic frontier analysis (SFA) and meta-frontier analysis (MFA) to measure cost and revenue efficiencies of Islamic and conventional Malaysian banks over the period 2006–2012. They divided the sample into two groups, Islamic banks (IBs) and conventional banks (CBs), and showed that as for revenue efficiency, IBs are more efficient than CBs over the entire period, even though the evolution of the technological gap ratio confirms the inefficiency of their modus operandi. Abid and Goaied (2017) proposed the meta-frontier approach to assess bank efficiency in Middle East and North Africa countries for 1991–2011 and showed that Tunisian banks were the most efficient in terms of cost and profit. The analysis of the technological gap showed that Egyptian (Tunisian) banks used the most advanced technology in offering financial services to clients. Goyal et al. (2019) used meta-frontier directional distance function DEA to explore the efficiency and technology gaps in Indian banking sector in 2015–2016 and found that the group frontier of private sector banks is the second closest to the meta-frontier and public sector banks are found to be the laggards in the overall industry. Chao et al. (2018) used meta-frontier network data envelopment analysis to evaluate profitability efficiency, marketability efficiency and technology gaps of Taiwan’s banking industry, and found that the banks in financial holding companies (FHCs) can reduce more costs than the banks not in FHCs. Yu et al. (2019) used meta-frontier, undesirable outputs and dynamic network DEA to explore the sustainability performance of Chinese banks within 2010–2014. They found that the efficiency of these banks shows significant heterogeneity and the efficiency of most foreign banks has much room for improvement. These previous literatures are summarized in Table 1.
The Main Research on Financial Performances.

Note. SBM = slacks-based measure; DEA = data envelopment analysis; GDP = gross domestic product; MPI = Malmquist productivity index.
The above article lacks analysis of financial performance to combine the dynamics of period change and the network of division linkages. Therefore, this study refers Tone and Tsutsui (2009), Tone and Tsutsui (2014), and Wongchai et al. (2012) to develop meta-frontier (MF) DN-DEA (MF-DN-DEA), to assess financial performance in Taiwan for the period 2009–2015, and there are many variables that affect the operating performance of Taiwan’s financial industry, mainly including fixed assets, labor costs, operating costs, operating income, shareholders’ equity, and net profit and earnings per share. Therefore, we refer to Rostami (2015) and Shar et al. (2010) using fixed assets (FA), employees (EN), and business expense (BE) as inputs in Stage 1, operating income (OI) and shareholders’ equity (SE) are free link within Stage 1 and Stage 2, earnings per share (EPS) is output in Stage 2, and then net profit (NP) is carried over from periods t to t + 1, to explore the effect of financial industry performance covering cross-period and cross-stage (division). The main contribution of our study is that we use the DN-DEA and meta-frontier method to find the effect of cross-period, cross-division, group-frontier, and meta-frontier in business performance of Taiwan’ financial companies. The difference between our research method and previous research (such as Yu et al., 2019) are as follows: (a) they focus on banks, but we focus on the financial industry, including financial holdings, insurance and securities; (b) they use loans as undesirable output, we use net profit as desirable output; (c) their TGR is defined as enabling a greater understanding of the bank efficiency improvement potential and measuring the technology gap between the group frontier and non-convex meta-frontier technology, our TGR is used to find the difference between financial holdings (FHG) and insurance and securities (ISG).
Research Method
The traditional DEA approach has been used to assess a single-efficiency indicator, such as the CCR model of Charnes et al. (1978) and BCC model of Banker et al. (1984). These constant return to scale (CRS) and variable return to scale (VRS) conventional DEA models are used to evaluate overall operational efficiency and to explore the problems of excessive investment or lack of output in the operating process. Färe et al. (2007) divided the process into individual sub-processes of all DMUs and used the Network DEA model to analyze the performance of divisions. Tone and Tsutsui (2009) used weighted slack-based measures network DEA (N-DEA) to find the inefficiency source for the difference in performance between various divisions in the same stage. They proposed a two-stage performance evaluation model within financial holding companies, and thus, we refer to it as the relationship of network structure in this study. To explore the effects of cross-period performance, they proposed dynamic and network DEA and MPI in 2013. Furthermore, Tone and Tsutsui (2014) proposed the DN-DEA model to calculate the efficiency of division links for DMUs and the carry-over from periods t to t + 1. We employ the N-DEA and DN-DEA models to set the structure of assessing performance of Taiwan’s financial industry.
The model of this study contains two stages in every period. The input items are fixed assets (FA), employees (EN), and business expense (BE). The divisions from Stage 1 link to Stage 2 link are operating income (OI) and shareholders’ equity (SE), and the output item is earnings per share (EPS). The net profit (NP) is carried over from periods t to t + 1. We propose the DN-DEA model based on the framework of the system, as it is able to evaluate efficiency value and MPI for the processes. The model of this study is shown in Figure 1.

The structure of DN-DEA model of this study.
The DN-DEA model considers the change in cross multiple stages (divisions) and periods. It is connected by links of a network structure within each period and is used to carry-over activities between two periods. This research model can be more precise to discover the effects of input and output variables on the operating performance than dynamic or network methods in Taiwan’s financial industry. Tone and Tsutsui (2014) combined network SBM (NSBM; Tone & Tsutsui, 2009) and dynamic SBM (DSBM; Tone & Tsutsui, 2010) to propose a dynamic network slacks–based measure (DNSBM). This model can calculate the overall efficiency over the observed entire period, the dynamic change of period efficiency, and the dynamic change of divisional efficiency.
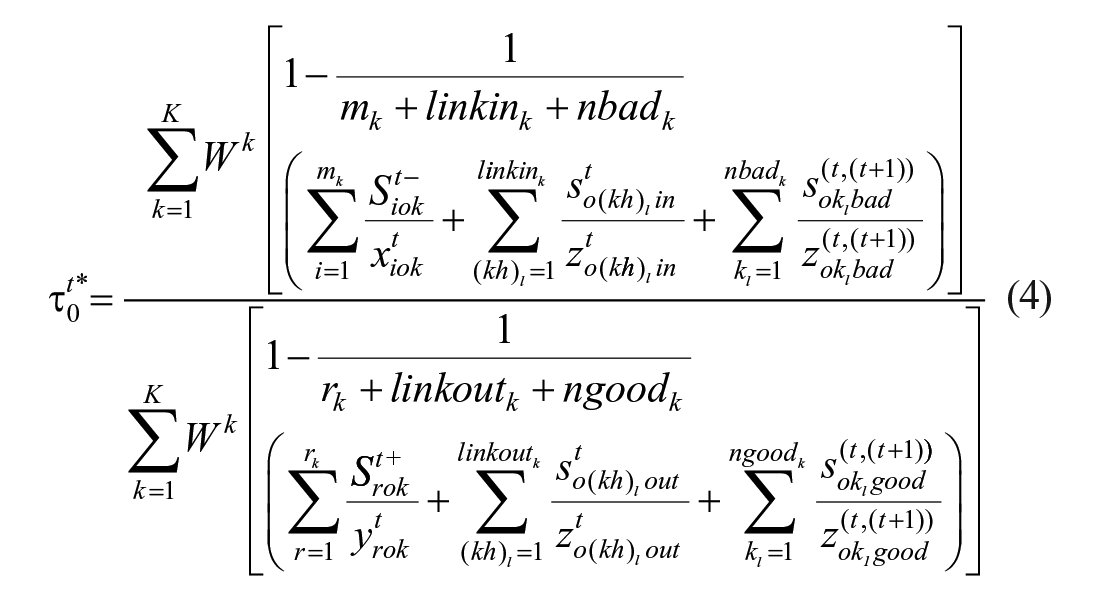
This study refers Tone and Tsutsui (2009) and Tone and Tsutsui (2014) and uses DEA-Slover-PRO version 14.0 to calculate the overall efficiency (OE)

where

where
This desirable carry-over is NP in this study, and it is needed to carry forward, and the net earned surplus is carried to the next period. The model equation of carry-over is shown as equation (3),

where the symbol α stands for good.
The equations of period efficiency


The other issue is about efficiency of technological progress. We use the Malmquist product index (MPI) to explore whether technical efficiency is improving for Taiwan’s financial industry in 2009–2015. MPI contains the product of catch-up, frontier, and MPI term and evaluates the efficiency change of a DMU or a division between two time periods. Färe et al. (1994) divided into technical efficiency change (TEC) (catch-up effect) and technological change (TCE) (frontier-shift effect) to calculate MPI of total factor production (TFP) changes with the distance function. TEC is related to the degree of efforts that the DMU attained for improving its efficiency, while TCE reflects the change in the efficient frontiers surrounding the DMU between the two time periods. These values of TEC, TCE, and MPI show the tendency of progress, status quo, and regress with >1, =1, and <1. They are shown a ratio of the efficiency of period-division between t and t + 1. These equations are similar to Tone and Tsutsui (2014). The division catch-up index (DCU) of situation of technology progress (TEC) and divisional frontier-shift effect (DFS) of technique change (TCE) are evaluated by the following program, as equations (7) to (11):


DCU >1, = 1, and <1 are, respectively, indicated as progress, status quo, and regress in TEC, and DFS is defined following non-radial Malmquist model equation (11) from t to t + 1.

We define the divisional Malmquist index (DMI) by their product with TEC and TCE, and they are evaluated by the following equation (12):

The overall Malmquist index (OMI) can be obtained as the weighted geometric mean of the divisional Malmquist indices, and they are evaluated by the following equation:

where
Business performance may be affected by the difference of scale and operating environment. For this reason, many studies divide DMUs into different groups of all DMUs, such as Ruttan et al. (1978), who defined the meta-frontier as a development curve of all groups in order to let different groups measure efficiency across a common basis. Wongchai et al. (2012) used the meta-frontier DEA model to evaluate regional differences in the technical efficiency of 77 national universities, divided into Bangkok, central, north, northeast, and south Thailand. Besides the five regions, they defined the analytical framework of meta-frontier DEA. O’Donnell et al. (2008) proposed a meta-frontier model to calculate the group and meta-frontier technical efficiencies. Therefore, this study is based on the Tone and Tsutsui (2009) SBM D-DEA and DN-DEA approaches (2014), as well as the Wongchai et al. (2012) and O’Donnell et al. (2008) meta-frontier model, modified to the Meta-frontier DN-DEA (MF-DN-DEA) model. We set up two groups of FHG and ISG to evaluate the value of the technical efficiency of the meta-frontier (MFE) and the technical efficiency of the group frontier (GFE).
We assume that there were meta-frontier group of n DMUs in all units (∂ = ∂1 + ∂2 +. . . + ∂ n ) and were divided into g groups (g = g1, g2,. . .) under different operating conditions, and xij and yrj apart indicate input item i (i = 1, 2, . . ., m) of item j (j = 1, 2, . . ., N), and output item r (r = 1, 2, . . ., s) of item j (j = 1, 2, . . ., N). The meta-frontier k of DMU can choose the most favorable final output weight, so that it gets the maximum efficiency value, and MFE of k DMU can be solved by the following linear programming (LP) equations (12) and (13).


The each DMU under group frontier will choose the most favorable final output weighted, so the GFE of the DMUs containing term efficiency, division efficiency, and overall efficiency will be solved by equations (4)–(6).
Since the meta-frontier is contained in the group frontier of g groups, the technical efficiency of meta-frontier (MFE) ρ* will be less than the technical efficiency of group frontier (GFE)

For the input items and output items of Stage 1 and Stage 2, we refer to Tone and Tsutsui (2009, 2010), in which the input items are fixed assets (FA), employees (EN), and business expenses (BE); the intermediate links between Stage 1 and Stage 2 include operating income (OI) and shareholders’ equity (SE). The output item is earnings per share (EPS) in Stage 2. Tone and Tsutsui (2014) proposed this indicating a desirable carry-over, for example, profit carried forward and net earned surplus carried to the next term, and therefore, the carry-over is net profit (NP) in this study. We illustrate the definitions of the variables as follows.
Fixed assets: Fixed assets in the yearly financial report, measured in thousand NTD.
Employees: measured in number of employees.
Business expenses: The firm’s operating costs, measured in million NTD.
Operating income: When the year the operate revenue by the company’s sales of products, measured in million NTD.
Shareholders’ equity: Firm net value in yearly financial report, measured in million NTD.
Earnings per share: The portion of a company’s profit allocated to each outstanding share of common stock, as shown in the annual financial report, measured in NTD.
Net profits: Overall net income as shown in annual financial report, measured in million NTD.
The empirical data include 32 companies in Taiwan’s financial industry, along with their annual report and financial report covering 2009–2015. Table 2 lists the Pearson correlation coefficients of the empirical data. We find that EN, FA, BE, OI, SE, EPS, and NP have very significant correlations (p < .01) with each other, showing a positive significant mutual influence relationship in all variables. In addition to EPS, the relationship of the slope between variables is more than .7 in the other variables, denoting a large linear relationship in these variables for input, output, link, and carry-over. The results imply that it is suitable to evaluate business performance of the financial industry with the DN-DEA approach in this study.
Pearson Correlation Coefficient of All Variables.

Note. EN = employees; FA = fixed assets; BE = business expense; SE = shareholders’ equity; OI = operating income; EPS = earnings per share; NP = net profit.
p < 0.05, **p < 0.01, ***p < 0.001.
Table 3 shows the descriptive statistics of the empirical data. The mean and standard deviation (SD) of EN are 6,734 and 9,574 persons; 12,239 and 17,151 million NTD for FA; 11,167 and 14,224 million NTD for BE; 74,185 and 91,027 million NTD for SE; 50,163 and 87,030 million NTD for OI; 1.30 and 1.14 NT dollars for EPS; and 5,982 and 10,093 million NTD for NP. The EPS of Union is the largest negative (−2.31 NTD), resulting in the worst efficiency value of MFE and GFE in 2010. From the average of adjustment difference (%) in each current period, the results show that the largest value is EPS of 2009–2010 and 2014–2015, OE of 2011, and FA of 2012–2013, and these are the main reasons for the inefficiency of the current year; most financial industry must adjust relating the policy of operating variables to improve business efficiency.
Descriptive Statistics of Input and Output Variables in 2009–2015.

Note. EN = employees; FA = fixed assets; BE = business expense; SE = shareholders’ equity; OI = operating income; EPS = earnings per share; NP = net profit.
JihSun’s NP value is the largest negative one (−5,590 million NTD), resulting in the worst efficiency values of MFE and GFE for 2009. Fubon has largest EPS value (6.21 NTD) and NP (63,600) in 2015, resulting in the best efficiency value of MFE and GFE. The values of maximum (Max) and minimum (Min) indicate the scale of the big difference in operations, such as Max and Min of EN being 46,631 and 41; 104,300 and 8.07 million NTD for FA; 65,070 and 79.6 million NTD for BE; 461,100 and 1,250 million NTD for SE; 458,300 and 99 million NTD for OI; 6.21 and −2.31 NT dollars for EPS; and 63,600 and −5,590 million NTD for NP. The results show that business efficiency is significantly affected by the operating environment. To achieve good business performance, a company’s strategy makers must look at market dynamics and scale characteristics to control the variables of input, output, link, and carry-over.
Empirical Result and Discussion
Table 4 lists the values of MFE for all DMUs. GFS denotes the best business efficiency equal to 1 in term efficiency (2009–2015) and overall efficiency; the overall best business performance in the top five in order is Fubon, CFC, Tachan, and Mega; the bottom five in terms of performance includes in order Union, Concord, JinSun, Tachong, and MLI. Although good and bad business performances are distributed among the FHG and ISG groups, the 4 DMUs of the last five were in the ISG group, and it is shown that overall performance of ISG is worse than FHG in meta-frontier. ISG denotes small size in terms of operating scale, resulting in labor and operating costs being prone to excessive investment, or a lack of output in operating income and net profit.
Term Efficiency and Overall Efficiency of the Meta-Frontier Group.

Note. DMU = decision-making units.
The average MFE value in 2013 is the largest (0.5485), followed by in order 2014, 2011, 2010, 2015, 2012, and 2009. The overall efficiencies of the meta-frontier for GFS, Fubon, CFC, TaChan, Mega, YF, CDF, Yuanta, TFMI, Chinatrust, TaChin, TCHC, and SKI are greater than the average value (0.4245), indicating these companies had good business performance in the meta-frontier for the period 2009–2015. The other 19 DMUs’ meta-frontiers exhibit poor business performance, and thus, they have to improve input and output variables. The change of business performance for Horizon is larger in term efficiency from 2009 to 2015 in the meta-frontier group, showing good performance in 2010–2013, but it had worse performance in 2009 and over 2014–2015; thus, it must improve its overall business strategy. TCHC and CDF offer a similar situation, as the term efficiency of CDF shows good business performance in 2009–2013 in meta-frontier, but shows worse business performance in 2014–2015; the term efficiency of TCHC implies good business performance in 2011–2012, but it has worse business performance in other periods, especially for nearly 2 years when it shows worse performance. Thus, its business strategy must improve. We find relatively poor business performance in the current actual financial market of Taiwan, and consistent with the results of the DEA approach in this study, such as Union, Concord, TaChong and MLI are all in ISG in 2009–2015. These results have important reference value for the government to formulate financial policies, and it must be valued by the government authorities.
Table 5 lists team efficiency and overall efficiency of FHG. We find the average value is between 0.5022 and 0.7192, and SD is 0.224–0.3447, indicating that the team efficiency of FHG has significant differences in 2009–2015. The average term efficiency value increased year by year over 2009–2012 and then decreased year by year for 2012–2015 in the FHG group-frontier. Fubon and Waterland have the best operating performance, as their team efficiency and overall efficiency are the largest for each year in 2009–2015. The overall efficiency of FHG is relatively better (>0.6387) and had Fubon, Waterland, Mega, JihSun, CDF, and Yuanta. 6th DMUs and the other 9th DMUs of FHG are relatively poor (<0.6387) in 2009–2015. The team efficiencies of Fubon, Waterland, and Mega are larger than the average value of each year over 2009–2015, indicating that these firms have relatively better business performance of FHG for the group frontier. The term efficiencies of the other DMUs in FHG for the group-frontier show unstable business performance in 2009–2015, denoting that these DMUs must improve their operating strategy.
Term Efficiency and Overall Efficiency of FHG for the Group-Frontier.

Note. FHG = Financial Holding group; DMU = decision-making units.
We compare the results of Tables 4 and 5 and find that the efficiency values of JihSun, SinoPac, Waterland, First, CDF, ESun, Chinatrust, and TCHC are significantly affected by the meta-frontier and group-frontier. This indicates that these DMUs need to set up a better management strategy for the input and output variables. The efficiency value is relative efficiency from the DEA approach, and so, the final efficiency value is affected by the number and size of DMU in the calculating equation. From the results, we find that some DMUs are indeed affected by the relationship between the efficiency and the group rank.
Table 6 lists team efficiency and overall efficiency of ISG. We find that the average value is between 0.5418 and 0.7099 and SD is 0.3243–0.4088, indicating that the team efficiency of ISG has significant differences in 2009–2015. The best efficiency value is 0.7099 in 2010 for the ISG group-frontier, and the worst is 0.5418 in 2009. GFS, PSC, and ChinaLife have the best operating performance, as their team efficiency and overall efficiency are equal to or close to 1 for each year in 2009–2015. The overall efficiency of ISG is relatively better (>0.5818) had ChinaLife, TFMI, YF, TaChing, PSC, TaChan, CFC, GFS, and CSC. 9th DMUs and the others 9th DMUs of ISG are relatively poor (<0.5818) in 2009–2015. The team efficiencies of ChinaLife, PSC, TaChan, GFS, and CSC are larger than the average value in each year of 2009–2015, indicating that they have relatively better business performance of ISG for the group-frontier. The term efficiencies of the other DMUs of the ISG group-frontier show unstable business performance in 2009–2015, denoting that these DMUs must improve their operating strategy; among them, the difference of business performance has the most significant change for CRI and Horizon. CRI shows good performance in 2009–2010, but poor performance in the other years. Horizon has good performance in 2012–2013, but poor performance in the other years. They both need to be more active in changing their business strategy.
Term Efficiency and Overall Efficiency of ISG for the Group-Frontier.

Note. ISG = Insurance & Securities group; DMU = decision-making units.
We compare the results of Tables 4 and 6 and find that the efficiency values of ChinaLife, MLI, MLS, PSC, and CSC are significantly affected by meta-frontier and group-frontier. This indicates that these DMUs need to improve their business strategy for the input and output variables.
The Malmquist index contains the ability of the catch-up effect (TEC), frontier effect (TCE), and overall MPI (OMI) term; the values >1 indicate progress, if = 1 and <1, then they indicate status quo and regress, respectively. TEC is related to the degree of efforts that the DMU attained for improving efficiency, while TCE reflects the change in the efficient frontiers surrounding the DMU between the two time periods t and t + 1; MPI is the geometric mean of TCE and TEC between each other period. OMI shows the ability of technological progress for the whole period. Table 7 lists the TEC, TCE, and OMI values of the meta-frontier group, as well as FHG and ISG of the group-frontier for 2009–2015. It shows the means of the TEC, TEC, and OMI values are 1.1219, 0.9912, and 1.1021 in the meta-frontier; are 1.0891, 0.9265, and 1.0024 in FHG; and are 1.0681, 1.0419, and 1.0494 in ISG, respectively. These results denote that OMI is a progressive trend for the meta-frontier, as well as for FHG and ISG in 2009–2015. OMI is affected by the group-frontier, such as JihSun and TaiShin for FHG, and CRI, TFI, MLI, and TaChong for ISG, which show a progress trend in the meta-frontier group, but a regress trend in the group-frontier. SinKong and TCH of FHG present a regress trend in the meta-frontier group, but show a progress trend in the group-frontier, meaning these DMUs must more effectively control operating variables. We find that the catch-up effect is larger than the frontier effect in the meta-frontier and FHG and ISG groups, indicating that they can change their business strategy to improve performance.
OMI, TCE, and TEC of MPI in MF, FHG, and ISG.

Note. OMI = overall Malmquist index; TCE = technique change efficiency; TEC = technical efficiency change; MPI = Malmquist productivity index; MF = meta-frontier; FHG = Financial Holding group; ISG = Insurance & Securities group; DMU = decision-making units.
To explore the relationship between performance and technological progress or regress, we combine the results of Tables 4 to 7 to divide into four groups with the key point of average value of efficiency and MPI equal to 1 in the relative relationship of meta-frontier, FHG and ISG within periods 2009–2015, are contained A group of good performance and progress trend, B group of good performance and regress trend, C group of poor performance and progress trend, and D group of poor performance and regress trend. The business strategy of Group A is to continue efforts to maintain the current operating strategy. The good efficiency of Group B may not come from the main operating projects, and thus, the business strategy must focus on innovation in commodities and service to improve the technical progress level. The technological advances of Group C do not show good performance, indicating a lack of marketing ability, and so, the business strategy must focus on improving marketing ability. Group D lacks business performance and technical ability, and thus, the operating strategy must immediately be improved.
For the meta-frontier: Mega, Fubon, Chinatrust, TFMI, SKI, YF, TaChan, and CFC belong to Group A; Yuanta, CDF, TCHC, TaChin, and GFS belong to Group B; SinoPac, Cathay, First, HuaNan, ESun, Taihsin, Union, ChinaLife, CRI, TFI, MLI, MLS, TaChong, PSC, Concord, and CSC belong to Group C; and JihSun, Waterland, ShinKong, and Horizon belong to Group D. For the FHG group-frontier: Mega belong to Group A; Yuanta, JihSun, Waterland, and CDF belong to Group B; SinoPac, Cathay, First, HuaNan, ESun, ShinKong, Chinatrust, and TCHC belong to Group C; and TaiShin is in Group D. For the ISG group-frontier: ChinaLife, TFMI, YF, TaChan, PSC, and CFC are in Group A; TaChing, GFS, and CSC are in Group B; Union, SKI, MLS, and Concord are in Group C; and CRI, TFI, MLI, TaChong, and Horizon are in Group D.
The values of efficiency and MPI are a relative efficiency value, which is greatly influenced by group characteristics. We find that Chinatrust in the meta-frontier is in Group A, but changes to Group C in FHG group-frontier; TCHC in the meta-frontier is in Group B, but changes to Group C in FHG group-frontier; CSC in the meta-frontier is in Group C, but changes to Group B in ISG group-frontier; TaiShin, CRI, TFI, MLI, and Tachong in the meta-frontier are in Group C, but change to Group D in ISG group-frontier; and ShinKong in the meta-frontier is in Group D, but changes to Group C in FHG group-frontier.
To explore whether business performance may be affected by the difference of scale and operating environment, we use the ratio of MFE and GFE, called TGR, for 2009–2015. A larger TGR value indicates that it is less affected by group-frontier and meta-frontier. Table 8 shows the TGR value of FHG. The value of TGR only involves the impact of the group-frontier or meta-frontier and is not related to the performance value of being better or worse. We find that the average values of TGR are from 0.6959 to 0.7984. Overall, for the FHG group-frontier, the average value of TGR is lower than the ISG group, indicating that the overall impact by the group-frontier is relatively large; it may be due to the larger scale of FHG group, and so is not easy to control the input variables to achieve good output performance. Yuanta, Mega, Cathay, Fubon, CDF, and Chinatrust are affected by the group-frontier relatively small over 2009–2015 (overall TGR ≥ 0.8), while JihSun and Waterland are affected by the group-frontier relatively large in 2009–2015 (overall TGR ≤ 0.5).
TGR Values of FHG Group-Frontier.

Note. TGR = technical efficiency gap ratio; FHG = Financial Holding group; DMU = decision making units.
Table 9 lists the TGR values of ISG. We find that the average values of TGR are from 0.7490 to 0.8954 in periods. The average value of TGR is larger than FHG group, and it is indicated that the overall impact by the group-frontier is relatively small and it may be the smaller scale of ISG group, so is easy to control the input variables to achieve good output performance. The value of TGR is larger contained Union etc. 13th DMUs, their values are more than 0.8, these are affected by the group-frontier is relatively small in overall 2009–2015 periods, but ChinaLife, MLI, MLS, PSC and CSC are affected by the group-frontier is relatively larger in 2009–2015 periods (overall TGR ≤ 0.5). These lower TGR values for the DMUs show that the value of TGR are unstable changed in periods; for some of the whole period, they are larger than 0.8, but other times are lower than 0.5. It indicates that the business strategy of these DMUs must be thoroughly reviewed to reduce the risk of being affected by changes in the operating environment.
TGR Values of ISG Group-Frontier.

Note. TGR = technical efficiency gap ratio; ISG = Insurance & Securities group; DMU = decision-making units.
We use the Wilcoxon test to verify the difference between the efficiency value and the TGR, presenting the results in Table 10. Here, *-good shows the efficiency is larger than the average value, which is called the high-efficiency group; *-worse is the called low-efficiency group; and *-total is the overall value of the group in this table. We find that the high-efficiency and low-efficiency groups have a significant difference (p < .0001***) in the MFE, FHG, and ISG groups. The mean score of MFE-high-efficiency (176.41) is significantly larger than MFE-low-efficiency (81.48), denoting the performance of the former is better than the latter. Similar results appear in the FHG and ISG groups. The difference in overall group efficiency is not obvious within FHG and ISG (p = .7940), but they are significantly affected by the group-frontier, are shown in TGR-total test (p = .0002***), and ISG group is affected significantly lower than FHG. There is a significant difference within MFE-FHG (p < .0001***) and MFE-ISG (p = .0002***), and it shows that the performances of FHG and ISG are better than MFE. The TGR is divided into good and worse groups, and we find that the FHG group is not significantly affected (p = .4747), whereas ISG is significantly affected (p = .0003***); it indicates that the good performance of ISG is relatively little affected by the group-frontier. The ISG group (131.07) is also relatively little affected by the group-frontier versus the FHG group (97.91) in TGR of the group-frontier (p = .0002***).
Wilcoxon Test Results of All Variables in 2009–2015.

Note. MFE = meta-frontier efficiency; FHG = Financial Holding group; ISG = Insurance & Securities group; TGR = technical efficiency gap ratio; OE = overall efficiency.
p < 0.05, **p < 0.01, ***p < 0.001.
Conclusion
This research employs the DN-DEA approach to evaluate the performance of Taiwan’s financial industry, uses the technology gap ratio (TGR) value to find the effects of the group-frontier, and utilizes the Wilcoxon test to verify the difference in efficiency and the group-frontier. We are able to get overall efficiency, annual efficiency, Stage 1 and Stage 2 division efficiencies, the catch-up effect, the frontier-shift effect, Malmquist product index (MPI), and overall Malmquist index (OMI), while the TGR value concerns the effects of the group-frontier.
Our empirical results show that the overall performance of Insurance & Securities group (ISG) is worse than Financial Holding group (FHG) in the meta-frontier, because the operating scale of ISG is smaller than that of FHG, resulting in labor and operating costs being prone to excessive investment, or due to a lack of output in operating income and net profit. It may be that ISG is in direct contact with consumers, more obviously affected by market dynamics; therefore, government needs monitoring mechanisms to avoid financial crises. The overall efficiency of meta-frontier shows better performance (MFE ≥ 0.4245) within the period 2009–2015, and there are GFS, Fubon, CFC, TaChan, Mega, YF, CDF, Yuanta, TFMI, Chinatrust, TaChin, TCHC, and SKI—13th DMUs. Some DMUs’ change of business performance is larger in terms of efficiency from 2009 to 2015 in the meta-frontier group, and thus, the overall business strategy must be improved in these companies. This study also finds that some DMUs have a negative value or close to 0 for EPS and NP in several periods. These results are similar to Mengistu (2015) utilizing financial ratio to analyze the financial performance and also found that the bank performed well in profit earning and efficiently managing its assets for generating revenue. From the original data of the meta-frontier group, these results are caused by their worse performance in these periods and for the overall period of 2009–2015. These results are consistent with actual operating data, thus showing we can use the DN-DEA approach to assess the difference in the business performance of Taiwan’s financial industry in this study. Some DMUs are significantly affected by meta-frontier and group-frontier when calculating the efficiency value, indicating that these DMUs need to improve their business strategy of the input and output variables. These results are similar to Chao et al. (2018), and they found that the financial holding companies have good efficiency and can reduce more cost. From these analyses, results find that the scale of business has a key impact on the financial industry, so the business performance of FHG is relatively stable, so this group needs to gain market advantage with a stable growth of inputs and outputs strategy model, or a combination of vertical and horizontal strategy models are also an option. These results are similar to Lo and Lu (2006) and find that big-sized financial holding companies (FHCs) are generally more efficient than small-sized ones. The business performance of ISG is relatively unstable, and the difference in the business efficiency is quite obvious, and these must control the input and output variables more finely to produce good business performance to sustain business in a highly competitive financial market. Relevant government authorities must also better monitor mechanisms to avoid financial turmoil.
We combine the results of efficiency and MPI to explore the relationship between performance and technological progress or regress in management implication. We set the key point as the average value of efficiency and MPI to equal 1 in the relative relationship of meta-frontier, FHG, and ISG within the period 2009–2015 and divide the sample into group A (good performance and progress trend), group B (good performance and regress trend), group C (poor performance and progress trend), and group D (poor performance and regress trend). The business strategies are based on different groups, and we suggest that a strategy for Group A is to continue efforts at maintaining the current operating strategy. The good efficiency of Group B may not come from the main operating projects, and so, these firms must focus on innovation in commodities and service to improve their technical progress level. Group C shows a progress trend, but not a good performance; it indicates a lack of marketing ability, and so, these firms must target to improve their marketing ability. Group D lacks business performance and technical ability; thus, these firms’ operating strategy must immediately improve.
This study uses the TGR value to explore that business performance may be affected by the difference in scale and operating environment. A larger TGR value indicates that it is less affected by the group-frontier and meta-frontier. We find that the average value of TGR is lower in the ISG group, indicating that the overall impact by the group-frontier is relatively large and may be due to the larger scale of the FHG group; thus, it is not easy to control the input variables to achieve good output performance. We also use the Wilcoxon test to verify the difference between the efficiency value and the TGR and find that the performances of good and worse groups have significant differences in MFE, FHG, and ISG; the mean score of good is significantly larger than worse group of MFE, FHG, and ISG. From the performance test, we find that FHG and ISG are better than MFE. The ISG group is relatively little affected by the group-frontier than the FHG group in TGR of the group-frontier. DEA is a relative efficiency of DMUs, and using different inputs and outputs may have different results. This study uses DN-DEA approach can examine the financial industry’s operating performance across stages and periods. These results can as a reference for establishing a dynamic business strategy in a dynamic environment. But it is not absolute efficiency and may have different results from the current operating situation, and other tools may be used to solve in future.
DEA calculates relative efficiency, and the results will be related to inputs, outputs, and DMUs; we only based on these variables to evaluate business performance of DMUs. But Taiwan’s financial industry is not only financial holding, securities, and insurance, but also banks. There are many variables that affect business performance, which are not listed in this study, such as return on equity (ROE) and return on assets (ROA). This study cannot cover all variables. However, these results of this study are sufficient to explain the differentiated performance of DMUs within multiple periods. In the future, we suggest to include banks and utilize others DEA models and compare their difference.
Footnotes
Declaration of Conflicting Interests
The author(s) declared no potential conflicts of interest with respect to the research, authorship, and/or publication of this article.
Funding
The author(s) received no financial support for the research, authorship, and/or publication of this article.