
Abstract
Independent mobility for individuals with physical impairments is essential not only for their well-being but also for advancing social equity and sustainable development. Despite the central role of mobility-assistive products, few studies have systematically investigated the factors influencing user adoption from a user experience perspective. To address this gap, this study employed a quantitative empirical approach. Experience evaluations were first collected from 257 users through interviews and online surveys, and relevant user experience attributes were extracted from 23 core publications. A preliminary evaluation scale was then developed through synthesis and expert review. Based on this scale, 390 valid questionnaires were administered, and factor analysis using SPSS 26.0 and AMOS 26.0 was conducted to construct a structured user experience evaluation scale. Entropy weight analysis was subsequently applied to determine the relative priority of each attribute. The final scale comprises four dimensions: usefulness, interactivity, caring, and universality. Notably, caring and universality—rarely emphasized in previous behavioral models—emerged as highly significant. Within interactivity, automation features were found to be the least important, and assistance with stair navigation contributed minimally to perceived usefulness. Conversely, human-centered designs that convey warmth proved critical for effective product design. This study challenges conventional assumptions regarding the needs of individuals with mobility impairments and provides concrete design strategies for stakeholders, thereby enhancing the well-being of vulnerable populations and promoting sustainable societal development. Consequently, the study carries significant theoretical and practical implications.
Keywords
Introduction
Mobility-assistive devices, such as wheelchairs, serve as effective tools for facilitating independent travel among individuals with mobility impairments (Boyle et al., 2024; Deegan et al., 2024; Utaminingrum et al., 2024). The term individuals with mobility impairments primarily refers to people who experience movement difficulties caused by illness, injury, or aging. This population encompasses individuals with physical disabilities, those unable to walk independently due to disease, and older adults with lower-limb dysfunction, collectively representing a considerable proportion of the global population. Globally, this group constitutes a significant proportion of the population. According to the United Nations (Nations, 2024), approximately 1.3 billion people worldwide live with severe disabilities, representing 16% of the global population—roughly one in six individuals. In China, people with physical disabilities constitute one of the largest subgroups (Wu et al., 2024). Given the size of this population, ensuring their ability to travel independently has become a critical issue, as it directly affects their employment opportunities (Myers & Ravesloot, 2016), access to healthcare (Wallace et al., 2005), social connections (Samuel et al., 2013), and community participation (Myers & Standley, 2024). Limitations in mobility can diminish their overall well-being (Henly & Brucker, 2019; Myers & Standley, 2024) and may adversely impact physical, cognitive, and psychosocial health, potentially exacerbating medical conditions and further reducing travel capacity and willingness (Hreha et al., 2020; Myers & Standley, 2024), thereby creating a vicious cycle. Moreover, ensuring independent mobility for this population aligns with both the United Nations human rights agenda and global sustainable development goals (Nations, 2024). Therefore, optimizing the design of mobility-assistive products is crucial not only for enhancing the physical and mental well-being of these individuals but also as a key measure for promoting social equity and sustainable development worldwide.
However, research on mobility-assistive devices for individuals with movement impairments remains limited, particularly in relation to user experience, where a substantial gap exists. Current studies on this population have largely concentrated on three main areas. One concerns the optimization of external spatial environments, such as public transportation systems (Comeau et al., 2024; Stafford & Tye, 2023; Wayland et al., 2022), recreational spaces (Comeau et al., 2024; Shikako-Thomas & Law, 2015), and community infrastructure (Longhurst et al., 2024). Another line of research emphasizes the promotion and maintenance of physical and mental health, including medical care (Mayer et al., 2024; Østerud et al., 2024; E.-J. Wang & Xiao, 2024) and rehabilitation exercises (Levine, 2024; Nagamoto et al., 2023). A further body of work highlights the importance of social participation, addressing issues such as educational engagement (Koutsoklenis & Karagianni, 2024; Krazinski & Foley, 2024; Qi et al., 2023; Rotenberg et al., 2024) and employment (Finco et al., 2024). Yet all these areas are fundamentally contingent on one critical practical issue: the need for individuals with movement impairments to transfer and move between different spaces. For example, receiving medical treatment requires traveling to a hospital, while engaging in work activities necessitates commuting to relevant workplaces. This underscores that research on mobility-assistive devices constitutes a foundational prerequisite for progress in any of these domains. Nevertheless, studies in this area remain relatively scarce and have primarily emphasized the functional and technical optimization of devices (Boyle et al., 2024; Deegan et al., 2024; Utaminingrum et al., 2024) as well as human–device ergonomic assessments (Cordes et al., 2024; Hosking, 2024; Perez et al., 2024; van Dijk et al., 2024). Few studies have systematically investigated the user experience factors of individuals with mobility impairments regarding assistive mobility devices, and have applied these insights to guide the optimization and upgrading of such products, thereby improving the user experience of individuals with disabilities, enhancing their willingness to travel and participate socially, and ultimately contributing to their overall well-being. Consequently, this area represents a significant academic gap.
User experience is defined as the perceptions and responses that arise when users interact with a product or service (Zhao et al., 2023). In contemporary product and service design, accurately and thoroughly understanding users’ needs and experiential characteristics is critical to determining a product’s success (Shayegan & Hosseinpour, 2025). According to the classical psychological framework, the Stimulus–Organism–Response (SOR) model (Mehrabian & Russell, 1974), individual behavior can be conceptualized in terms of three components: stimulus, organism, and response. Stimulus refers to external environmental factors that may influence behavior; in the context of product and service design, these are often operationalized as specific user experience attributes. The organism represents the psychological mechanisms through which users internalize these external stimuli, such as perceived value or satisfaction (Hewei & Youngsook, 2022). Response denotes the behavioral outcomes of this process, including usage intention or other related actions (Mala Kalaiarasan et al., 2024). Building on this framework, user experience elements directly shape users’ satisfaction and perceived evaluations, which in turn indirectly influence their intentions to use and related behaviors. Moreover, compared with typical users, individuals with mobility impairments are often more physically and psychologically vulnerable and sensitive (Wu et al., 2024). Consequently, systematically investigating their user experience needs and enhancing their interactions with assistive products is essential for determining whether such products can effectively support independent mobility and enable meaningful social participation.
Therefore, this study takes wheelchair-based mobility assistive devices as a representative case to identify the factors that effectively enhance the user experience of individuals with mobility impairments. A user experience evaluation scale is developed as the foundation for targeted design recommendations. This approach not only supports product design and development in relevant industries but also provides insights into the behavioral logic of mobility-impaired users. By delivering higher-quality assistive products, the study seeks to increase their willingness to travel and engage socially, thereby fostering both physical and mental well-being while advancing social equity and sustainable development. Furthermore, this research helps bridge the gap in the existing literature on the user experience of mobility assistive devices, underscoring its substantial theoretical and practical significance.
Building on this research objective, the second section of this paper details the experimental procedures and analytical methods used to construct the user experience evaluation scale. The third section presents the results of the data analysis. The fourth section discusses these results in relation to existing literature, finalizes the dimensions and content of the evaluation scale, and offers design and management recommendations to provide theoretical guidance for industry development. Finally, the fifth section summarizes the overall findings, acknowledges the study’s limitations, and outlines directions for future research.
Materials and Methods
Research Design
This study constitutes an exploratory investigation grounded in quantitative empirical methods, primarily employing factor analysis and the entropy method to systematically identify the key elements that enhance the user experience of mobility-assistive products. Factor analysis statistically aggregates highly correlated multidimensional indicators into latent factors, thereby reducing redundancy, uncovering the underlying structure of user experience, and ensuring the scientific validity and rationality of the evaluation system. Building on this, the entropy method is applied to objectively assign weights to each indicator. Based on the principle of information entropy, this method reflects the amount of information carried by an indicator through its degree of variation; indicators with greater variation are assigned higher weights, thereby effectively mitigating the subjective bias inherent in expert-based weighting. These two methods are complementary: factor analysis ensures a more scientifically grounded dimensional division of user experience factors, while the entropy method provides a more objective allocation of indicator weights. Together, they systematically reveal the primary factors influencing the user experience of mobility-assistive products and clarify the relative importance of each indicator, offering robust theoretical and practical support for subsequent design optimization and service improvement. Both methods have been widely applied in prior user experience studies. Accordingly, this study primarily draws on the methodological frameworks of Jiang et al. (Jiang et al., 2024) and Wang et al. (Z. Wang et al., 2023), who are recognized experts in the field and have extensively applied these techniques in their research, making their approaches highly valuable references.
This study was conducted in three stages. The first stage focused on the preliminary compilation of user experience evaluations. Extensive user feedback on product experiences was initially collected through in-person interviews and online open-ended questionnaires. This feedback was then enriched by reviewing relevant literature to supplement user-generated data. All responses were subsequently consolidated and subjected to expert review, resulting in the development of a preliminary user experience evaluation scale.
The second stage involved data analysis. The preliminary evaluation scale was first distributed as a large-scale questionnaire. The collected responses were analyzed using factor analysis to cluster user experience items. Building on these results, an entropy-based analysis was conducted to determine the relative priority of each evaluation indicator.
The third stage centered on results discussion. Drawing on the outcomes of factor analysis and existing literature, each factor was labeled to construct the final user experience evaluation scale. The priorities of the various elements and individual items were then examined according to the entropy analysis results, thereby revealing the underlying psychological and behavioral logic of users. Finally, specific design strategies and management recommendations for mobility-assistive products were proposed.
The detailed research workflow and procedures are illustrated in Figure 1.

The research workflow and procedures.
Participants
The primary participants in this study were individuals with lower-limb impairments caused by injury, illness, or aging. All participants were required to have intact cognitive and behavioral capacities and to be capable of traveling independently with the assistance of mobility devices such as wheelchairs.
This study began with semi-structured interviews involving 17 individuals who either currently have or previously experienced mobility impairments, including 11 males and 6 females. To address potential limitations associated with the small sample size, an extensive online open survey was conducted, collecting an additional 240 user evaluations to supplement the offline data.
To ensure objectivity, three graduate students with no involvement in this study were tasked with compiling the research findings. The compiled data was subsequently reviewed by two university professors specializing in industrial design and user experience design. Based on their feedback, the finalized items were incorporated into a large-scale questionnaire, which was widely distributed and yielded 390 valid responses.
This sample size exceeded the recommended threshold for conducting factor analysis (Comrey & Lee, 1992; Dai et al., 2020; Hair et al., 2021; Price, 1993). The demographic characteristics of the survey participants are presented in Table 1.
Participant Information for the Evaluation of the Questionnaire.

Measures
The research procedures of this study strictly adhered to ethical guidelines for human research and the requirements of informed consent. Data collection was conducted through offline interviews and online questionnaire surveys, primarily between July and November 2024. During the offline interview phase, participants were recruited online via personal social networks and public forums, with enrollment on a voluntary basis. Each participant received a reward of 50 RMB upon completing the interview. Prior to participation, researchers explained the informed consent form in detail, which outlined the study’s background and objectives. Participants were assured that the study did not involve sensitive topics, that no personally identifiable information (e.g., names or contact details) would be disclosed in any publication, and that the interview data would be used solely for academic purposes. Participants were also informed of their right to withdraw from the study at any time. The interview formally began only after participants signed the informed consent form, and the location of the interview was determined by the participant.
During the online survey phase, this study conducted two rounds of data collection. The first was an open-ended questionnaire designed to gather user evaluations, while the second was a structured scale-based questionnaire primarily intended for subsequent factor analysis. Both surveys were administered via “Credamo,” a widely used online survey platform in China. All responses were collected anonymously, and no items requested personally identifiable information. Each questionnaire began with an informed consent form, and respondents could proceed only after selecting the option “I have read and agree to participate in this study.” Participants were free to withdraw at any time, and incomplete responses were treated as invalid. Those who completed the questionnaire received a reward of three RMB.
This procedure minimized potential risks, ensured that the potential benefits outweighed any possible harms, and effectively secured informed consent from all participants.
During the formal offline interviews, two researchers were involved: one primarily asked questions, while the other recorded responses and, when appropriate, followed up with additional questions. The interviews were conducted in a semi-structured format, with core questions including: “What advantages do current mobility-assistive devices have?,”“What disadvantages do current mobility-assistive devices have?,” and “What aspects of current mobility-assistive devices could be improved?.” Respondents were asked to provide at least three answers to each question.
For the online open-ended questionnaire, the core questions mirrored those used in the offline interviews, requiring participants to describe the functional characteristics of mobility-assistive products. To ensure eligibility, a screening item was included: “Do you have lower-limb impairments due to injury, illness, or aging that prevent independent mobility and require the use of assistive devices such as wheelchairs?.” Only respondents who selected “Yes” were able to proceed; otherwise, the survey automatically terminated. This procedure helped ensure the authenticity and validity of the responses.
Meanwhile, to mitigate the subjectivity inherent in user-based functional evaluations, this study conducted a literature analysis using the Web of Science core database in October 2024. The search employed the topic keywords “wheelchair” and “assistive products for mobility disorders” connected with “OR,” while “user experience” was used as a narrowing condition connected with “AND.” The search was limited to English-language publications indexed in SSCI, SCI, or AHCI within the past 5 years (2020–2024). A total of 23 relevant papers addressing the user experience of mobility-assistive products were identified and analyzed, and descriptions of product functional features were extracted to supplement the findings obtained from the user research.
During the consolidation phase, this study followed the procedures outlined by Jiang et al. (Jiang et al., 2024) and Wang et al. (Z. Wang et al., 2023). Three graduate students, who had no conflicts of interest with this study, were invited to organize the data. They merged similar functional features across the open-ended questionnaires, user interviews, and literature review. All negative evaluations were reformulated as positive statements. The final consolidated items were required to be concise, clear, unambiguous, and non-overlapping. After this preliminary consolidation, two industry experts reviewed the results, resulting in the initial compilation of the user experience evaluation scale items, as shown in Table 2. For clarity in subsequent discussion, the consolidated elements are referred to as “Items,” while the factors derived from factor analysis are referred to as “Factors.”
Preliminary User Experience Scale for Mobility Assistive Products.

Note. 1. Frequency Explanation: The frequency represents the number of times each item was mentioned during user interviews, surveys, or literature reviews. 2. ID: The items are sorted in descending order of frequency and will be used for subsequent research discussions. 3. Data Purpose: This preliminary scale serves as the foundation for subsequent questionnaire design and factor analysis, which will clarify evaluation dimensions and priorities.
During the administration of the evaluation scale questionnaire, the survey was divided into four sections. The first section included a screening question: “Do you experience lower-limb mobility impairments due to injury, illness, or aging, and require the assistance of devices such as wheelchairs to travel independently?” Only respondents who selected “Yes” were allowed to proceed. The second section presented the informed consent form. The third section collected basic demographic information, including age, gender, and occupation. The fourth section comprised the items of the preliminary user experience evaluation scale, as shown in Table 2. Following the approach of Z. Wang et al. (2023), items with fewer than two responses were disregarded. Respondents rated each item using a seven-point Likert scale, where “1” indicated “strongly disagree” and “7” indicated “strongly agree.”
A total of 450 questionnaires were initially collected. After excluding responses that were completed too quickly, contained missing answers, or were entirely duplicated, 390 valid questionnaires remained. This sample size satisfied the requirement for factor analysis, which recommends a minimum of 10 times the number of measurement items (Comrey & Lee, 1992; Dai et al., 2020; Hair et al., 2021; Price, 1993).
Data Analysis
This study adopted the analytical approaches of Wang et al. (Z. Wang et al., 2022, 2023) and Jiang et al. (Jiang et al., 2024). Factor analysis was conducted in two stages: exploratory factor analysis (EFA) and confirmatory factor analysis (CFA). The primary aim of the EFA was to extract and summarize the specific influencing factors. The analysis was performed using SPSS 26.0. During the initial EFA, a phenomenon of “factor cross-loading” occurred, in which items exhibited factor loadings greater than .4 on multiple factors. Generally, an item is considered to correspond well with a factor only when its loading exceeds .4 on a single factor and its communality is greater than .4 (Kaiser, 1958); otherwise, items with cross-loading should be removed to optimize the results (Hair et al., 2011). In this study, after sequentially removing items Q7, Q9, Q10, Q14, and Q18, the EFA results were optimized and the cross-loading issue resolved. Ultimately, four factors were extracted, with each item loading above .4 on a single factor and having communalities above .4, indicating good convergence within each factor and clear discrimination between factors.
Additionally, the dataset exhibited a Kaiser-Meyer-Olkin (KMO) value of .84 (>.6) and a Bartlett’s test of sphericity p-value <.05, confirming that the data were suitable for EFA (Nunnally, 1994). Reliability analysis of the four factors further indicated that all Cronbach’s α coefficients exceeded .7, demonstrating high internal consistency. Overall, the analysis results aligned with expectations.
Confirmatory factor analysis (CFA) was conducted to assess the structural stability of the factors identified through exploratory factor analysis. The analysis was performed using AMOS 26. Results showed that all item loadings exceeded 0.6 (Muilenburg & Berge, 2005; Shevlin & Miles, 1998), average variance extracted (AVE) values were above 0.5, and composite reliability (CR) values exceeded 0.7 (Ahmad et al., 2016; Fornell & Larcker, 1981), indicating good convergent validity within each factor. For discriminant validity, the square roots of the AVE values for each factor were greater than the correlations between that factor and the other factors, demonstrating satisfactory discriminant validity among the four factors (Ahmad et al., 2016; Fornell & Larcker, 1981). Overall, the results of both the exploratory and confirmatory factor analyses confirmed that the user experience evaluation scale developed in this study met all reliability and validity criteria.
Subsequently, an entropy analysis was conducted based on the results of the factor analysis. Entropy analysis does not require specialized statistical software; in this study, all calculations were performed using Excel. The weight coefficient for each factor was first calculated by dividing the variance explained by each factor after rotation by the total cumulative variance explained. The resulting factor weight coefficients were 27.90%, 27.22%, 23.11%, and 21.78%, respectively.
After determining the weights of each factor, the weight of each item was further calculated according to formulas (1)–(5), where


Results
Exploratory Factor Analysis
This study conducted an exploratory factor analysis (EFA) on the questionnaire data using SPSS 26.0, ultimately identifying four factors that fully satisfied the required criteria. For all items, factor loadings exceeded .4 on a single corresponding factor, and communalities were greater than .4. The reliability of each factor, measured by Cronbach’s α, exceeded .7, the KMO value was above .6, and Bartlett’s test of sphericity was significant (p < .05). These results indicate that the four extracted factors are both valid and reliable. Factors 1 and 2 each comprised four items, while Factors 3 and 4 each comprised three items. Detailed results of the analysis are presented in Table 3.
Results of Exploratory Factor Analysis.
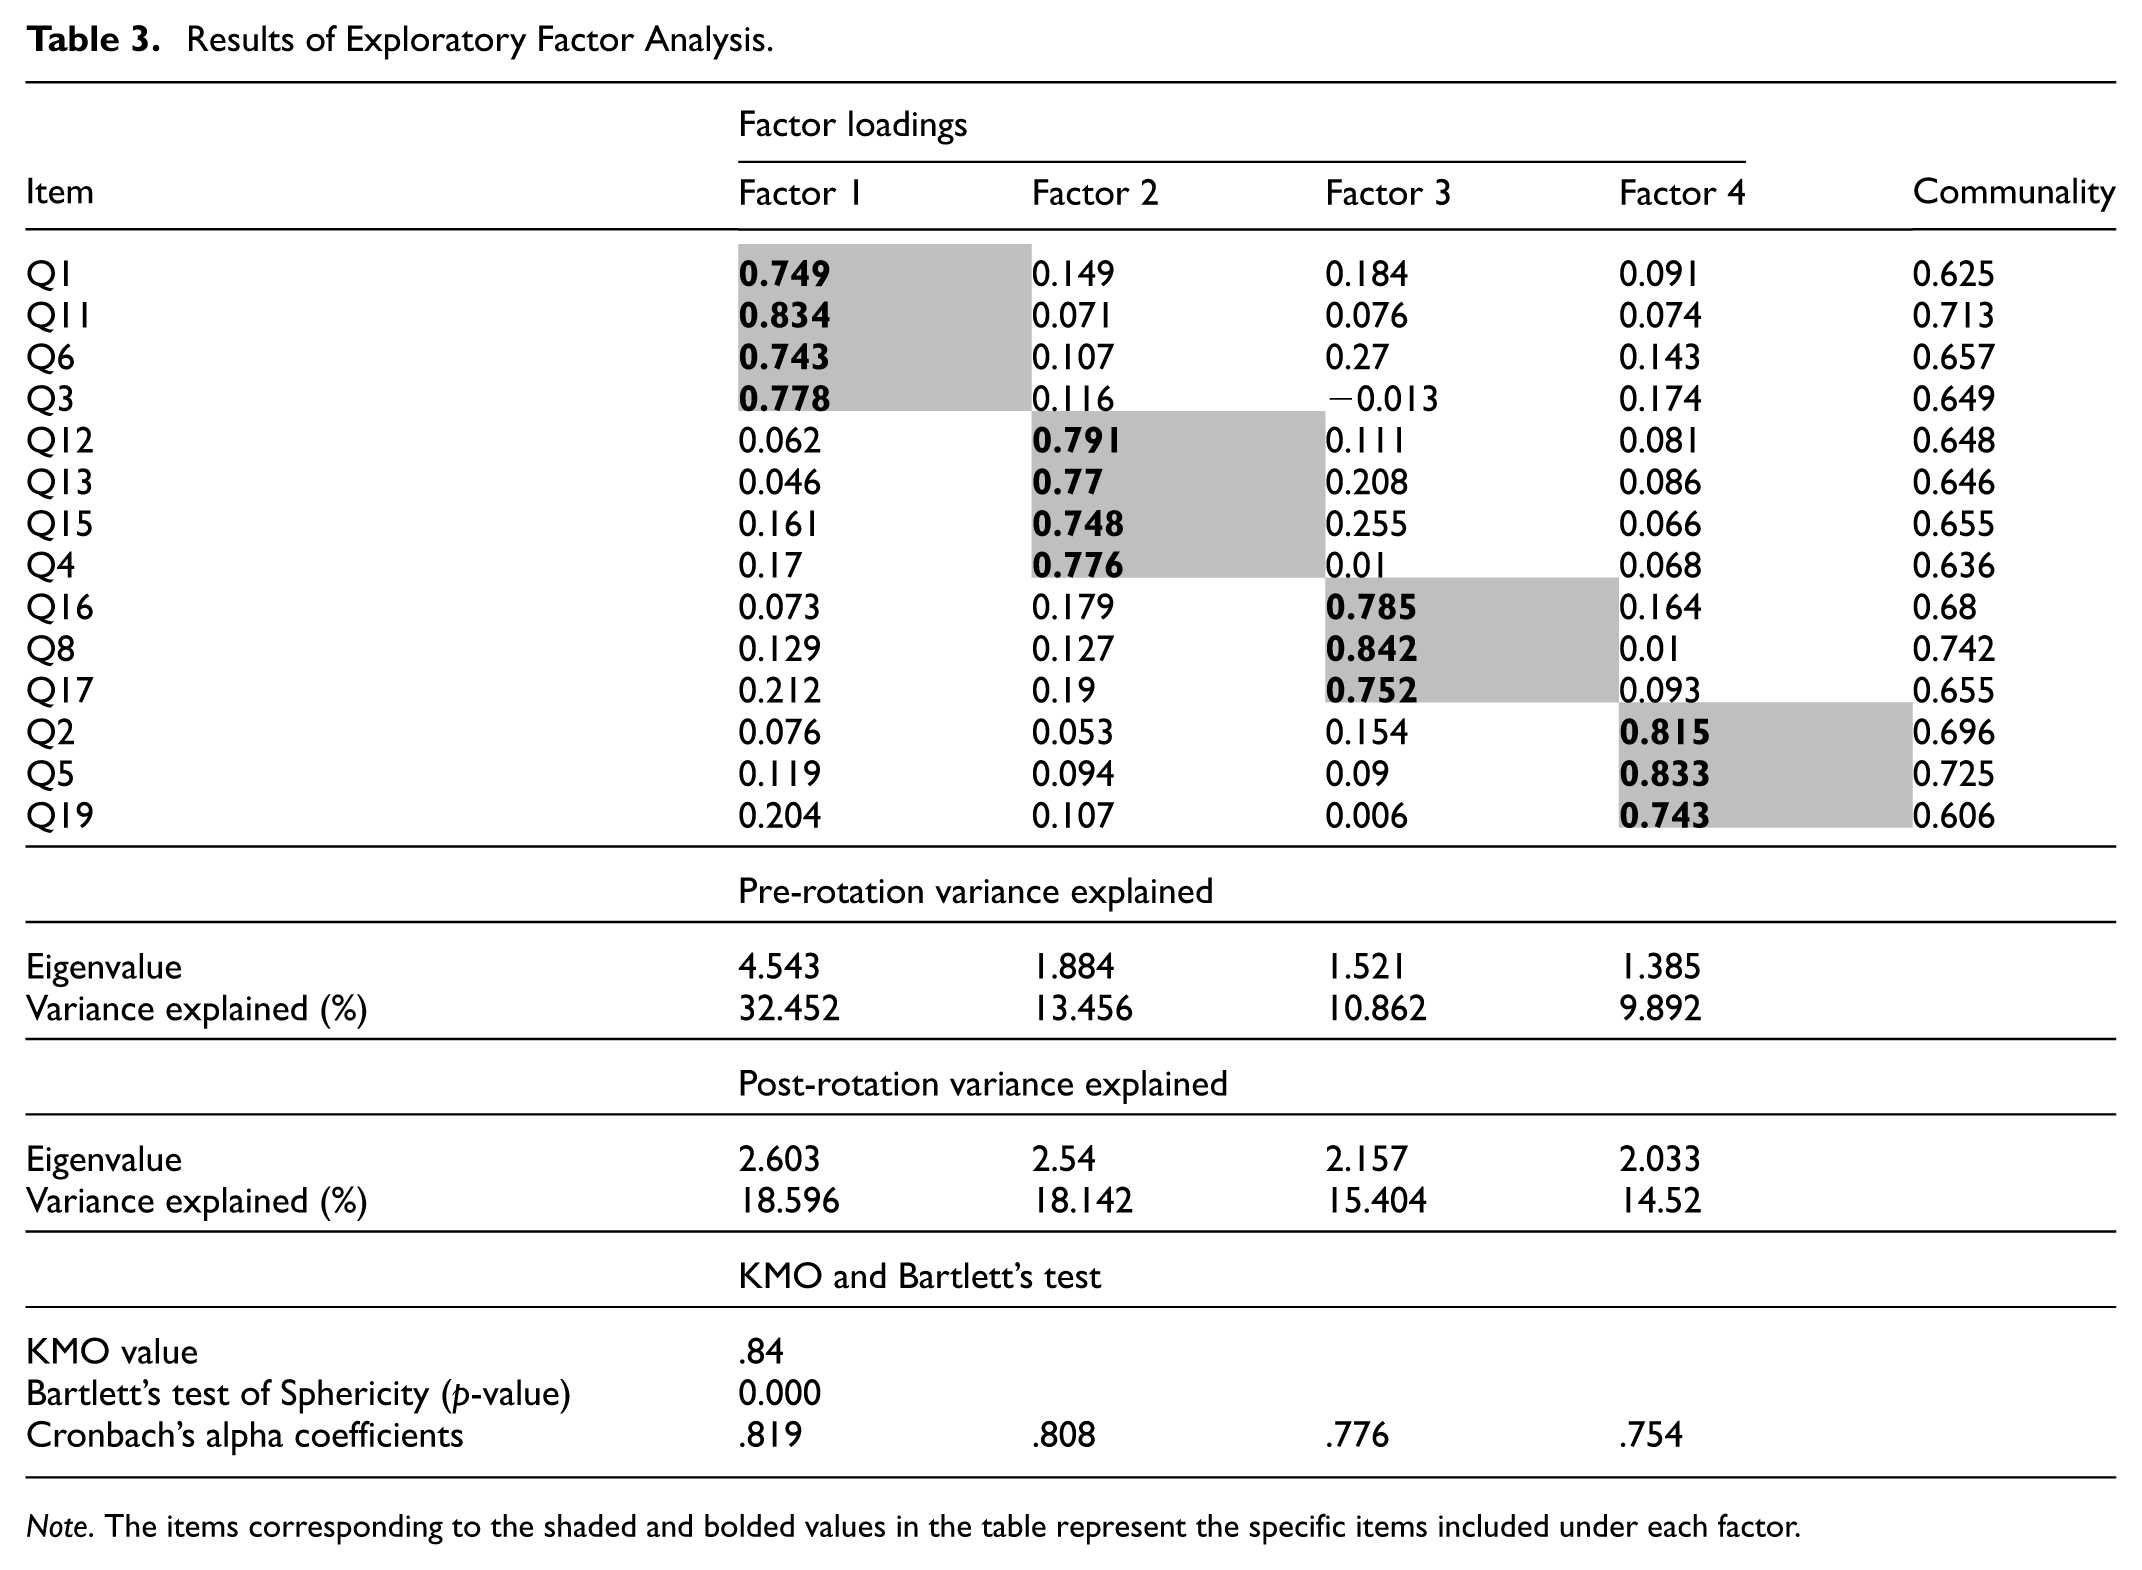
Note. The items corresponding to the shaded and bolded values in the table represent the specific items included under each factor.
Confirmatory Factor Analysis
To further assess the stability of the evaluation scale derived from the exploratory factor analysis, a confirmatory factor analysis (CFA) was conducted using AMOS 26. As shown in Table 4, all factor loadings exceeded 0.6, the AVE values were above 0.5, and the CR values were greater than 0.7, indicating strong internal consistency among the items within each factor.
Results of Confirmatory Factor Analysis.

In the discriminant validity analysis (Table 5), the square roots of the AVE for each factor were greater than the correlations between that factor and the others, confirming satisfactory discriminant validity. Additionally, the model’s goodness-of-fit indices (Table 6) all met the recommended thresholds.
Discriminant Validity: Pearson Correlations and Square Root of AVE.
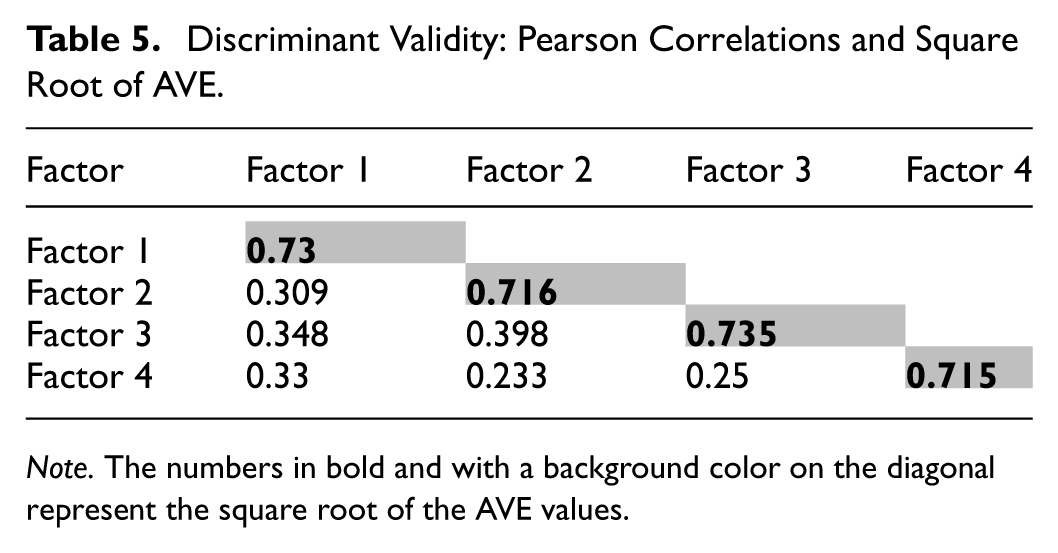
Note. The numbers in bold and with a background color on the diagonal represent the square root of the AVE values.
Fit Indexes.

These results collectively demonstrate that the dimensional structure of the user experience evaluation scale developed in this study is stable and satisfies the necessary psychometric criteria.
Entropy Weight Analysis
Building on the results of the exploratory factor analysis, an entropy analysis was subsequently conducted, with the final results presented in Table 7. Based on the factor weight coefficients of the primary indicators, the priority ranking of the factors is as follows: Factor 1 > Factor 2 > Factor 3 > Factor 4. Considering the final weight coefficients of the secondary indicators, the priority ranking of the individual items is: Q16 > Q5 > Q13 > Q2 > Q8 > Q1 > Q11 > Q6 > Q15 > Q12 > Q3 > Q19 > Q17 > Q4.
Entropy Weight Analysis Results.

Discussion
Factor Naming Discussion
Based on the items associated with each factor and insights from existing literature, this study assigns names to the factors identified in the exploratory factor analysis to establish the final user experience evaluation scale.
First, Factor 1 includes four items: Q1, Q11, Q6, and Q3. These items reflect the product's ability to improve users' action efficiency, focusing on aspects such as independence, continuity, and goal achievement for individuals with mobility impairments. This aligns with the concept of usefulness (Davis, 1989; Z. Wang et al., 2022). Consequently, this factor is named “Usefulness,” defined in this study as the effectiveness of assistive products in enhancing users' ability to act independently.
Factor 2 includes four items: Q12, Q13, Q15, and Q4. These items reflect the product's capabilities in voice interaction, remote interaction, and automatic feedback, indicating effective interactivity between the product and the user (Fang et al., 2023). This aligns with the definition of interactivity, which generally refers to the responses triggered by user actions (Skadberg & Kimmel, 2004). In this study, the factor is named “Interactivity,” defined as the ability of assistive products to engage effectively with users through efficient and effective interaction methods.
Factor 3 consists of three items: Q16, Q8, and Q17. These items highlight how the assistive device minimizes discomfort during use, focusing on speed, comfort, and warmth. They emphasize the product's attention to users' well-being, especially addressing the needs of vulnerable groups, in addition to its primary function of enhancing mobility. The concept of care design involves addressing the emotional and physical needs of these groups (Jiang, 2022). As such, this factor is named “Caring,” defined as the extent to which assistive products meet the sensory and physical needs of individuals with mobility impairments.
Factor 4 includes three items: Q2, Q5, and Q19. These items demonstrate the product's universality characteristics, including its charging method, applicable environments, and user adaptability in terms of size. Universal design refers to products, services, systems, or environments that are accessible to all users (Lee & Xie, 2025), which aligns with the content of Factor 4. Thus, this factor is named "Universality," defined in this study as the degree to which assistive products can be effectively utilized by individuals across diverse conditions.
Factor Priority Discussion
Based on the results of the exploratory factor analysis, the weight coefficients for the four factors developed in this study are 27.90%, 27.22%, 23.11%, 21.78%, respectively. Accordingly, the priority of the factors is ranked as follows: usefulness, interactivity, caring, and universality.
Among these, “usefulness” has the highest weight coefficient, indicating that it holds the highest priority. This finding is consistent with previous research on user experience and behavioral intentions (Putro & Takahashi, 2024; Yao & Wang, 2024), where usefulness is regarded as the core factor influencing user willingness to use (Xiao & Goulias, 2022). For individuals with mobility impairments, the ability to travel independently is a fundamental need. Therefore, the primary consideration when using assistive products is whether they can effectively enhance travel efficiency. However, when examining the final weights of the items within Factor 1, it is evident that the item related to assisting users in navigating stairs has the lowest priority and falls below the average weight. Historically, navigating stairs has been one of the greatest obstacles to independent travel. However, in this study, it is considered a secondary feature, which is a novel finding. This may be attributed to the fact that enhancing overall independent mobility represents the fundamental and most important function of such products, while navigating stairs is a more specific and supplementary feature. Additionally, with the ongoing improvement of infrastructure in China, many buildings and public facilities are now equipped with elevators, diminishing the reliance on assistive devices for navigating stairs.
Next, “interactivity” has the second-highest weight coefficient, placing it as the second most important factor. This is because interactivity is directly related to how the product is used, influencing the user's learning cost and the ease of using the product (Z. Wang et al., 2023). These factors impact user satisfaction (Topçu et al., 2023) and usage efficiency (Lucia-Palacios & Pérez-López, 2021), making interactivity the second most important factor among the various influencing elements. However, it is worth noting that the final weight of item Q4, which is included in this factor, is significantly lower than that of the other items, making its importance the lowest among all the items. This is likely because the core function of assistive devices is to help individuals with mobility impairments travel independently. The feature of fully automated responses described in Q4 may, to some extent, reduce the user's sense of autonomy, leading to a loss of self-esteem and, consequently, a diminished evaluation of this feature.
Subsequently, the weight coefficient of the “caring” factor is 15.404%, placing it as the third most important factor. This factor is relatively novel and has been scarcely addressed in many established models of user behavior, such as the Technology Acceptance Model (Davis & Davis, 1989), the UTAUT2 model (Acosta-Enriquez et al., 2024), and the Expectation Confirmation Model (Albahar et al., 2023). This represents a relatively new finding. As the third key factor, beyond the product's functional effectiveness (usefulness) and usage method (interactivity), “caring” is of particular concern to individuals with mobility impairments. When an individual's physical abilities are restricted, it can lead to a psychological sense of helplessness and marginalization (Budworth, 2023). In such circumstances, users increasingly need products that provide both physical comfort and emotional care. Moreover, the final weight of item Q16, at 9.51%, is significantly higher than that of the other items, underscoring the importance that users with mobility restrictions place on warmth in cold environments. Research has shown that for individuals with mobility impairments caused by illness or frailty, warmth is essential (Burholt & Windle, 2006). This suggests that, in cold conditions, the warmth feature of the product is the most caring characteristic and a crucial design feature.
Finally, although the weight coefficient of the “universality” factor is 14.52%, slightly lower than that of the other factors, it remains highly significant in the design of assistive mobility devices. This factor improves the device's flexibility and applicability, enhancing the user's experience in diverse environments. The universality of the device, especially its compatibility with different ground surfaces, can significantly expand its range of use, meeting users' diverse mobility needs. This increases their independence, boosts their confidence when going out, and reduces concerns about the external environment. Additionally, the charging method's universality and convenience can effectively extend the product's usage duration, lower the usage threshold, alleviate users' anxiety about power supply during travel, and enhance their sense of trust and security. Furthermore, the compatibility between the user's body and the device size allows the product to accommodate a wider range of users, reflecting their personalized needs and improving comfort and overall user experience. It is also worth noting that the final weight of Q19 is slightly lower than that of the other two observed variables in the Universality factor. This may be because the other two variables have a more direct impact on the product's core functionality in assisting users with mobility. In contrast, the ability to adjust the device based on personal characteristics is usually required only during the initial setup, and once adjusted, it is seldom modified. As a result, users tend to place less emphasis on this feature, leading to a relatively lower priority for this factor.
Design and Management Recommendations
This study focuses on wheelchair-based assistive devices and develops a user experience evaluation scale for individuals with mobility impairments. By employing entropy weight analysis, the study identifies the priorities of observation variables that influence user experience. This research addresses a gap in existing literature, which has seldom provided a comprehensive exploration of the factors affecting the user experience of assistive devices. Furthermore, it offers practical design and optimization strategies for product suppliers, making significant contributions to both theoretical understanding and practical applications. Based on the analysis results, the study proposes specific design strategies and management recommendations, providing constructive insights for the related industry.
The highest priority is assigned to usefulness, making this element a focal point in the design process. Among its observation variables, Q1 (Easy to operate, allowing independent use) holds the highest weight, indicating that the design should prioritize minimizing learning costs and usage barriers. This can be achieved by incorporating features such as a one-touch operation interface, smart voice commands, or gesture control to simplify complex processes. Additionally, designing a simple user interface and offering multilingual operation guides would further enhance the device's accessibility. Secondly, regarding Q11 (Provides users with the ability to travel independently), this item requires the product to adopt a lightweight design, meaning that by selecting light materials (such as carbon fiber), the device’s weight is reduced, making it easier for users to push or move. A foldable structure could also be integrated to enhance portability and ease of storage during travel. Moreover, incorporating GPS and obstacle detection functions would allow the device to offer safe route planning, helping users overcome environmental barriers. Following this, Q6 (Long battery life, allowing extended outdoor use) ranks third in priority. To address this feature adequately, the design should integrate efficient battery technologies, such as high-energy-density lithium batteries, and intelligent power management systems to extend usage time. The inclusion of fast-charging capabilities and removable battery modules would also alleviate concerns regarding battery life. Furthermore, integrating an energy recovery system, such as regenerative braking during downhill movements, would help prolong the battery’s lifespan. Finally, Q3 (Assists users in climbing stairs) has a relatively low priority. However, in specific user scenarios—such as areas lacking accessible facilities—this feature still holds significant value. To address this issue, modular design provides an effective solution. For example, features like stair-climbing mechanisms (e.g., tracked chassis or electric lift systems) can be offered as optional modules, meeting the needs of specific users while reducing the overall cost and complexity of the device. In addition, promoting the development of accessible environments can further reduce users’ dependence on this feature.
Interactivity ranks second in priority and should not be overlooked. Among its observation variables, Q13 (Smart voice call functionality) has the highest priority. This requires incorporating a high-quality voice processing system into the product design, enabling effective noise suppression and accurate natural language processing. It ensures that users can communicate clearly even in noisy environments. Additionally, integrating an emergency contact feature allows users to quickly reach out for help in dangerous situations or when assistance is needed. Furthermore, the product should support seamless integration with mainstream communication platforms (e.g., smartphones and smart home systems) to enable multi-device interaction, thus enhancing the smart voice communication function. For Q15 (Equipped with remote control functionality) the product should provide multi-mode remote control, supporting smartphone apps, traditional remotes, and gesture-based operations to accommodate different user preferences. Additionally, a real-time status monitoring feature should be offered as an optional function, allowing users or their family members, with consent, to track the wheelchair’s location, battery level, and operational status. For Q12 (Smart voice control functionality) the product design should integrate an intelligent voice assistant, enabling direct voice interaction. The voice control functionality should be combined with the device’s environmental sensing capabilities to achieve more intelligent responses, such as automatically alerting the user when an obstacle is detected. Furthermore, custom voice commands should be supported, enhancing the convenience and personalization of the interaction. Finally, Q4 (Automatically responds and makes judgments based on actual situations) ranks lowest among all the observation variables. As such, this feature can be given less focus during the design process, allowing the product to prioritize other, more essential functionalities.
Caring features rank third in priority, which is relatively low. However, it is important to note that Q16 (Provides warmth outdoors in winter) has the highest priority among all the variables. Therefore, this aspect must be given significant attention and implemented effectively. The product should first be equipped with a temperature control heating system, allowing users to adjust the temperature according to their needs, ensuring adaptability to different climatic conditions. Carbon fiber or graphene heating materials should be embedded in the seat, backrest, and armrests to enhance localized warmth. Additionally, detachable thermal components, such as sunshades or insulation blankets, should be designed, enabling users to purchase and install them as needed. Although Q8 (Highly comfortable to use) and Q17 (Suitable speed) have relatively lower priorities, they should still be realized to the greatest extent possible. In terms of comfort, the product should optimize the seat shape based on the human body curve, providing lumbar and neck support to alleviate fatigue from prolonged use. The seat surface should be made of breathable materials, with added shock-absorbing designs to enhance dynamic comfort. Furthermore, the product should feature a suspension system to optimize the contact between the wheels and the ground, reducing bumpy sensations and improving overall comfort. Finally, regarding speed, the maximum speed should be set according to local laws and regulations to ensure safety during operation. Additionally, multiple speed options should be available, allowing users to switch between different modes based on the scenario (e.g., slow mode for crowded areas and fast mode for open spaces). A body detection function could also be integrated to adjust the speed based on the user's physical condition, ensuring safe usage at all times.
Finally, although the priority of universality is the lowest, the final weights of items Q2 (7.34%) and Q5 (7.94%) are both higher than the average weight of all items (7.14%). Therefore, these two items should not be overlooked and must be implemented as effectively as possible. For Q2 (Lightweight charging device, enabling convenient charging anytime, anywhere), the design should focus on making the charging device lighter and more universal. For example, high energy-density batteries (such as solid-state batteries) can be used to reduce the weight of the battery. The charging interface should adopt a common design to ensure compatibility with various environments, allowing users to charge the device at any time. Additionally, a dedicated charging cable storage area should be incorporated into the wheelchair, enabling users to charge effectively in any environment. For Q5 (adaptability to various types of terrain), the wheelchair should use high-strength rubber materials and anti-slip tread patterns to ensure traction on wet or uneven surfaces. Additionally, sensors should be installed to detect the type of terrain in real time, adjusting the suspension system or tire settings to enhance adaptability. The wheelchair should also incorporate shock absorption in the wheels to reduce the bumps caused by complex terrains, improving the overall ground adaptability of the product. Finally, for Q19 (Adjustable height), the final weight is below the average weight, and its priority is the lowest among all universality-related items. Therefore, this feature only needs to be appropriately ensured. In the design, a telescoping seat and armrest should be introduced, allowing users to adjust the height and width either manually or electrically to meet different user needs. Offering a variety of height and size components for users to switch depending on the scenario will further enhance the product's universality.
Theoretical and Practical Value
This study pioneers the development of a user experience evaluation scale for assistive mobility devices targeted at individuals with mobility impairments. By utilizing entropy value analysis to determine the weight priorities of each observation variable, this research holds significant theoretical and practical implications.
First, in terms of theoretical contribution, prior research on assistive products has primarily focused on technological advancements, with limited exploration of the specific factors influencing user willingness from a user experience perspective. This study bridges that gap by systematically combining user interviews, factor analysis, entropy value analysis, and literature review to identify the key factors affecting user experience. This approach effectively addresses the shortcomings of previous research. Notably, in examining the factors influencing user willingness, this study identifies two crucial elements—care and universality—that have been largely overlooked in existing user willingness models. This finding expands the scope of research on the behavioral logic of individuals with mobility impairments, offering significant theoretical value. Furthermore, the entropy value analysis of all observation variables reveals that, while strong automation features are generally perceived as enhancing convenience, excessive automation can, in fact, reduce autonomy for individuals with mobility impairments. This loss of autonomy can harm their self-esteem and lead to negative perceptions of the product. This discovery enriches the understanding of the behavioral logic of individuals with mobility impairments, challenging previous research biases and holding substantial theoretical significance.
In practical terms, this study provides valuable design and management strategies for relevant industries, derived from the results of factor analysis and entropy value analysis. These strategies offer actionable insights that can effectively guide design and research and development (R&D) efforts, as well as facilitate the industrial upgrading of relevant sectors, thereby holding significant practical value. Moreover, the user experience evaluation scale developed in this study, along with the entropy value analysis results, plays a critical role at various stages of industrial R&D. During the R&D phase, the evaluation scale and entropy value analysis priorities can assist enterprises in setting design goals, integrating industry resources, and prioritizing the implementation of features with higher entropy value weights. This enables companies to focus on their strengths and mitigate potential weaknesses in their products. In the product launch phase, the user experience evaluation scale can serve as an effective tool for gathering user feedback. By having users fill out questionnaires, companies can identify the actual strengths and weaknesses of their products. Utilizing the insights from entropy value analysis, companies can pinpoint areas for optimization and determine the specific direction for product improvements, thereby driving sustainable industry development.
Finally, in terms of social value, the daily basic rights of vulnerable populations with mobility barriers—such as people with disabilities and the elderly—are central issues on the United Nations’ human rights and sustainable development agendas. The user experience evaluation scale developed in this study allows relevant industries to recognize that these special populations require not only functional support when using assistive products but also social understanding and care. This aspect has often been overlooked in traditional behavioral intention models. The findings of this study can help both academia and industry reconsider the value logic of assistive products and promote a shift in product design and development from a purely functional orientation to a multidimensional, human-centered approach. Furthermore, the results provide evidence-based insights for policymakers, ultimately improving the daily and public mobility experiences of vulnerable groups, enhancing their social participation, and narrowing the gap between them and healthy populations. This has significant implications for promoting social sustainability, fairness, and inclusive development.
In summary, this study carries substantial theoretical, practical, and social significance.
Conclusion
Research Conclusions
This study systematically combined user interviews, literature research, factor analysis, and entropy value analysis to identify the specific factors influencing users' willingness to use assistive devices and developed a user experience evaluation scale. The study also determined the priority of product functional attributes, providing constructive design strategies and methods for related industries. This research addresses the limitations of previous studies that lacked a focus on user experience for assistive products, challenges traditional biases in understanding the behavior logic of individuals with mobility impairments, and offers concrete directions for industry development. The study holds significant theoretical and practical value. The specific research conclusions are as follows:
(1) The user experience evaluation scale influencing users' willingness to use assistive devices consists of four dimensions: Usefulness, Interactivity, Caring, and Universality.
(2) The core element affecting users' willingness to use assistive devices is usefulness. However, among the various observed variables of usefulness, the traditionally recognized core issue of “assisting users with stairs” is not widely emphasized by users in practice.
(3) Within the interactivity dimension, the automation feature, which has traditionally been thought to provide convenience for users, has the lowest priority for people with mobility impairments.
(4) The caring and universality dimensions are new findings in this study. These two elements have been largely overlooked in previous behavioral intention models. Moreover, the warmth function within the caring dimension has the highest weight among all observed variables.
Limitations and Future Directions
This study combines both quantitative and qualitative research methods to construct a user experience evaluation scale for assistive devices for individuals with mobility impairments and determines the priority of each influencing factor and observation variable. While this research fills a gap in existing studies and offers practical design recommendations for relevant enterprises, contributing to their sustainable development, several limitations must be acknowledged.
First, during the factor analysis-based questionnaire survey, participants with mobility impairments were invited to voluntarily complete the survey through an online questionnaire platform. Consequently, the gender and age distribution could not be fully controlled. Despite extended data collection, the proportion of male participants and those over 55 years of age remained relatively low, resulting in an imbalance. This represents a limitation of the current study. Future research could aim to more rigorously control the gender and age distributions to enhance the generalizability of the findings.
Second, this study focused primarily on individuals with mobility impairments but did not differentiate the underlying causes of these impairments, such as disease-related limitations, leg injuries, or age-related mobility decline. User experience evaluations may vary depending on the specific cause of impairment. Therefore, future research could further categorize participants by the origin of their mobility limitations to increase the specificity and relevance of the findings.
Third, since this study is primarily conducted within China, the respondents are mainly Chinese. However, due to differences in countries, regions, cultures, infrastructure development, and individual levels of technology acceptance, user needs for mobility assistive devices may also vary. As a result, the findings of this study may not be fully applicable to users in other countries. Future research can focus on conducting targeted studies in different countries to facilitate the localization and adaptation of relevant mobility assistive products.
Meanwhile, since the primary objective of this study is to explore factors that effectively enhance users’ willingness to use assistive products, the influencing factors extracted in the experimental analysis are predominantly positive. Although the research methods and procedures employed generally align with established standards in related studies, this approach somewhat overlooks the potential impact of negative factors associated with mobility-assistive products on individual behavioral intentions—for example, safety risks related to batteries. Such issues can be mitigated through service design, for instance, by embedding battery monitoring chips in the device to track temperature, charge, and health status in real time, issuing alerts via voice or a mobile application, and coordinating timely maintenance with the manufacturer. However, because these negative factors were not the primary focus of this study, they were not systematically explored. Therefore, future research could specifically investigate these negative factors and seek to enhance users’ experience and willingness to use assistive products from a risk mitigation perspective.
Lastly, in constructing the user experience evaluation scale, the study relied on user interviews and online surveys, which may introduce some degree of subjectivity. Although the user research results were supplemented with objective evaluations from existing literature, the initial evaluation items inherently carry subjective elements. Future research could incorporate more objective tools, such as eye-tracking devices, emotion-detection equipment, and physiological sensors, to track users' experience changes during product interactions. This would provide more objective user evaluations, enhancing the robustness and objectivity of the research findings.
In conclusion, while this study makes significant contributions to the field, these limitations present opportunities for further research to refine and expand its scope, ensuring broader applicability and more precise insights.
Footnotes
Acknowledgements
The authors gratefully acknowledge the support provided by the School of Design, Jiangnan University, for this research.
Ethical Considerations
This study has obtained the approval of the Medical Ethics Committee of Jiangnan University. Reference Number: JNU202312IRB14.
Consent to Participate
All participants provided informed consent and voluntarily participated in this study. Additionally, the study does not involve any information or images that could potentially harm the participants.
Author Contributions
Z. W.: Conceptualization, Methodology, Software, Validation, Visualization, Writing – original draft; R. D.: Funding acquisition, Investigation, Project administration, Supervision, Writing – review and editing; R. N.: Supervision, Writing – review and editing.
Funding
The authors disclosed receipt of the following financial support for the research, authorship, and/or publication of this article: This study was supported by the Postgraduate Research & Practice Innovation Program of Jiangsu Province [KYCX25_2626]; the China Scholarship Council [202506790034]; the General Project of National Social Science Foundation of China in Art [21BG131]; and the General Project of Philosophy and Social Science Research in Higher Education Institutions [2024SJYB0651].
Declaration of Conflicting Interests
The authors declared no potential conflicts of interest with respect to the research, authorship, and/or publication of this article.
Data Availability Statement
The data that support the findings of this study are available from the author, [Z. W.], upon reasonable request.