
Abstract
Virtual fitting applications have brought new vitality and immersive experiences to the fashion industry. As users adapt to the new fashion consumption experience enabled by virtual fitting, their demands are becoming increasingly diverse and complex. Therefore, it’s essential to deeply understand real user demands and use design resources effectively to meet these demands. This study assesses virtual fitting products on the market using smart data analysis techniques. Through panel group interviews, we’ve identified and preliminarily assessed user demands. We’ve categorized and prioritized these needs using the Kano model and transformed them into concrete design requirements using the Quality Function Deployment (QFD) method, establishing a system of design requirements. These requirements fall into three categories: visual design, interactive design, and emotional design. Each category includes core, secondary core, and peripheral core requirements. Eight core design requirements, such as personal image customization, extensive accumulation of apparel model libraries, and brand fan engagement were identified as top priorities for implementation. Eight secondary core design requirements, including realistic digital fabric rendering effects, real-time updates of the latest apparel models, and sharing of virtual fitting images should be integrated into design practices as resources allow. Nine peripheral core design requirements, like apparel aligning with mainstream aesthetic preferences, customizable avatar body dimensions, and minimalist user interface design can serve as references for inclusion in design practices. This research provides essential theoretical support for resource allocation in the design and iteration of virtual fitting applications, offering design solutions to meet the multifaceted real user demands in the rapidly changing field of digital fashion.
Plain language summary (PLS)
Keywords
Introduction
In recent years, the fashion industry has introduced numerous digital technologies, such as 3D scanning, the Internet of Things, artificial intelligence, virtual reality (VR), and augmented reality (AR) (Akram et al., 2022). This digitalization is driving significant changes within the industry (Nobile et al., 2021). The integration of digital technologies has given rise to numerous new products, services, and business models (Jiang, 2020). Consumers are increasingly accepting of digital technologies, blurring the boundaries between the virtual and the real ( Liu et al., 2019). Notably, AR and VR have been widely adopted in virtual fashion shows (Jung et al., 2021), in-store retail (Lewis & Loker, 2017), and virtual fitting applications (Ornati et al., 2022), with virtual fitting being relatively more widespread and technologically mature.
In the post-pandemic era, online and mobile shopping have surged. Clothing is a tangible product with an experiential nature (Entwistle, 2000), and the ability to try on products and experience services is an important consideration when purchasing apparel (Blázquez, 2014). The lack of a fitting option has been a significant challenge for online shopping. Virtual fitting applications address this issue by simulating the size, fabric, and functionality of garments, enhancing the fitting experience and enabling multisensory experiences in mobile shopping (Kim & Ha, 2021). Digital media, especially mobile applications, allow consumers and brands to establish digital connections anytime, anywhere through virtual fitting technology (Lorenzo-Romero et al., 2021), facilitating immersive consumption experiences and transforming traditional fashion business models.
However, virtual fitting technology is not without its drawbacks. Its development and application are costly, and maintaining data centers and networks increases power demand (Chen et al., 2020). The resource and energy consumption process generates substantial waste, posing environmental sustainability concerns (Wagner & Kabalska, 2023). Additionally, some fashion brands view these technologies skeptically due to the financial and technological investments required and believe their primary audience consists of younger consumer groups, limiting their reach (Profumo et al., 2024). Critics in the industry press have also raised concerns about the potential for digital fatigue among consumers, the loss of traditional craftsmanship, and the depersonalization of the shopping experience(Jin & Shin, 2021; Silvestri, 2020). Overall, virtual fitting applications in the fashion industry are a relatively new and controversial topic that warrants further exploration and research.
Technical Composition and Commercial Applications of Virtual Fitting
Virtual fitting technology can be divided into 3D and 2D virtual fitting. 2D virtual fitting involves inputting the target garment and the user’s image. It is simple to operate and relatively low cost but is limited by the dataset, constraining model poses, images, genders, and fitting angles (Lai et al., 2020; Morelli et al., 2022). 3D virtual fitting, based on computer graphics and image processing techniques, constructs a 3D spatial human body model using stereoscopic visual data or 3D human body data obtained from a depth camera, utilizing knowledge from fields such as computer graphics, garment engineering, and ergonomics (Werdayani & Widiaty, 2021). As a hot topic, 3D virtual fitting has a strong research foundation, from physics-based garment modeling (Meng et al., 2010) to garment fitting methods based on skeletal model binding (Wu et al., 2018) and real-time garment synthesis techniques (Pan et al., 2022). Recently, combining 3D virtual technology with AR has enabled functions like rapid garment changing, dynamic and static garment display, and reduced online returns (Ornati et al., 2022). Thus, AR virtual fitting technology has become a research hotspot in the apparel field and is the primary focus of this study.
Currently, AR virtual fitting is primarily developed by commercial companies providing virtual fitting solutions to enhance online user interactions (Ornati et al., 2022). Some brands use in-store third-party 3D scanning systems to collect customer body data (Lewis & Loker, 2017), improving the accuracy and fit of virtual fitting. Mobile applications have become an effective way to implement virtual fitting through the latest smartphone cameras, enabling virtual product displays and online fitting and shopping (Ornati et al., 2022). Whether using standalone scanning systems, physical devices, or mobile applications, AR virtual fitting technology greatly enhances the online shopping experience (Gill, 2015). As demand for online shopping fit and interactivity increases, fashion companies globally are investing in digital technologies, including AR virtual fitting (Hwangbo et al., 2018).
From a commercial perspective, AR virtual fitting offers advantages like easy acceptance by mainstream consumers and catering to personalized needs (Nobile & Kalbaska, 2020). Luxury brands such as Gucci, Burberry, and Dior have launched AR virtual fitting applications to enhance customer experiences. Digital technologies help reduce product and material losses, improve resource utilization, and boost information processing efficiency (Nambisan, 2017). AR virtual fitting applications support sustainability by reducing physical sample usage, lowering return rates, and improving supply chain efficiency. From the consumer’s perspective, these applications reduce shopping risks and provide multisensory, interactive, and creative experiences in online and offline stores (Kim & Ha, 2021). In summary, virtual fitting applications represented by AR virtual fitting not only increase user purchase intentions (Beck & Crié, 2018) but also enhance user satisfaction (Buyukaslan et al., 2020; Lee & Xu, 2020), and their large-scale introduction into sales scenarios is an unstoppable future trend.
Current Research Status of Virtual Fitting Applications
Research on virtual fitting applications primarily focuses on system architecture, technical optimization, and application strategies. Scholars have worked on enriching virtual fitting systems to enhance effects and add new functions, such as systems capable of automatically generating industrial patterns from 3D garment models (Pietroni et al., 2022) or transferring patterns onto garment pieces through digital printing (Lu et al., 2017). Technical optimization research focuses on 3D body measurement, modeling, and garment modeling technologies, crucial for the final effect of 3D virtual fitting. Advances in deep learning and machine learning have improved the efficiency and accuracy of body measurements (Ileperuma et al., 2020; W. Liu et al., 2022).
Research on application strategies emphasizes user-centric personalized customization. Some studies explore collaborative design patterns among consumers, designers, and experts to increase personalized customization (Sharma et al., 2021; Wang et al., 2022). Privacy and ethical concerns also arise, with some users worried about how virtual fitting applications handle their data (Karlsson & Skarin, 2023). However, many users, especially millennials, are less concerned about digital privacy and are accustomed to sharing personal data for convenience (Weiss, 2020).
Exploring virtual fitting from the user experience (UX) perspective is relatively scarce. Positive UX can enhance brand image and support purchase decisions (Bascur & Rusu, 2020; Ludwig et al., 2021). Accurate understanding and evaluation of interactive behaviors and techniques are crucial to align the system’s functional logic with users’ cognitive logic and needs (Y. Liu & Hansen, 2021). The design of virtual fitting applications should be based on in-depth research on user experiences and needs (Karlsson & Skarin, 2023).
Research has largely focused on user attitudes and behaviors toward virtual fitting. For example, Hanna Lee et al. classified virtual fitting technologies from a UX perspective (Lee & Xu, 2020), and Marie Beck et al. studied the impact of online virtual fitting on consumer behavior (Beck & Crié, 2018). Ailin Li et al. investigated Chinese consumers’ adoption behavior using the technology acceptance model (Li & Xu, 2020). These studies have made significant contributions to understanding user experiences and behaviors regarding virtual fitting. However, current research lacks a more granular classification and in-depth investigation of user demands and has not effectively translated them into concrete design requirements and systems, limiting the practical guidance of research findings for the design of virtual fitting applications. Faced with rapid technological iterations and a changing market, user demands for virtual fitting applications are difficult to fully satisfy, necessitating an agile application development process. Based on this, the present study employs the Kano Combined Quality Function Deployment (referred to as Kano-QFD) method to investigate user demands for virtual fitting applications, translating user demands into design requirements and establishing a design requirement system. The aim is to enhance user experience and satisfaction, providing theoretical support for developing virtual fitting applications that meet multidimensional user demands, and driving the future development of the fashion industry, particularly the integration of digital technologies and the fashion industry.
Methods
Research Framework and Procedure
User demands, which are scattered across multiple touchpoints throughout the usage process, serve as the foundation and core driver of virtual fitting application design. To efficiently incorporate user demands into the product design process, this study adopts a combined approach of Kano and QFD to scientifically categorize and rate user demands, visualizing the relationships between user requirements, design requirements, and design practices. As shown in Figure 1, the entire research flowchart illustrates the methodological structure of the study. The overall research is divided into three main parts: user demands analysis, design requirement transformation, and design requirement system construction. In the user demands acquisition phase, we first use Regional Operations Support Team Content Mining 6 (referred to as ROST CM6) software for word frequency analysis. Then, we employ panel interviews to precisely identify preliminary user demands. Next, we categorize user demands using the Kano model and rank them based on their importance weights. In the design requirement translation phase, we convert user demands into design requirements and use the QFD method to score and rank the correlation between user demands and design requirements. In the design requirement system construction phase, we establish a visual mapping of the relationship between design requirements and design practices. The technical methods used in each of these sections will be elaborated upon in subsequent sections.

Research flowchart.
Content Analysis Method
Content analysis is a research technique that involves the objective, systematic, and quantitative analysis of content. This method reveals hidden information within textual data, allowing for both descriptive analysis and empirical testing (Nurbaity et al., 2018). With the advancement in web technologies, various digital research platform tools have been developed, enhancing the efficiency of data retrieval, indexing, and analysis. This saves significant time, human, and material resources. Traditional methods of data analysis often suffer from incomplete data sources and insufficient sample sizes, leading to potentially biased product development guidance. To address this, our study utilizes the intelligent data analysis software ROST CM6. This software supports extensive processing of product evaluation texts, resulting in more scientific and comprehensive outcomes. ROST CM6 facilitates tasks such as sentence segmentation, high-frequency word statistics, sentiment analysis, and semantic network analysis.
The operational workflow, illustrated in Figure 2, includes extracting high-frequency words from online platforms like web pages, social media, and shopping apps. Through operations like word frequency statistics, cluster analysis, and semantic analysis, textual content can be subjected to quantitative analysis. Using ROST CM6, researchers can gain a deeper understanding of consumer opinions and sentiments, providing accurate insights for product development (Tao et al., 2021).

Flowchart of ROST CM6 software.
This paper primarily focuses on three mainstream Chinese social media platforms: Weibo, Xiaohongshu (Little Red Book), and Douban, using “virtual fitting” as the keyword for searches and filtering to gather data samples. Given the vast number of comments and variable text quality on these self-media social platforms, this study manually selected 412 effective evaluation texts. Before analyzing the content of these texts to enhance analysis efficiency and accuracy, the following preprocessing steps were taken: deleting content irrelevant to the topic, merging synonyms and near-synonyms, converting Word documents into text document format (.txt), and establishing custom dictionaries, filter lists, and high-frequency vocabulary lists. The preprocessed .txt documents were then segmented using word segmentation tools, followed by frequency analysis to identify high-frequency feature words.
Interviews and Coding Based on Grounded Theory
Grounded Theory is a widely used qualitative research method aimed at generating theories through systematic data collection and analysis (Glaser & Strauss, 2017). This method involves a dynamic interaction between researchers and the study materials within the context of the problem. It employs a three-tiered coding process—open coding, axial coding, and selective coding—to develop categories, subcategories, and core categories, along with their interrelations. Each of these coding stages serves a specific purpose: open coding for identifying initial categories, axial coding for finding connections between categories, and selective coding for refining these categories into a coherent theory.
The analytical process of Grounded Theory is clearly divided into three main steps, unfolding sequentially to ensure a thorough exploration and construction of the theory. The research flow of Grounded Theory, detailed in Figure 3, differs from confirmatory theoretical methods that start with hypotheses and then seek verification using existing theories. Instead, Grounded Theory requires researchers to continually compare and induce concepts from their interactions with the data, making it a constructive research method. Given its intrinsic characteristics, Grounded Theory is particularly suited for the task of extracting perceived quality attributes in this study. Through its constructive and inductive analytical processes, Grounded Theory can effectively address the limitations of traditional attribute extraction methods, helping to gain a deeper understanding of the complex relationships and dynamic changes underlying the data.
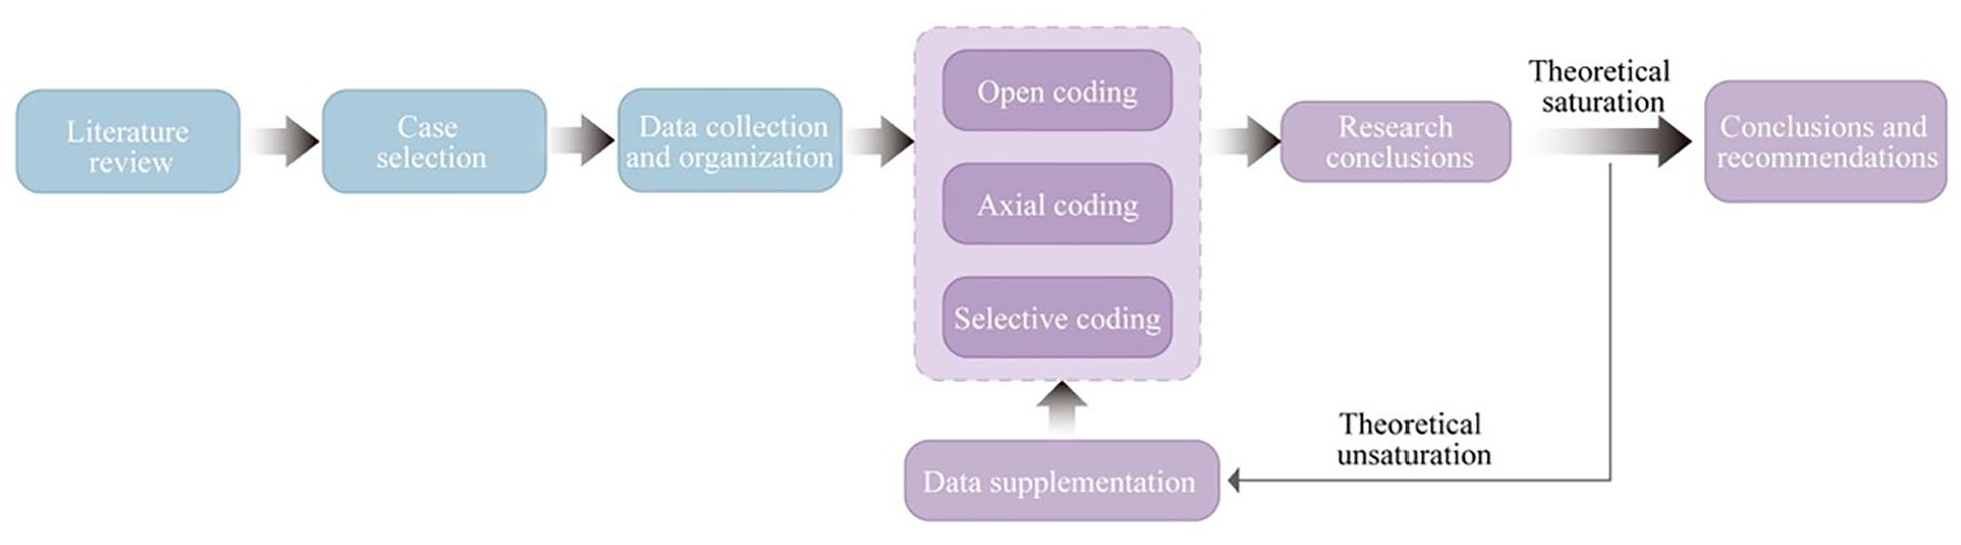
Main research flow of grounded theory.
This paper explores user demands through open-ended interviews. The participants included 20 experienced users of virtual fitting applications, consisting of 12 females and 8 males aged between 18 and 35. Details are provided in Table 1. The interviews were conducted by the authors, who acted as facilitators and note-takers. Each session included a discussion segment enriched with supplementary material from previous evaluation analysis results to enhance comprehensiveness. With participants’ consent, the interview content was recorded and transcribed into textual data.
Respondents’ Information.

Throughout the data collection process, the authors maintained an open approach to avoid biases that could restrict theoretical development. The study employed traditional manual coding methods. Open coding initially analyzed the raw data in detail, marking keywords or phrases to develop preliminary concepts. This phase involved a line-by-line analysis to identify, name, and categorize phenomena. Axial coding then logically connected these initial categories, exploring the relationships between main and subcategories, and classifying them based on their intrinsic relationships to ultimately form main categories. Finally, selective coding determined the core categories, integrating all major categories into a unified theme. This final step aimed to explain the main phenomena in the data and link other categories to support this core concept. The frequency of each user demand keyword, as a proportion of the total frequency, was recorded to indicate its initial importance.
Kano Model
The Kano two-dimensional quality model (Kano model), proposed by Japanese professor Noriaki Kano in 1984, is a commonly used method in the product and service design process. (Kano, 1984) Initially applied in the automobile manufacturing industry to optimize resource use and reduce production costs, the Kano model has been adopted in various fields due to its ability to shorten the design cycle, enhance quality, and increase customer satisfaction. The model identifies the nonlinear relationship between product performance and user satisfaction to uncover user demands. It is used for classifying and prioritizing user demands (Raharjo et al., 2010; Sauerwein et al., 1996). This provides a solid foundation for design decisions in this paper and offers directional support throughout the research process.
As illustrated in Figure 4, the Kano model categorizes user demands into five types of quality attributes. The horizontal axis represents the presence of quality attributes, and the vertical axis indicates the level of satisfaction. These five types of user demands are defined based on the relationship between the degree of quality presence and satisfaction. Must-be quality (M): These are the basic qualities that users expect to be present in a product. If these needs are unmet, it causes dissatisfaction among users. One-dimensional quality (O): Also known as performance quality, this type directly correlates with user satisfaction—the better the performance, the higher the satisfaction. Attractive quality (A): These are the qualities that, when met, significantly enhance user satisfaction. They are not expected by the users but have a strong positive impact on satisfaction when present; Indifferent quality (I): These qualities are neutral in terms of user satisfaction; users are indifferent to whether these attributes are present or not. Reverse quality (R): These are qualities that, when present, can lead to user dissatisfaction. Meeting these needs does not enhance satisfaction and may even detract from it.

Kano model of quality attributes.
To determine the Kano attributes for specific requirements, researchers use the dual-factor theory to design a set of survey questions that assess both positive and negative aspects of user demands (Berger et al., 1993). This approach involves creating a pair of contrasting questions for each product attribute in a survey. These questions measure user satisfaction levels when the product either includes or lacks a particular feature. Satisfaction is categorized into five levels: like, must be, neutral, live with, and dislike, where each level reflects a range of user responses to feature presence or absence. For each product feature, one question evaluates the customer’s reaction if the feature is present (functional form of the question), while the other assesses the reaction if it is absent (dysfunctional form of the question), as demonstrated in Table 2 (Sauerwein et al., 1996). By analyzing responses to both the positive and negative questions, researchers can classify the quality attributes of each item. They then aggregate the proportions of similar attributes to conclude the overall user preference and satisfaction (Juan et al., 2014).
Functional and Dysfunctional Questions in the Kano Questionnaire.

By combining the two responses from the evaluation table below, product features can be categorized. The matrix model is shown in Table 3.
Kano’s Evaluation Matrix.
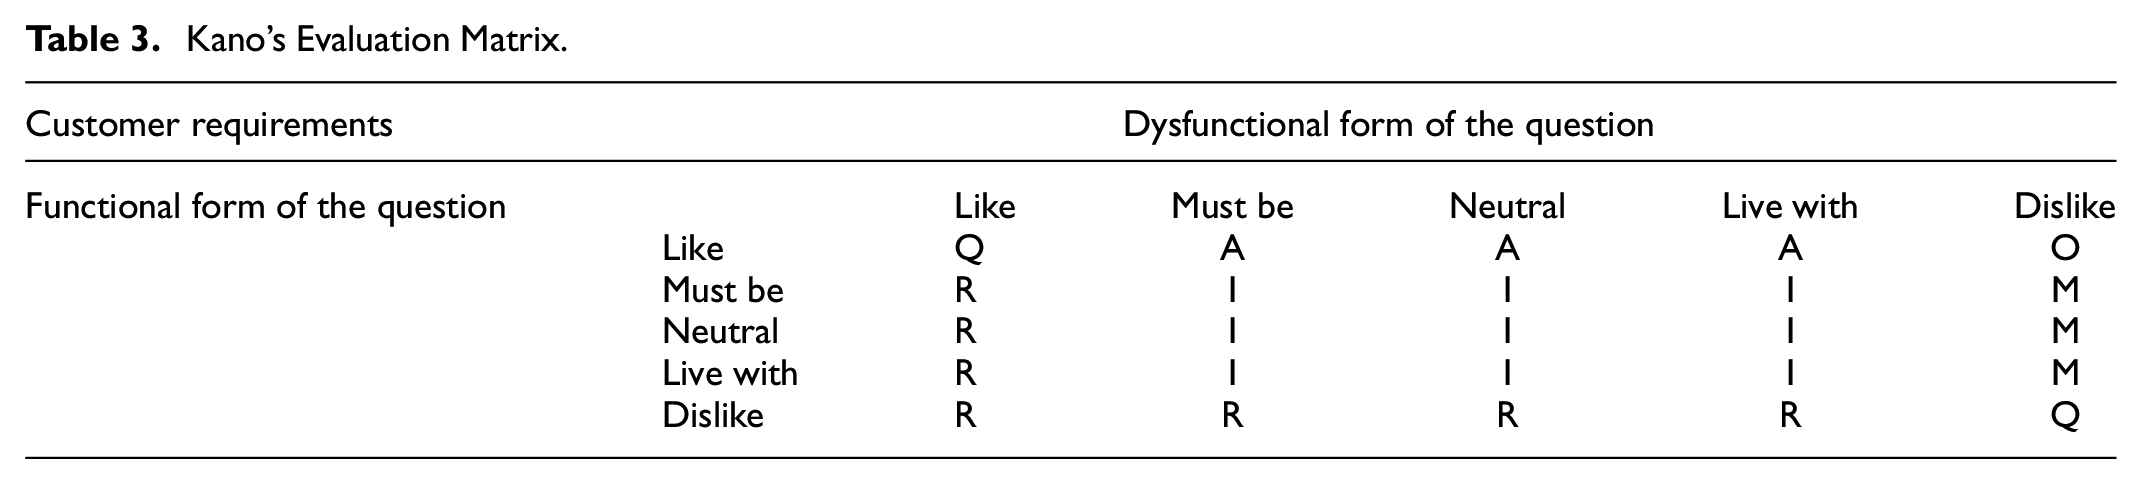
Different quality attributes have varying impacts on user satisfaction. For instance, meeting even a small portion of attractive quality demands can significantly enhance overall user satisfaction, whereas even minor deficiencies in must-be quality demands can lead to significant dissatisfaction. One-dimensional quality demands fall between these two extremes and also contribute to user satisfaction. Among these, one-dimensional and attractive quality demands are crucial for improving user satisfaction and will be retained, along with must-be quality demands. Conversely, indifferent and reverse quality demands, which do not contribute positively to user satisfaction, will be removed from the requirements system.
Quality Function Deployment (QFD)
Quality Function Deployment (QFD) is a systematic design analysis method that transforms user-required product or service qualities into corresponding engineering characteristics using the House of Quality (Akao, 1997). It adopts a multifaceted approach, encompassing user and market demands and technical aspects, to conduct quantitative analyses throughout the design and production phases. The goal is to pinpoint design requirements that maximally satisfy user demands, thereby optimizing user experience and increasing satisfaction (Chan & Wu, 2002). QFD plays a guiding role in the product development process and also helps resolve post-development issues. This method embeds user demands into every production phase, effectively summarized and communicated through data tables or matrices (Zhang et al., 2014). While the Kano model is effective in analyzing and prioritizing user demands, it does not translate these analyses into further actionable data. QFD, a quantitative method designed for demand analysis, quantifies user requirements into design specifications and accurately transforms them into product features, thus addressing the Kano model’s limitations. Therefore, this study employs a combination of Kano and QFD to more effectively quantify virtual fitting application user demands into concrete design requirements.
The core tool of Quality Function Deployment (QFD) is the House of Quality (HOQ). To more accurately transform user demands into actionable design solutions, the HOQ is used to analyze the relationship between user demands and design requirements. This analysis helps identify the technical specifications that most significantly impact user satisfaction, thus enabling efficient execution and ensuring that the designed product better aligns with user expectations (Tan & Shen, 2000). Within the HOQ, each module is broken down into different components, which together form the complex matrix structure of the HOQ, as illustrated in Figure 5.
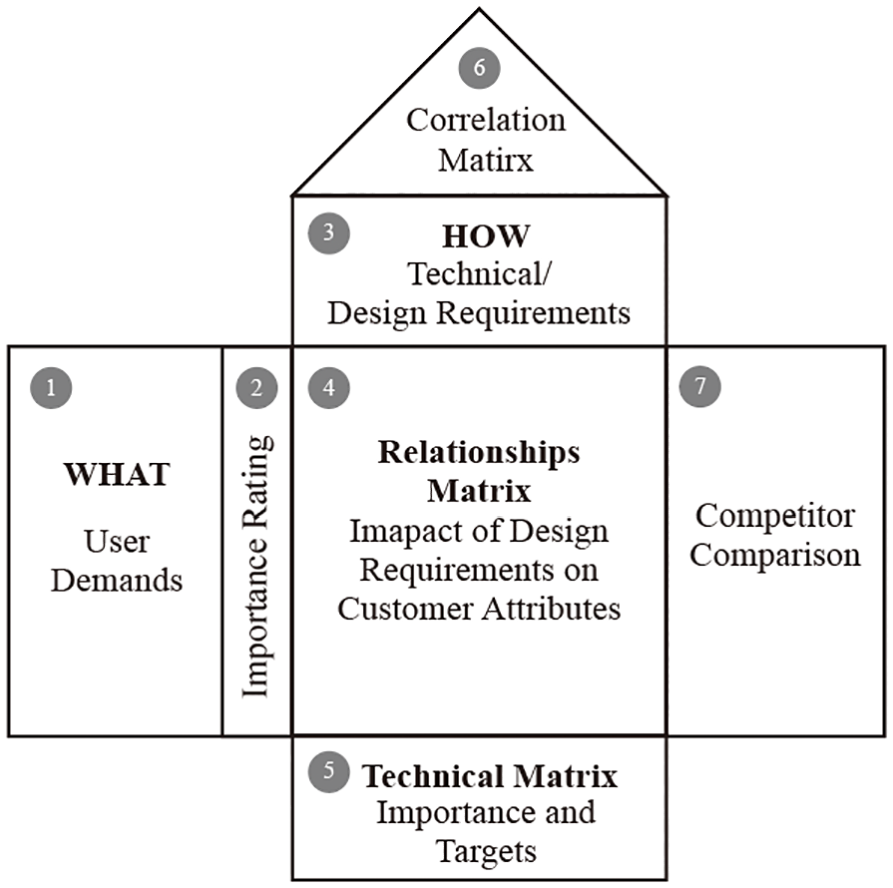
HOQ matrix.
The process of transforming user demands into design requirements using the House of Quality (HOQ) involves seven steps (Kürüm Varolgüneş et al., 2021): First, identify and analyze user demands, which involves establishing the left wall of the HOQ. Second, calculate the weights of these user demands. Third, construct the roof, which specifies the design requirements that should be met during the design and production stages. Fourth, establish the relationship matrix in the main body of the HOQ, determining the relationships and weight allocations between user demands and design requirements. Fifth, calculate the importance and prioritize the design requirements. Sixth, confirm the correlation matrix among the design requirements. Seventh, conduct competitive analysis and set objectives. HOQ is a problem-solving tool that is not limited to a single format; it can be adjusted based on the specific focus of the problem, resulting in various versions of HOQ. This research primarily focuses on theoretical methods in the product design and development phase and does not involve evaluating or comparing competitive products. Therefore, only the first six steps are mainly utilized. This study primarily focuses on the theoretical methods of product design and development stages and does not involve the evaluation and comparison of competitive products; therefore, it mainly utilizes the first six steps.
Results
Data Collection and Analyses
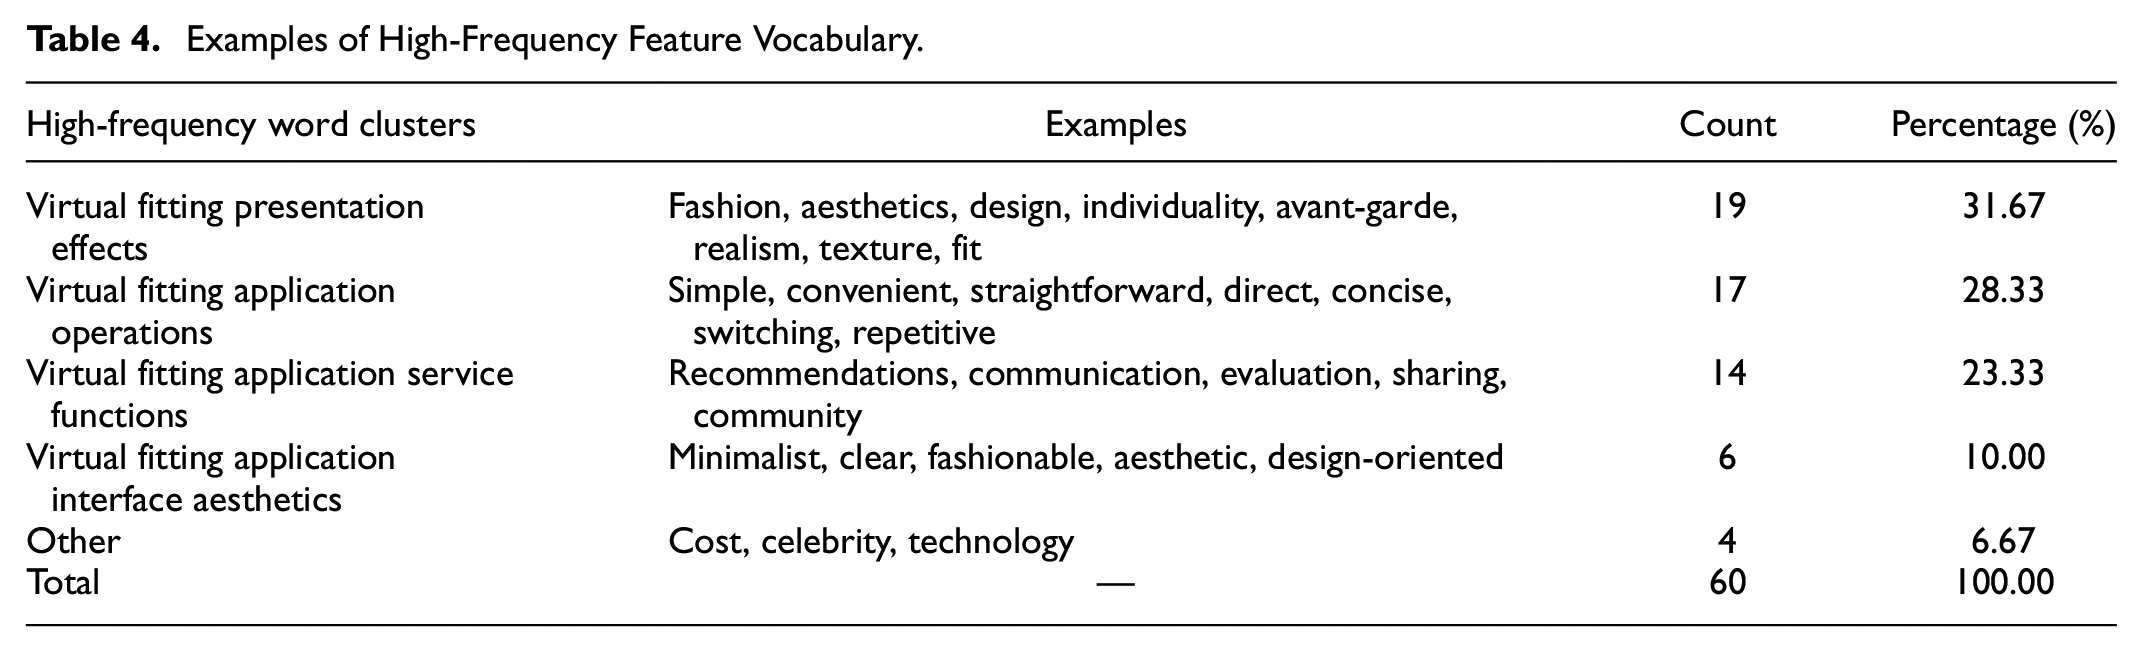
This study conducted a word frequency analysis on 412 valid evaluation texts using ROST CM6 software, identifying 60 high-frequency feature words for further analysis, as shown in Table 4. The most frequent feature words are related to the virtual fitting presentation effects, accounting for 31.67% of the total. The second most frequent are words related to the virtual fitting application operations, representing 28.33% of the total. The third category includes feature words related to the virtual fitting application service functions, comprising 23.33% of the total. The fourth category is words related to the virtual fitting application interface aesthetics, making up 10.00% of the total. This indicates that the visual presentation effects of virtual fitting applications are of primary concern to users, followed by operation and functionality, while aesthetic issues receive less attention.
Examples of High-Frequency Feature Vocabulary.
This article explores user demands through open-ended interviews and employs grounded theory methodology to code, measure, and analyze the textual data obtained previously. The initial importance of each demand is calculated based on the frequency of the corresponding demand words as a proportion of the total frequency of all recorded demand words. The analysis identified three primary user demands and sixteen secondary user demands, along with their corresponding word frequencies and initial importance, as shown in Table 5. The primary user demands identified through synonym clustering resonate with Donald A. Norman’s research on the instinctive, behavioral, and reflective layers of human brain activity in the field of user experience (Norman, 2003).
Word Frequency and Initial User Demands Importance.
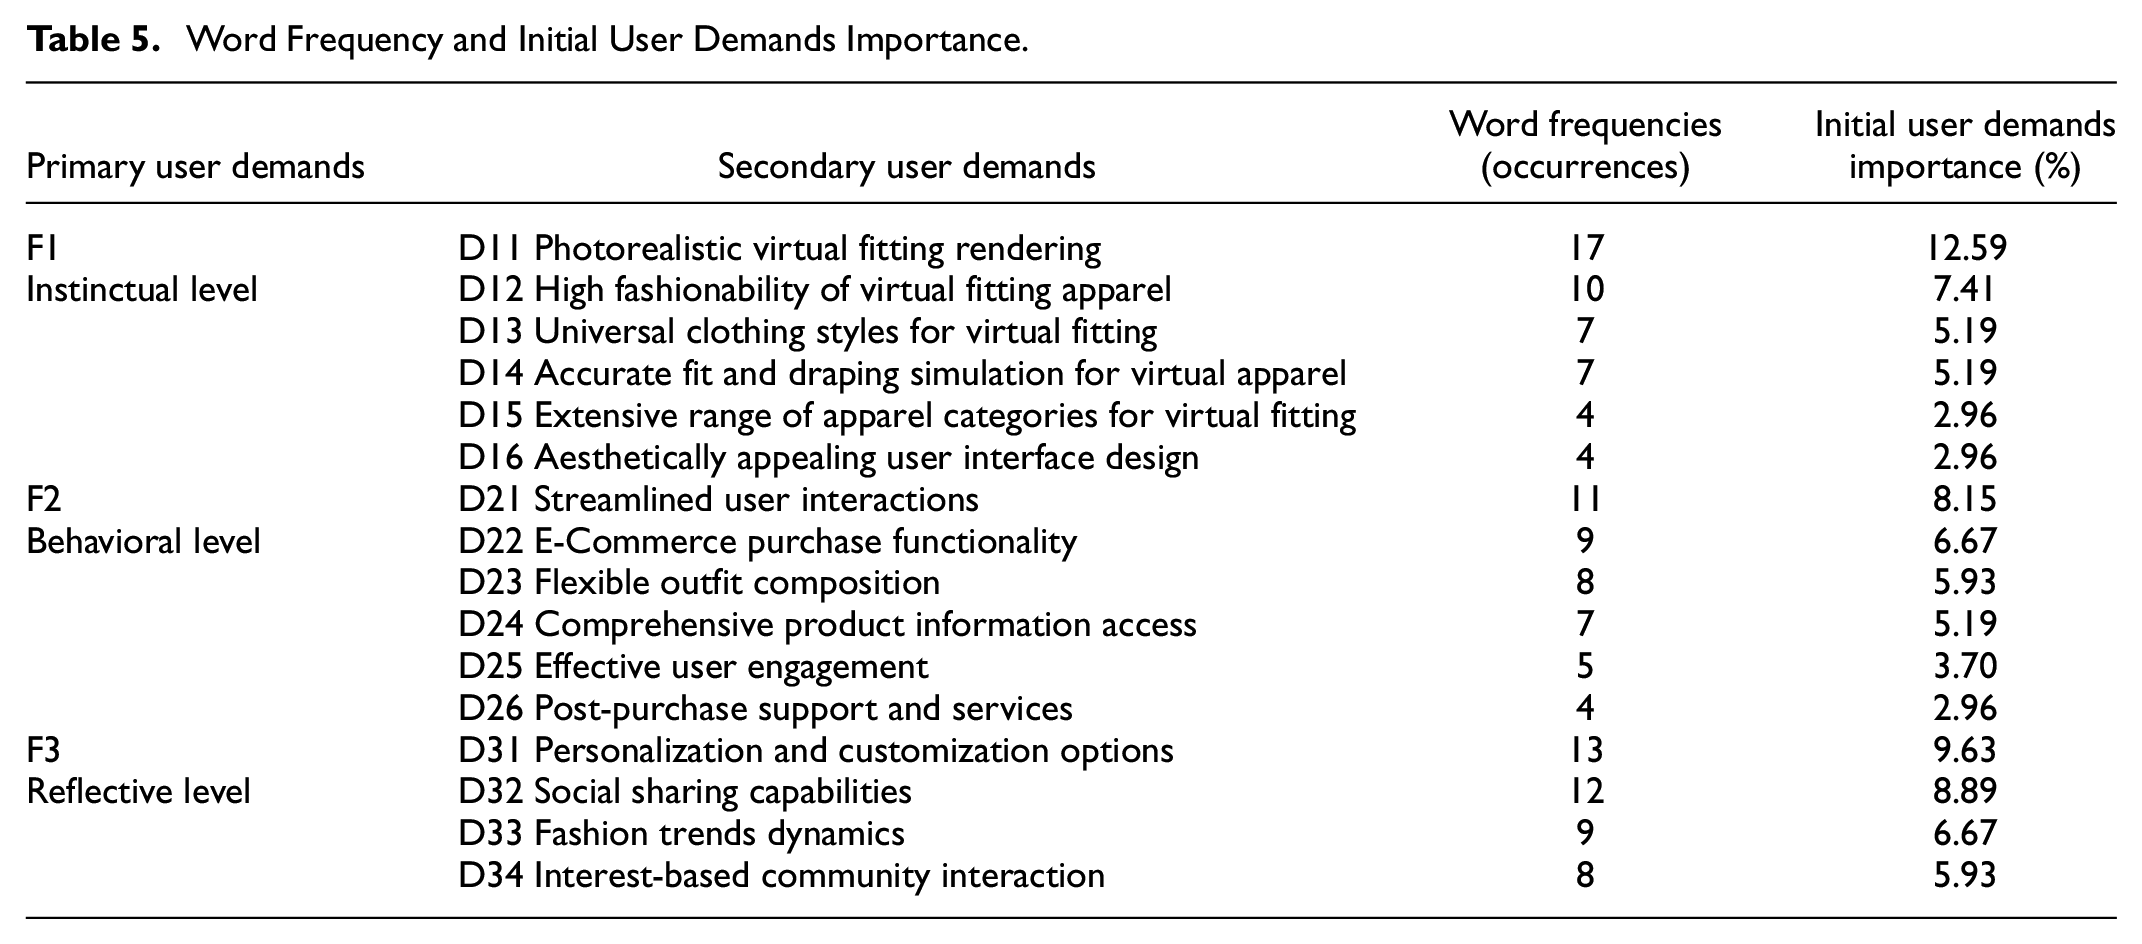
The word frequency of user demands is visualized as presented in Figure 6. Demands at the Instinctual level constitute the highest proportion, at 36.30%, with the top three frequencies being D11 photorealistic virtual fitting rendering, D12 high fashionability of virtual fitting apparel, and D13 universal clothing styles for virtual fitting. Following this, demands at the behavioral level account for 32.60%, with the top three frequencies being D21 streamlined user interactions, D22 e-commerce purchase functionality, and D23 flexible outfit composition. Finally, demands at the reflective level make up 31.12%, with the top three frequencies being D31 personalization and customization options, D32 social sharing capabilities, and D33 fashion trends dynamics.

The word frequency of user demands.
Kano Questionnaire and Demand Classification
The Kano model can scientifically categorize user demands and applies different adjustment coefficients, K, based on the category of the demand for calculation. Must-be quality user demands, which are basic service requirements, have a K value of 0.5. One-dimensional quality user demands, which are focal points of user interest, have a K value of 1. Attractive quality user demands, known for efficiently satisfying user satisfaction, have a K value of 1.5. The final importance of user demands is calculated by the proportion of the product of the initial importance of the user demand and the corresponding K value to the sum of all such products.
This study utilized a mixed-methods approach to surveys, combining electronic and paper-based questionnaires. A total of 78 Kano questionnaires, both positive and negative, were distributed, out of which 63 were valid. The survey results were categorized and organized using the Kano matrix, as introduced earlier and shown in Table 2. The calculation of the final importance of demands is presented in Table 6.
Classification and Rating Adjustment of User Demands.

Note. Must-be quality(M), One-dimensional quality(O), Attractive quality(A), Indifferent quality(I).
According to the survey results, user demands for virtual fitting applications have been categorized into the following four types.
Must-be quality user demands (M): Three items have been categorized as Must-be quality demands: D14 accurate fit and draping simulation for virtual apparel, D21 streamlined user interactions, and D25 effective user engagement. these demands are essential for virtual fitting applications. Failure to meet these demands—such as poor fit, cumbersome operations, or lack of good interaction—can lead to user dissatisfaction, complaints, or even grievances.
One-dimensional quality user demands (O): Five items have been categorized as One-dimensional quality demands: D11 photorealistic fitting effects, D15 extensive range of apparel categories for virtual fitting, D16 aesthetically appealing user interface design, D32 social sharing capabilities, and D22 e-commerce purchase functionality. For virtual fitting applications, which essentially help users efficiently browse and try on different styles of clothing, meeting these sharing and shopping demands is an effective way to achieve higher user satisfaction.
Attractive quality user demands (A): Seven items have been categorized as Attractive quality demands: D12 high fashionability of virtual fitting apparel, D13 universal clothing styles for virtual fitting, D23 flexible outfit composition, D31 personalization and customization options, D34 interest-based community interaction, D24 comprehensive product information access, and D26 post-purchase support and services. These demands reflect users’ greatest concerns, such as the style of clothes they try on, the ability to customize personal images, and the opportunity to share and interact within community groups. These are the demands that most captivate users’ attention and are easiest to satisfy, thus they should be a focal point in further research.
Indifferent quality user demands (I): One item has been categorized as an Indifferent quality demand: D33 fashion trends dynamics. This reflects users’ indifference to having information updates as a feature, indicating that during the use of virtual fitting applications, whether there are updates or not does not impact their experience.
QFD Analyses and HOQ Construction
This study employs the Quality Function Deployment (QFD) method to analyze the relationships between user demands and design requirements, with the aim of constructing a system of design requirements for virtual fitting applications. Through market research and analysis of virtual fitting applications, corresponding design requirements are deduced to meet user demands, as shown in Table 7. The relationship between user demands and design requirements may not always correspond numerically; based on actual circumstances, some consolidation and splitting may occur.
Interpretation of Design Requirements for User Demands.

The user demands for the virtual fitting application obtained through the Kano model are entered into the left wall of the House of Quality (HOQ), with the corresponding design requirements entered into the roof. The roof represents the correlation matrix, and the prioritized design requirement scores are recorded in the basement. The relevance between each set of user demands and design requirements is rated and scored by an evaluation team (Işık et al., 2012). The evaluation team consists of three senior developers of the virtual fitting application, who rate the relevance. The relevance between user demands and design requirements is classified into four levels: strong relevant, moderate relevant, weak relevant, and none, scored as 5, 3, 1, and 0, respectively (Wu et al., 2018). In the table, the strong, moderate, and weak levels are represented by the symbols ⊚, ○, and △, respectively, while elements deemed irrelevant are left blank. The importance of the design requirements is calculated as the sum of the products of the final importance of each user demand and its corresponding relevance score. The correlation between design requirements is rated on a five-point scale: strong positive relationship, positive relationship, none, negative relationship, and strong negative relationship. These are represented in the table by the symbols ++,+, -, and –, respectively, with no symbol for elements considered to have no relationship. The complete HOQ is shown in Figure 7.

HOQ matrix of virtual fitting application.
Construction of Design Requirement Framework for Virtual Fitting Applications
Using the QFD analysis method, this study developed a system of design requirements for a virtual fitting application and prioritized them by importance. The study draws on Norman’s theory of the three aspects of design: visual, interaction, and emotional ( Norman, 2003). It also considers multiple factors, including the direct impact of each design requirement on user experience, the technical feasibility of implementation, and market research results. These considerations ensure the scientific and practical classification of design requirements into three main types: visual design, emotional design, and interactive design, as shown in Figure 8. In the context of limited resources, designers should prioritize critical design requirements and those with higher importance weights. This study categorizes design requirements by importance weight into core design requirements, secondary core design requirements, and peripheral core design requirements.

Design requirements mapping relationship.
The top eight design requirements, ranked by importance, are defined as core design requirements and should be prioritized in the design process. These are F22 personal image customization, F3 extensive accumulation of apparel model libraries, F24 brand fan engagement, F25 fashion influencer interaction, F7 apparel matching algorithm technology, F1 3D flexible simulation modeling and rendering, F16 preference-based outfit recommendations, F15 in-store pickup.
Design requirements ranked from ninth to sixteenth are defined as secondary core design requirements. These should be considered as the second tier and incorporated into the design practice as resources allow. These include F2 realistic digital fabric rendering effects, F4 real-time updates of latest apparel models, F23 sharing of virtual fitting images, F14 online retail store, F18 fashion trend updates, F17 product review provision, F21 streamlined returns and exchanges, and F8 wide range of virtual fitting categories.
The remaining nine design requirements are defined as peripheral core design requirements and can be considered as references to be appropriately reflected in the design practice. These are F9 apparel aligning with mainstream aesthetic preferences, F6 customizable avatar body dimensions, F12 minimalist user interface design, F10 aesthetically pleasing system interface design, F13 clear and instructive user guidance, F19 dynamic interaction design, F11 stylized and well-designed icons, and F20 static interaction design.
Figure 8 shows the relationship between the design requirements for the virtual fitting application and the aspects of visual design, emotional design, and interactive design. From the figure, it can be seen that in terms of visual design for the virtual fitting application, the top-ranked requirements are personal image customization (ranked first), extensive accumulation of apparel model libraries (ranked second), and apparel matching algorithm technology (ranked fifth). This reflects that users’ design requirements for visual design are mainly focused on the presentation effects of the models in the virtual fitting application. Requirements like aesthetically pleasing system interface design (ranked twenty-first) and stylized and well-designed icons (twenty-fourth) are not highly prioritized in interface design. In the aspect of emotional design for the virtual fitting application, most design requirements are either core or secondary core requirements, indicating that users have a strong demand for emotional design. Especially important are personal image customization (ranked first), brand fan engagement (ranked third), and fashion influencer interaction (ranked fourth), which emphasize individuality and the desire for interaction and sharing. In terms of interactive design for the virtual fitting application, the top-ranked requirements are preference-based outfit recommendations (ranked seventh) and in-store pickup (ranked eighth). Most other design requirements in this aspect are peripheral core requirements.
Discussion
The results of this study indicate that among the various design requirements for virtual fitting applications, visual design requirements receive the highest attention. The top-ranked requirement, personal image customization, is critical across multiple design aspects, including visual and emotional design. This feature allows users to create detailed virtual avatars based on actual measurements, providing a personalized fitting experience, significantly enhancing user engagement and satisfaction, and aligning with other scholars’ findings (Lau & Ki, 2021). Users expect their virtual avatars to closely resemble their real or ideal selves. Therefore, the accuracy of data input (e.g., size, body shape) and its technical implementation is crucial, as highlighted by Buyukaslan et al. (2020). However, ensuring privacy and data security remains a challenge, crucial for user trust and technology acceptance, warranting further study (Karlsson & Skarin, 2023; Wissinger, 2020).
The second-ranked requirement, extensive accumulation of apparel model libraries, along with the fifth-ranked apparel matching algorithm technology and the sixth-ranked 3D flexible simulation modeling and rendering, constitute three additional core design requirements in the visual design aspect. The diversity and quality of clothing models in the application directly affect the range of clothing that users can realistically visualize and try on. For retailers, the challenge lies in accurately maintaining the texture, color, and drape of fabrics in digital form, thereby creating a rich sensory experience through more accurate product visuals. This viewpoint is also emphasized by Bulović and Čović in their 2020 study (Bulović & Čović, 2020). Advances in machine learning and AI have led to more precise predictive models, enhancing 3D effects. For example, Wang et al. developed virtual fitting technology using physical simulation and neural networks to predict fit, mobility, and appearance on different body shapes (Wang et al., 2023). These advancements enhance the realism of virtual fitting and are crucial for adaptive recommendations based on users’ body shapes and style preferences.
Unlike previous research, this study found that users place significant importance on interaction and sharing. Emotional design requirements are mainly core and secondary core, indicating high user expectations for emotional design in virtual fitting applications. The high rankings of brand fan engagement and fashion influencer interaction show that users value participation, entertainment, and interaction alongside shopping and fitting experiences (Arnold & Reynolds, 2003). Brand fan engagement reflects users’ loyalty to specific brands, expressing their identity and values, as noted by Ho Lee and Jung (2018). Fashion influencer interaction involves discussing fashion trends, allowing users to showcase their fashion views and seek recognition and inspiration from the community (Lau & Ki, 2021). These needs highlight that virtual fitting applications are not just tools but also platforms for social interaction and self-expression. Future designs should integrate these emotional design elements, offering more customization options, enhancing social features, and optimizing recommendation systems to provide a personalized and engaging social experience.
In terms of interactive design, user expectations are more varied. Preference-based outfit recommendations and in-store pickup are ranked seventh and eighth, showing that some users highly value these features. Preference-based recommendations save users time and provide personalized shopping suggestions, enhancing convenience and efficiency. This can be optimized through detailed user data analysis and machine learning, as discussed by Ornati et al. (2022). In-store pickup reflects a preference for an online-to-offline shopping model, allowing users to try on and purchase clothes in physical stores after virtual fitting. This feature enhances shopping flexibility and offers retailers opportunities to increase in-store traffic and customer satisfaction. Overall, most interaction design requirements are peripheral, indicating that while users have specific needs for certain features, they are less focused on interaction design compared to visual and emotional design. Users prefer intuitive operation and reasonable functionality over complex or innovative interactive design.
Conclusions
This study adopts a combined Kano and QFD approach to scientifically classify and rate user demands for virtual fitting applications, exploring the transformation of user demands into corresponding design requirements. First, we conducted a word frequency analysis using the ROST CM6 software, identifying initial user demands through grounded theory-based interviews and coding. Next, we categorized these demands using the Kano model and prioritized them by importance, resulting in 15 user demands. Finally, using the QFD method, we translated these user demands into 25 corresponding design requirements, which were classified and prioritized into core, secondary core, and peripheral core design requirements. These were further categorized into visual design, emotional design, and interaction design. The results indicate that most of the highly prioritized design requirements pertain to visual design, followed by emotional design, and lastly interactive design. This suggests that future theoretical research should prioritize visual and emotional design aspects. Unlike previous studies, our findings highlight that community interaction and sharing are also key user concerns. The virtual fitting application, beyond its primary function of fitting and shopping, can serve as a social medium, providing emotional value by acting as a platform for communication between fashion enthusiasts, brands, and influencers. This opens up new research directions and perspectives in this field.
In terms of theoretical research, this study addresses the gap in virtual fitting application research centered on user demands, introducing big data and intelligent data analysis methods innovatively. Traditional user demand identification primarily relies on market surveys and user interviews, which may be subjective. By combining intelligent data analysis with the Kano-QFD quantitative method, we deeply and accurately excavate and rank user demands, making the design process of virtual fitting applications more efficient and precise. This insight extends future research directions. In practical design, this study employs a mixed qualitative and quantitative approach to clarify the core, secondary core, and peripheral core design requirements in visual design, emotional design, and interactive design, ensuring objectivity and effectiveness in design implementation. It is worth noting that although all user demands must initially be addressed, the actual implementation depends on resource integration and allocation, prioritizing higher-importance requirements. Therefore, this study offers substantial guidance for designers in prioritizing and allocating resources in the design practice of virtual fitting applications and provides crucial references for their practical application and development.
Limitations and Future Research
This study has certain limitations. Firstly, the use of ROST CM6 software for word frequency analysis and grounded theory interviews, while scientifically and systematically sound, may still be limited by the specific groups or user segments from which the data were sourced. This could affect the general applicability and universality of the research findings. For example, if the sample mainly comes from urban areas, it may not fully represent the demands of users from rural areas or those with different cultural backgrounds. Secondly, in conducting the QFD analyses, we used three experienced developers for scoring due to practical constraints. This small expert team may not adequately represent the entire designer community, thus limiting the method’s effectiveness in evaluating the actual design demands for virtual fitting applications. The scoring may overly rely on the individual judgments of these specific experts, lacking broader industry consensus.
Considering these limitations and research opportunities, we propose several suggestions for future research on virtual fitting applications. First, expand the geographic and demographic scope of data collection to enhance the general applicability of the findings. Second, increase the number and diversity of designers and developers involved in the QFD analysis. Including experts from different professional backgrounds and experience levels can ensure more comprehensive evaluation results. Future research should emphasize the objectivity of each operation and the representativeness of the population. Third, regularly reassess and update user demands based on dynamic changes in user needs and technology. This can be achieved by establishing a continuous user feedback mechanism. These measures will help improve the quality and practical value of future research, better meeting user needs and expectations.
Footnotes
Acknowledgements
None.
Author Contributions
Yudian Zhang, developed the initial research idea and framework. collected data, and maintained data records. Additionally, She analyzed the data and interpreted the results, wrote the initial draft of the manuscript, and created figures and tables for the manuscript.
Zeyu Zheng, contributed to the development of the research methodology and assisted in data validation and verification. Also provided critical revisions and edits to the manuscript and conducted a comprehensive review of relevant literature.
Lixian Liu, supervised the entire research project and provided guidance throughout. Lixian Liu secured funding and resources necessary for the research, reviewed and edited the manuscript to ensure it met publication standards, and acted as the primary contact for editorial correspondence and inquiries.
Declaration of Conflicting Interests
The author(s) declared no potential conflicts of interest with respect to the research, authorship, and/or publication of this article.
Funding
The author(s) disclosed receipt of the following financial support for the research, authorship, and/or publication of this article: This work was supported by the Central Guidance on Local Science and Technology Development Fund of Zhejiang Province [Grant No. 2023ZY1029], Hangzhou Major Scientific and Technological Innovation Project [Grant No. 2022AIZD0153].
Data Availability Statement
Data sharing not applicable to this article as no datasets were generated or analyzed during the current study.