
Abstract
Industrial system modernization is an important part of achieving high-quality development, an internal requirement for promoting the process of Chinese modernization. Based on the data of 30 provinces in China from 2011 to 2022, the spatial-temporal characteristics of industrial system modernization level (ISML) as well as the complexity and stability of its spatial correlation network and influencing factors are revealed through the fixed base difference entropy weight method, gravity model, and social network analysis. The results show that: (1) In China, ISML in the whole country as well as various provinces has been increasing year by year, and there are obvious differences of inter-provincial ISML. (2) The spatial correlation effect of ISML overcame geographical proximity constraint, forming a relatively stable, complex, and multicenter spatial correlation network that radiates across the country. Moreover, the stronger the network connection, the higher the corresponding ISML. And the connectivity strength and density of the network displayed in different regions, as well as the connectivity number and strength that can be formed in different provinces, are all related to ISML. (3) The influence of geographical proximity on the formation for spatial correlation network of ISML is not significant; the impact and significance of carbon emission efficiency difference on that have gradually decreased; and the impact of technological innovation difference has the significant positive impact on that. Our results offer important insights for comprehensively building a modernized industrial system and promoting national modernization construction.
Keywords
Introduction
Modernized industrial system is the material and technological foundation of a modernized country. Since the 18th National Congress of the Communist Party of China (CPC), China has attached great importance to the construction of modernized industrial system in responding to the “unprecedented changes in the world” and achieving the “comprehensive promotion of the great rejuvenation of the Chinese nation through China’s modernization” (CPC News Network, 2024). In October 2022, the report of the 20th National Congress of the CPC stated that the construction of modernized industrial system is a realistic choice to explore the road of Chinese modernization, and industrial system modernization is the core of modernization. Without industrial system modernization, there would be no economic modernization, and no possibility to achieve national modernization. It is imperative to enhance China’s industrial system modernization level (ISML) (CGTN, 2026a). Thereafter, China’s various policy documents and important conferences in 2022, 2023, 2024, and 2025 all highlighted the important role of improving ISML, simultaneously placed the construction of an system with networked characteristics led by strategic emerging industries, with the real economy as the main body, industrial clusters as the carrier and industrial chains as the link, in a key position (CGTN, 2024, 2026b).
Industry is the foundation of economic development, and its modernization has a profound impact on the development and prosperity of a country. Historically, modernization has led to major changes in many countries around the world. The technological revolution triggered the industrial revolution, allowing Britain to seize the opportunity of economic modernization and become the first country in the world to achieve modernization. After World War II, Germany abandoned its militaristic tradition, embarked on the path of peaceful development, seized the opportunity of the second industrial revolution, and relied on its talent, technology and industrial foundation, and then gradually became a modern developed country. In the mid to late 19th century, United States underwent significant changes in agriculture, industry and others, especially by leading the Second and the Third Technological Revolutions after World War II, rapidly rising to become the world’s largest power. As the earliest Asian country to enter the modernization process, Japan has shown strong autonomy and openness to modernization development, and has once become an industrial powerhouse in Asia surpassing European countries (Wei & Xiao, 2020). Modernization is a systematic project involving politics, economy, technology, culture, and society, but history has shown us that the modernization of these countries is fundamentally driven by the industrial revolution. Currently, China has the most complete industrial system in the world, with a production volume of over 220 industrial products ranking first in the world, and is one of the countries with the most complete industrial categories worldwide. However, China has a vast territory and a large population, with significant differences in resource endowments and industrial development among different regions. Geographically, from west to east, the proportion of the output value of the secondary and tertiary industries in GDP and the degree of industrial homogenization are gradually increasing, while the strength of industrial clusters and their ability to drive economic development are gradually weakening (National Bureau of Statistics, 2024). Although in order to avoid redundant construction, homogeneous development and resource mismatch in the industrial field, the eastern region focuses on the development of high-end manufacturing, modern service industries and green economy, the central and western regions take characteristic industrial clusters as the starting point, to continuously improve the display and influence of their unique industrial system in the country, as well as the connection and integration with other regions’ industrial systems, thus forming a complex network connection of modernized industrial system (Qiushi, 2025). But this has not significantly improved ISML as a whole in China, nor has it fundamentally enabled various regions to enjoy the win-win benefits brought by cooperation in ISML (Han & Deng, 2025). In this situation, blindly taking action can lead to resource waste, element mismatch and others, making it very difficult to build a modernized industrial system. Therefore, it is necessary to conduct scientific research on China’s ISML, correctly understand and grasp the challenges and opportunities provided by its spatial correlation network, and effectively improve ISML.
Industrial system modernization supports the modernization of everything else, and the industry here should be a broad industry. Starting from this broad meaning, we find that industrial system modernization has evolved from industrial modernization, and related research mainly focuses on the following aspects.
First, in terms of connotation and characteristics, scholars suggested that industrial modernization is a comprehensive concept. And industrial modernization have a more progressive meaning than traditional industrial sector modernization, especially in innovation and invention, industrial policy integration and intelligent specialization (Foray, 2018; Melanie et al., 2021). In China, the concept of “modern industrial system” was first proposed at the 17th National Congress of the CPC (CGTN, 2026a), then the report of the 20th National Congress of the CPC first proposed the new concept of “modernized industrial system” and the new task of “building a modernized industrial system” (CGTN, 2026a). Following this report, many scholars, considering China’s national conditions, the connotation of Chinese modernization, and the development problems in the new era, suggested that modernized industrial system is based on the five development concepts of innovation, coordination, green, openness, and sharing, with core characteristics of efficient resource utilization, efficient environmental protection, innovation-driven development and improving global competitiveness. In other words, modernized industrial system is a comprehensive system that integrates intelligence, innovation, specialization, and greening, can promote the transformation of traditional industrial system in terms of structure, organization, technology, finance and policy, and adapt to the current and future development of China as a sustainable industrial system (Ding et al., 2024; Wang, 2023).
Second, in terms of indicator construction and measurement, the academic community has evaluated and analyzed the modernization of specific or overall industrial fields or systems in countries or regions such as Kuzbass, Mexico, European Union, and China (Diego et al., 2021; Kulpina et al., 2020; Melanie et al., 2021; Pan, 2021). For China, previous research mainly constructs an indicator system for measuring ISML according to the four elements of real economy, technological innovation, modern finance, and human capital proposed in the report of the 19th National Congress of the CPC (CGTN, 2026a), and the measurement method usually adopts weighting methods such as entropy method, vertical and horizontal scatter degree method. Of course, there are also studies from other perspectives. Chen (2015) constructed the index system from seven dimensions of agglomeration, coordination, innovation, integration, openness, support, and ecology, while Han and Deng (2025) selected indicators from three dimensions of industrial structure upgrading, industrial structure rationalization, and industrial factor coordination, to evaluate China’s ISML. Ding et al. (2024) used the ultra-efficiency SBM model to measure the green total factor productivity to evaluate the level of Chinese-style industrial modernization.
Thirdly, regarding the influencing factors, prior research suggested that blue finance supports (Sun et al., 2022), cyberthreats (Krundyshev, 2019), digital technology (Ding et al., 2024; Shi, 2022), smart specialization strategies (Foray, 2018), ecological development (Michał, 2018), and others can affect the construction of modernized industrial system. And technological innovation, regional gap, and others are important elements for improving China’s ISML (CGTN, 2026b; Qiushi, 2025). In addition, some scholars also discuss this from specific fields, such as industrial chain modernization (Xiao et al., 2023), industrial structure modernization, and others. Especially some scholars argued that the core of industrial modernization is “industrial structure modernization,” and showed that technology scale (Raúl, 2022), digital economy (Xiong et al., 2023), and other factors have a significant effect on industrial structure modernization level.
Through the above analysis, it is found that there are abundant studies on “modernized industrial system” or “industrial system modernization,” but they ignore China’s rapidly changing nature of industrial system modernization and unique regional linkage relationship. Overall, there is a lack of analysis in dynamic characteristics and phased achievements in the process of industrial modernization construction as well as research results that proposes construction paths and development directions in a targeted and focused manner. Furthermore, there has been almost no research on ISML and its influencing factors from the perspective of spatial correlation network. In view of this, we take China as a research area and construct a comprehensive evaluation system from industrial high-end, industrial digitalization, industrial security, industrial openness level, advanced industrial foundation, and industrial ecology, and use fixed base difference entropy weight method to calculate the index of measuring ISML. Then, gravity model, social network analysis, and others are used to study ISML’s the characteristics and spatial correlation network, as well as influencing factors under a complex network. Our aim is to provide an objective reference for accurately and comprehensively promoting ISML, laying important foundation for promoting the construction of modernized industrial system and the process of Chinese modernization, as well as achieving high-quality economic development.
Materials and Methods
Data Source
According to three principles of data availability, feasibility, and effectiveness, the macro data of 30 provinces (municipalities or regions excluding Tibet, Hong Kong, Macao, and Taiwan) in China from 2011 to 2022 are selected to study the modernization level of China’s industrial system (note: unless otherwise specified, the provinces mentioned in the following context all refer to those 30 provinces). All original data are collected based on the China Statistical Yearbook, statistical yearbooks of various provinces, China Science and Technology Statistical Yearbook, China Environmental Statistical Yearbook, as well as National Bureau of Statistics.
Measurement of ISML
Construction of Index System
Industrial system modernization has some important characteristics such as innovation drive, integrated development, structural optimization, green intelligence, safety and controllability, high-level openness, strong competitiveness, and good benefits. It can not only continuously promote the advancement of industrial foundation, the rationalization of industrial structure, the modernization of industrial chain as well as integrated development of digital and real economy, but also provide good conditions for achieving coordinated promotion between high-quality economic development and efficient ecological protection.
Based on this understanding, and in combination with a series of work requirements for China’s development, such as optimizing the industrial structure, promoting the development of strategic emerging industry integration cluster, building a digital industrial cluster with core competitiveness, and tamping infrastructure deployed (CGTN, 2026a, 2026b), we build an index system of ISML (Table 1). This not only considers the adjustment of industrial structure, digital economy, and other development drivers, but also takes into account of security issues, environmental protection, opening up to the outside world, and infrastructure development needs.
Index system for measuring ISML.

Note: if the content in column 4 is repeated in column 3 of the table, it can be represented as - in column 4.
Fixed Base Difference Entropy Weight Method
Considering the rationality, accuracy, and availability of weighting results, a fixed base difference entropy weight method (Wang et al., 2021) is adopted to measure China’s ISML. The fixed base difference entropy weight method is a combination of entropy weight method and fixed base difference method, which is a relatively objective weighting method. It can not only avoid subjective influence to ensure the scientific and effective weighting, but also effectively achieve the comparability for measurement results in the dual dimensions of time and space as well as dynamic changes, and also prevent weighting errors caused by significant differences in time length and the number of spatial units. The specific steps are as follows:
Step 1: To standardize the original data.


Formulas (1) and (2) respectively perform dimensionless standardization on tertiary indicators with positive and negative attributes in Table 1; t represents year, i denotes provinces, and j stands for specific indicator; Xtij is the original data of indicator j in province i, while max{Xt1j,…, Xtnj} and min{Xt1j,…, Xtnj} are the maximum and minimum values of Xtij, respectively; Ytij is the standardized value of indicator j in province i.
Step 2: To calculate the indicator proportion.

Where Ptij is the specific proportion, and if Ptij = 0, then lim(Ytij→0) Ptij × ln(Ptij) = 0 is defined.
Step 3: To obtain the information entropy.

Where Ej represents the information entropy of indicator j, and n stands for the product of the length of time and the number of provinces.
Step 4: To determine the weight.

Where Wj is the weight of indicator j, as shown in the last column of Table 1; K denotes the total number of indicators.
Step 5: To process original data.

Where Xtj is the original data of indicator j in year t, whereas max(X2011j) and min(X2011j) are the maximum and minimum values of indicator j in the base year, respectively; Ztj is the data of indicator j in year t after being processed by the fixed base difference method.
Step 6: To determine the evaluation index.

Where A is the comprehensive evaluation index of ISML. The higher its value, the higher the ISML.
Formation Premise for Spatial Correlation Network of ISML
Dagum Gini Coefficient and Decomposition Method
In China, regional differences are the foundation for forming spatial connections. This difference provides an original driving force for trans-regional flow of various factors, and improves resource circulation level, strengthens network connections and others for building a industrial system through human flow, logistics, capital flow, information flow, and other carriers. And as mentioned earlier, to some extent, spatial correlation network of ISML already exists. However, due to currently no clear research on this point, we refer to the researches of Wei and Miao (2023), Ma et al. (2022) as well as Zhou et al. (2022), and use Dagum Gini coefficient and its decomposition method for quantitative confirmation to investigate whether China’s ISML can form spatial network connection and its formation is scientific. This method is a core tool for analyzing regional differences through overall, inner-regional and inter-regional Gini coefficients, as well as inner-regional, inter-regional, and hypervariable density contribution degrees (Dagum, 1997; Mussard & Richard, 2012; Zhang et al., 2022). Due to word count limitations, we will not elaborate too much on this mature method. Please refer to the literature mentioned above for specific steps. The only difference lies in the first step, as this paper divides China’s 30 provinces into four regions: east, central, west, and northeast, according to the classification standard of National Bureau of Statistics (National Bureau of Statistics, 2021). Namely, Beijing, Tianjin, Hebei, Shanghai, Jiangsu, Zhejiang, Fujian, Shandong, Guangdong, and Hainan in the eastern region; Shanxi, Anhui, Jiangxi, Henan, Hubei and Hunan in the central region; Chongqing, Sichuan, Guizhou, Yunnan, Shaanxi, Gansu, Qinghai, Ningxia, Guangxi, Inner Mongolia, and Xinjiang in the western region; and Jilin, Liaoning, Heilongjiang in the northeast region.
Formation Mechanism of Spatial Correlation
If the method presented in section “Dagum Gini Coefficient and Decomposition Method” demonstrates the results we envision, then subsequent analysis should be based on this network. Modernized industrial system with networked characteristics is essentially a complex system of points, lines and surfaces formed by the joint action of a series of factors. Let’s take a simplified network and see how it forms. Figure 1 shows a simplified complex connection network for ISML among region A, adjacent region B of region A, adjacent region C of region A, as well as adjacent regions B and C but not adjacent region D of region A, under the three key factors of geographical proximity, technological innovation, and carbon emission efficiency.

Formation mechanism of spatial connection.
Specifically, first, the modernization construction activities of industrial system among adjacent regions have natural geographical connections, which is not only reflected in their proximity and similar natural environments, but also in their similar basic conditions, strong policy consistency, small differences in development levels, and others. This facilitates the low-cost absorption of resource elements from adjacent regions and cooperation with them, forming a basic transmission path with natural properties and high efficiency characteristics for spatial correlation network for ISML.
Second, technological innovation is the core driving force for building a modernized industrial system (CGTN, 2026a). It can accelerate the upgrading and transformation of traditional industries, cultivate and strengthen strategic emerging industries, actively develop modernized industrial clusters, so as to promote the formation of a modernized industrial system with local characteristics. This further means that through spatial spillover effects, participating entities such as enterprises and governments in other regions can learn, imitate, and create, thereby forming the network connection and comprehensively improving China’s ISML. Of course, the higher ISML, the easier it is for regions to establish communication channels with other regions, the more a region forms communication with multiple parties, and the more information it can obtain. This not only facilitates the systematic analysis and judgment of ISML for the local region, but also affects the flow of knowledge, talent and other factors among regions, providing supporting conditions for the region to leverage its local advantages and improve its local disadvantages.
Third, economic and ecological factors have a significant impact on China’s ISML and its formation of spatial correlation network. Building a modernized industrial system requires both ecological and economic benefits. In this regard, this paper analyzes carbon emission efficiency with both economic and ecological attributes (Cai et al., 2025; Wang et al., 2025). Improving carbon emission efficiency can provide a good external environmental foundation for overall improving ISML and its formation of spatial correlation network, help guide the flow of green elements in a positive direction, narrowing the gap between core and peripheral regions, and promoting the maximization of overall social benefits. Conversely, high ISML and its spatial correlation network can upgrade industrial structure, improve production efficiency, promote industrial greening and ecologicalization, thereby effectively improving carbon emission efficiency.
Construction and Characteristic Analysis of Spatial Correlation Network for ISML
Gravity Model
Gravity model can not only determine the correlation and its intensity, but also characterize the network features of spatial correlation (Gu et al., 2023), numerically confirming that inter-provincial ISML has spatial connection and forms a complex connection network. Therefore, a gravity model is used to study whether there is spatial correlation among 30 provinces in ISML, as well as their corresponding correlation intensity. The specific formula is as follows:

Where Iij is the gravitational value of ISML between province i and province j (viz. spatial connection intensity); Mi and Mj denote the comprehensive evaluation index value of ISML in province i and province j, respectively; dij represents the distance between the provincial administrative division points of province i and province j; g = Mi/Mi + Mj.
In order to accurately analyze the spatial connection path and intensity among provinces, eliminate the dimensional influence and enhance the comparability of results, gravitational values are standardized by [0,1]. The specific formula is as follows:
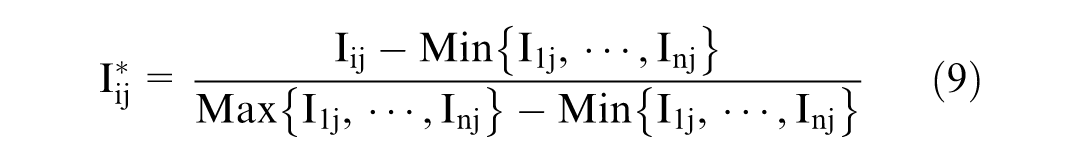
Where n denotes total number of provinces; Iij* is the standardized gravitational value, while max {I1j,…, Inj} and min {I1j,…,Inj} are the maximum and minimum values of Iij, respectively.
Social Network Analysis
Social network analysis (SNA) can reflect the overall structure, relationship characteristic and interaction strength of element nodes, and is an important method for exploring network geographic feature and spatial effect (Hu et al., 2024; Huang et al., 2024). For a more complete study, a spatial correlation matrix will be constructed based on the above gravity model, and the spatial correlation characteristics and evolution of China’s ISML can be further analyzed through SNA. Notably, we first obtain the gravitational value Iij through formula (8) to construct a 30 × 30 spatial correlation matrix for ISML. Afterward, it is to reshape the 30 × 30 spatial correlation matrix using a cumulative algorithm to perform binary transformation. That is, if the element value of reshaping matrix is greater than 0, it is denoted as 1; otherwise it is denoted as 0. From this, a 30 × 30 spatial binary matrix for ISML is constructed with one province as a network node, as a foundation of social network analysis. Here, the reason for using a province as a network node is: China’s provinces are important nodes in forming regional connections, and inter-provincial resource allocation can go up to the national level and down to the urban level.
Then, based on the aforementioned spatial binary matrix, four parts of analysis are conducted. First, overall network structure feature analysis. Specifically, network size (NS) is measured by the number of network nodes, and the larger NS is, the more provinces will participate in the modernization of industrial system as well as form network connection; network density (ND) represents the degree of closeness between provinces, and the larger ND is, both the greater the impact of the network for ISML on ISML of a certain province and the closer the connection between provinces in terms of ISML will be; network efficiency (NE) refers to the connection efficiency of each node in a spatially correlated network, reflecting the redundancy of connections in a network, and the higher NE is, both the looser the connection between ISML in each province and the more unstable this network structure will be; network correlation degree (NC) reflects the stability and fragility of a network structure, and a larger NC indicates a more stable network structure; network hierarchy (NH) is used to reflect the main position of a network node in the spatial connection network, and the higher NH is, the stricter the hierarchical structure in the network related to ISML will be; average distance length (ADL) measures the degree of tightness or separation between nodes in a network, meanwhile a shorter ADL usually means that in a network, nodes are more tightly connected, and information or resources may spread more quickly and efficiently; clustering coefficient of a node ( LCCi) is the ratio of actual number of edges between its neighbors to the maximum possible number of edges, and a high LCCi means that it is easy to form tight clusters or community structures; clustering coefficient (GCC) of a network is usually the average of clustering coefficients of all nodes, and the higher GCC, the stronger the network cohesion of ISML.
Second, network centrality analysis relies on three relative centrality. Degree centrality (DCi) reveals network control ability of province i, that is, the larger DCi is, both the higher the importance of province i in this network for ISML and the wider the scope of cooperation will be. Betweenness centrality (BCi) reflects the ability of network media of province i, and the higher BCi is, the stronger the inter-provincial liquidity will be, which is more conducive to resource allocation. Closeness centrality (CCi) shows the degree to which a certain node i is not controlled by other nodes, and a larger CCi indicates that province i is more able to establish more direct connections without being constrained by other provinces.
Third, core-periphery analysis and cohesive subgroup analysis. The main analysis contents are as follows: some provinces located in a core region have obvious resource endowment advantages and are prone to forming cohesive subgroups, while other provinces located in a periphery region have the opposite; the existence of cohesive subgroups indicates the emergence of closely connected small groups, namely, there are regional collaborative strategic partners for improving ISML.
Fourth, block model divides all provinces into some blocks to analyze the position and function of blocks in the network, as well as their relationship and connection method with other blocks. According to the status and role of block, it is divided into four types of blocks: the number of relationships overflow from net beneficiary block to other blocks is much smaller than that it receives from the others; net spillover block has significantly fewer relationships with internal members than those with other blocks, and receives fewer relationships from other blocks; bidirectional spillover block has both spillover relationships to other blocks and internal blocks, but receives fewer outgoing relationships from other blocks; broker block not only sends out relationships to other blocks, but also receives more spillover relationships from other blocks, playing a mediating and bridging role in a network.
Given the word limit and the maturity of this method, we will not elaborate further. The relevant calculation formulas can be directly referenced to the research of Hu et al. (2024) and Huang et al. (2024).
Analysis of Quadratic Assignment Procedure
Quadratic Assignment Procedure (QAP) is a reliable method for studying the influencing factors of spatial correlation network. This method can effectively avoid the errors caused by multicollinearity and is more robust than traditional parameter tests. Specifically, QAP correlation analysis and QAP regression analysis are used to determine the relevant influencing factors of spatial correlation network for China’s ISML (Han et al., 2024; Liu & Yuan, 2023). The formula is as follows:

Where Y is explained variable, representing the spatial correlation matrix of China’s ISML, which is constructed based on the comprehensive index A calculated in section “Measurement of ISML”; GP, TI, and CE are explanatory variables, which are geographic proximity matrix, technological innovation difference matrix, and carbon emission efficiency difference matrix, respectively. Specifically, GP is a adjacency matrix that is marked as 1 when two provinces are adjacent, otherwise marked as 0; TI is a technology innovation difference matrix constructed based on the number of patent applications (PCS) to measure the level of green technology innovation; CE is the carbon emission efficiency matrix constructed according to GDP and energy carbon emissions (108 yuan/104 tons). Among them, the calculation method and coefficient of energy carbon emissions refer to the “2006 Intergovernmental Panel on Climate Change National Greenhouse Gas Inventory Guidelines” (IPCC, 2006).
Results
Measurement Result and Network Formation Prerequisite of ISML
Temporal-Spatial Characteristics
The comprehensive evaluation index of China’s ISML calculated by the fixed base difference entropy weight method, and corresponding results are shown in Figure 2.

Measurement result of China’s ISML.
From temporal characteristic, China’s ISML and its growth rate showed an upward trend year by year from 2011 to 2020. In 2020, China’s ISML doubled, with a growth rate of 47.2209%, far higher than the average annual growth rate of 19.1198% during this period. For each province, the growth rate of ISML has also been increasing year by year. The positive development of China’s ISML is closely related to the implementation of a series of policies in the country. In 2012, the “‘12th Five-Year Plan’ for the Development of National Strategic Emerging Industries” was proposed to promote industrial prosperity from multiple dimensions such as green, digitalization and economy (The Central People’s Government of the People’s Republic of China, 2012); in 2017, the report of the 19th National Congress of the CPC encouraged China to unanimously promote the construction of modernized industrial system and improve ISML (CGTN, 2026a). However, in 2021, although China’s overall ISML was improving, the overall growth rate had dropped to 22.3288%; even though there were some provinces with growth, such as Beijing, Guangdong, Gansu, Ningxia and Xinjiang, with the growth rate of Xinjiang reached 369.1485%, most provinces’ ISML grew against the trend, with Inner Mongolia recording a particularly sharp decline of −77.2923%. This is because the global public health security epidemic occurred at the end of 2019, the epidemic fully broke out in 2020, and after 2021, China changed the overall epidemic control methods, which gradually drove industrial recovery and development, propelled the economy into a stable recovery phase, and improved ISML. Meanwhile, some provinces with strong economies, such as Beijing and Guangdong, could withstand the impact of the pandemic better and maintain stable or even improve ISML, while economically weaker provinces could not. Thus, China’s policy tends to support the provinces with weaker economies, such as Gansu, Ningxia and Xinjiang, to prevent more unfavorable factors from existing in underdeveloped areas, and ultimately alleviate the overall impact on a country. At present, the potential for improving ISML is still affected by the previous epidemic. In the future, promoting the construction of modernized industrial system and comprehensively improving ISML is a major issue and challenge.
From spatial characteristic, there are significant differences in ISML among provinces, and these gaps are widening year by year, with a clear regional differentiation pattern of “high in the east and low in the west.” By 2022, the difference reached 8.6490 between Ningxia with the highest level of industrial system modernization, and Inner Mongolia with the lowest level. Although China’s ISML is constantly improving, it has long been characterized by imbalanced and insufficient development within China, and regional strategies can only alleviate but cannot completely solve the crux differences, such as technological and geographical differences. Therefore, these ultimately leads to a significant inter-provincial difference in ISML, and the gap is still widening. In the future, regional imbalances cannot be ignored.
Dagum Gini Coefficient and Decomposition Results
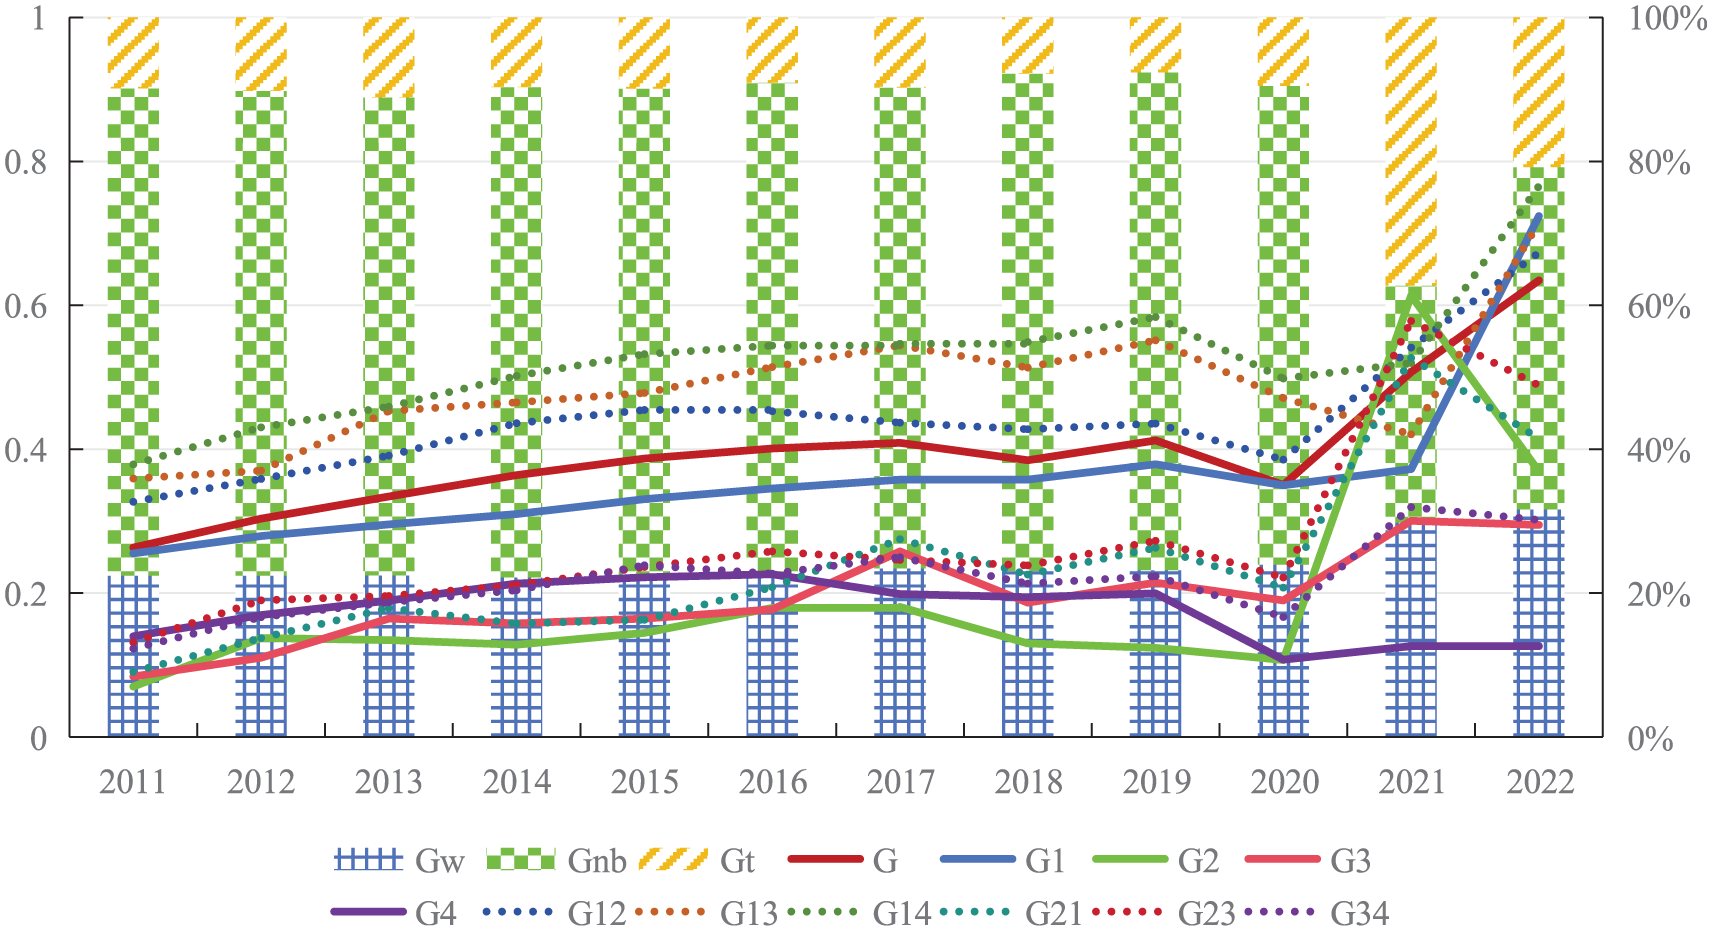
The results of Dagum Gini coefficient and its decomposition method are shown in Figure 3. In terms of the overall Gini coefficient (G), we can find that there are significant regional differences in ISML. And except for a slight decrease in 2018 and 2021, the coefficient increased in all other years, and reached 0.6345 in 2022 that exceeded the mean value of 0.3958 during the inspection period. In terms of the Gini coefficient within region j (Gj), during the sample period, the Gini coefficient in the eastern region was the highest and exceeded 0.7239, while those for other regions were significantly lower. This result likely stems from the fact that China’s eastern region is economically more advanced and industrialized, allowing it to lead the implementation of policies for modernized industrial construction in the country. From the Gini coefficient between region j and region h (Gjh), there is a significant difference in ISML between China’s eastern region and other regions. However, over time, this difference tends to stabilize and only shows a significant increase in 2022. This result indicates that the central, western, and northeastern regions are accelerating and have the potential to reach or surpass the high modernization level of industrial system in the eastern region. In addition, the Gini coefficient between the central region and western region, northeast region, as well as the western and northeastern regions, is smaller than that between the eastern region and central region, the western region, northeastern region, but China’s ISML still shows an overall regional imbalance. In fact, this is consistent with the actual situation of industrial development in the country. The favorable developmental foundation of the eastern region resulted in economic, ecological and social benefits, while other regions such as Guizhou, which has rich natural resources but lacks industrial variety, has weak digital foundation and high debt, resulting in a low level of industrial system modernization and an unclear growth trend.
Dagum Gini coefficient and its decomposition results.
From the perspective of contribution, the regional differences in ISML from 2011 to 2020 mainly come from inter-regional differences, and the contribution rates of this part were all above 65%; during the sample period, the contribution of within-regional differences (Gw) presented a stable upward trend, but they didn’t exceeded the contribution of inter-regional differences (Gnb); the contribution of inter-regional differences was less than 65% in 2021 and 2022, and the main source of regional differences in ISML in 2021 became contribution from hypervariable density (Gt); in 2022, the regional differences of ISML were very close to inter-regional differences and within-regional differences, and the overlapping effects between different regions were less pronounced.
Through analysis, it is concluded that there are differences in China’s ISML between regions, within regions and among provinces within different regions. On this basis, when promoting China’s ISML as a whole, no province should fall behind. This also prompts a province to form inter-provincial and cross-regional flow channels as well as cooperation platforms with provinces both within a region and in other regions. The aim is to learn from the experiences and lessons of other provinces, optimize resource allocation efficiency, promote smooth flow of factors and others, thereby improving ISML in the province and also collaborating with other provinces to improve ISML by obtaining essential external resources and driving the outward flow of local resources for profit. Thus it can be said that China’s ISML has formed a complex connection network, and subsequent analysis should also be based on this.
Spatial Connection Intensity of ISML
Under the results presented in Section “Measurement result and network formation prerequisite of ISML,” according to the measured values of ISML in the previous text, a gravity model is used to calculate the gravity values among provinces of ISML in China. Then, ArcGIS is used to draw the spatial network topology map for 2011, 2014, 2017, 2020, and 2022, presenting the complex network formed by China’s ISML (Figure 4). It is notable that: the background color of maps shows the change in China’s ISML, which is consistent with the analysis in section “Temporal-Spatial Characteristics,” and this section will not be elaborated further; each map has 435 gravitational lines that are divided into such five levels based on specific content as “low,”“relatively low,”“general,”“relatively high,” and “high.”

Spatial connection intensity of China’s ISML: (a) 2011, (b) 2014, (c) 2017, (d) 2020, and (e) 2022.
As a whole, the geographical proximity constraint of ISML in 30 provinces in China has been broken. This not only has an industrial linkage effect on ISML in adjacent provinces, but also has a complex spatial interaction relationship with non-adjacent provinces. In terms of time, the overall spatial connection strength of inter-provincial ISML is gradually increasing, and so are gravitational lines at the “general,”“relatively high,” and “high” levels. But the overall spatial connection strength of inter-provincial ISML still needs to be improved. By 2022, the numbers of “low,”“relatively low,”“general,”“relatively high,” and “high” spatial connection intensity lines of China’s ISML between provinces accounted for 32.1839%, 9.8851%, 40.2299%, 9.6552%, and 1.1494%, respectively. This means that the level of inter-provincial connection in China’s industrial system modernization is still relatively low, and it is essential to increase the connection intensity. In terms of space, China’s ISML shows a stronger spatial connection between provinces in the eastern region compared to those in the central, western, and northeastern regions, and the connections formed between the eastern region and other regions are also stronger than those between other regions. The reason is that the better modernization development conditions of industrial system in the eastern region can attract learning and absorption from the central and western regions, and with the effective promotion of regional strategy, spatial linkage is enhanced. In addition, there are many gravity lines that belong to “relatively high” and “high” levels with important economic, political, and technological development core areas in China such as Beijing, Jiangsu, and Zhejiang as nodes. However, by 2022, ISML between Qinghai and Ningxia, as well as Qinghai and Xinjiang, also formed a “high” level spatial connection. This indicates that in order to build a modernized industrial system and improve China’s ISML, it is necessary to consider regional conditions and adapt to local circumstances, promote the strength of network connections in secondary development zones, so as to form an effective connection network across the country.
Structural Characteristic and Evolutionary Trend of ISML Using SNA
Overall Network Structure Characteristic Analysis
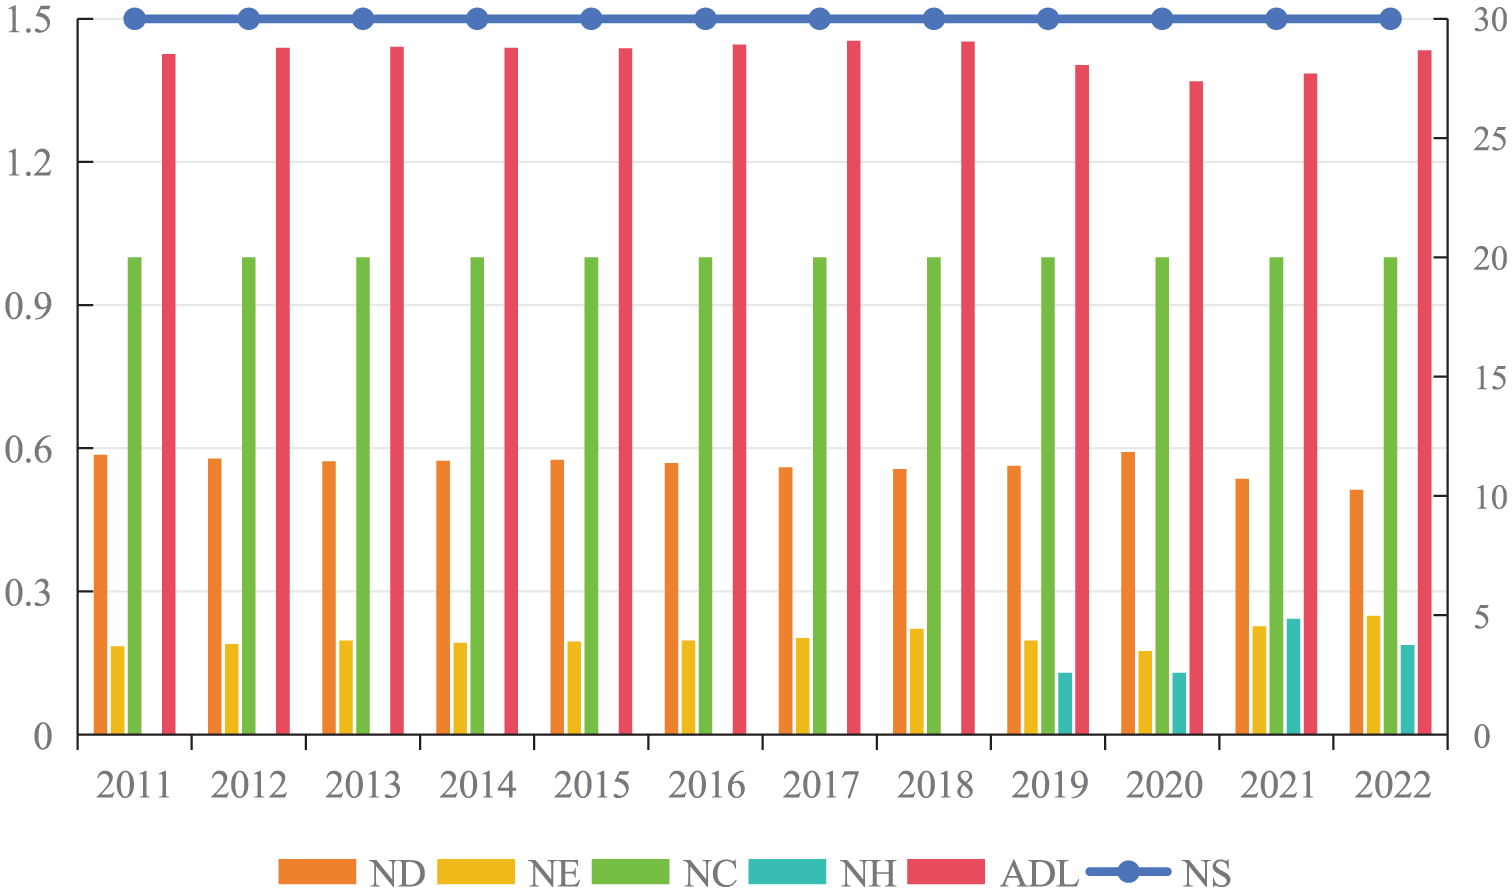
As shown in Figure 5, from 2011 to 2022, the values of network size (NS), network density (ND), and other measurement indicators for the spatial network structure characteristic of China’s ISML were relatively stable, with slight fluctuations around the corresponding mean values. It should be noted that, the above indicators fluctuated more frequently from 2019 to 2022, which is also in the post-epidemic period. Among them, network efficiency and network hierarchy fluctuate the most, and the number of ineffective connections has increased. This means the important role of doing a good job of prevention and control in the future, especially in dealing with unknown public health security threats. To sum up, China’s provinces have crossed geographical boundaries and formed complex network connections among provinces. And overall, inter-provincial connection is relatively close, while inter-provincial communication is smooth and cohesive, with stable connections and channels between provinces, and the spatial connection network structure is robust.
Overall network structure characteristic indicators from 2011 to 2022.
Network Centrality Analysis
It is to utilize such three indicators as degree centrality (DC), betweenness centrality (BC), and closeness centrality (CC) to investigate the relative central positions of 30 provinces in China for spatial correlation network of ISML. The results are shown in Figure 6. In terms of time evolution, the average level of the above three central indicators continued to rise nationwide, their mean values were respectively 23.5333, 11.3333, and 35.7333 in 2022, and the three centrality indicators in most provinces exceeded the corresponding mean values. This hints that the spatial network relationship of ISML is constantly becoming more complex in China, and the status and role of provinces in the network are overall improved. And this situation is consistent with the ISML time trend.

Network centrality of China’s ISML: (a) DC, (b) BC, and (c) CC.
In terms of spatial evolution, the influence of Chinese provinces in the spatial correlation network is unbalanced, and the influence of provinces in the eastern and northeastern regions is relatively high, but there are still some provinces with high influence in the central and western regions. For example, the above three central indicators were relatively high in Beijing and Sichuan, and at least two of them presented an upward or stable trend. The reason is that under the guidance of regional strategy and inter-provincial collaborative engineering proposed by China, with the continuous development of China’s socio-economy, the cross regional obstacles of factor flow are gradually being broken, each region has formed some provinces with the core goal of developing its own region and effectively connecting other regions according to development requirements, thereby ensuring the overall development of local region and whole country. This is conducive to building a modernized industrial system where the fruits of development are shared by the nation and comprehensively improving ISML.
Core-Periphery Analysis and Cohesive Subgroup Analysis
The results of core-periphery analysis and cohesive subgroup analysis are shown in Figure 7. First, China’s ISML presented a typical “core-periphery” spatial pattern. Among the 30 provinces in China, the number of core provinces increased every year, and this number reached 18 in 2022. On the one hand, this indicates that China has gradually formed many growth poles that drive the development of industrial system, and the effective utilization for resource advantages of each province has become a reality. On the other hand, this implies that the complexity and stability of spatial connection network reflecting the inter-provincial ISML in China are gradually increasing, which is very compatible with China’s current and future development. Second, in 2011, 2014, 2017, 2020, and 2022, some provinces consistently belonged to core provinces, such as Beijing, Chongqing, and Sichuan, while some provinces consistently to peripheral provinces, such as Guangxi and Gansu, but most provinces moved frequently towards core province targets, such as Shanxi, Jiangsu, and Xinjiang. However, due to the influence of their geographical locations, economic development, cultural customs, and other factors, some provinces are facing difficulties in reversing their position. For example, Xinjiang, although the three centrality indicators in 2022 were high, has limited resources and insufficient catching up strength, which makes it difficult to become a growth pole to drive the development of industrial system and that of surrounding provinces. Third, core provinces always form cohesive subgroups with periphery provinces, and the latter is always led by the former with higher ISML as well as economic, technological, and talent advantages. And although China’s eastern, central, western, and northeastern regions have their core provinces, the cohesive subgroups are mainly centered around the developed eastern provinces. This implies that in building a modernized industrial system, each province and region should promote economic, cultural, and other aspects of development and improve ISML. All in all, China should establish inter-regional and inter-provincial collaborative strategic partners to break the shackles of economic, technological, geographical, and other conditions, form close connections through “highland” leading, “bottom” following and local cooperation under the strategic characteristics of regional cooperation and exchange in China, and finally improving ISML as a whole.

Core-periphery analysis and cohesive subgroup division of China’s ISML: (a) 2011, (b) 2014, (c) 2017, (d) 2020, and (e) 2022.
Block Model Analysis
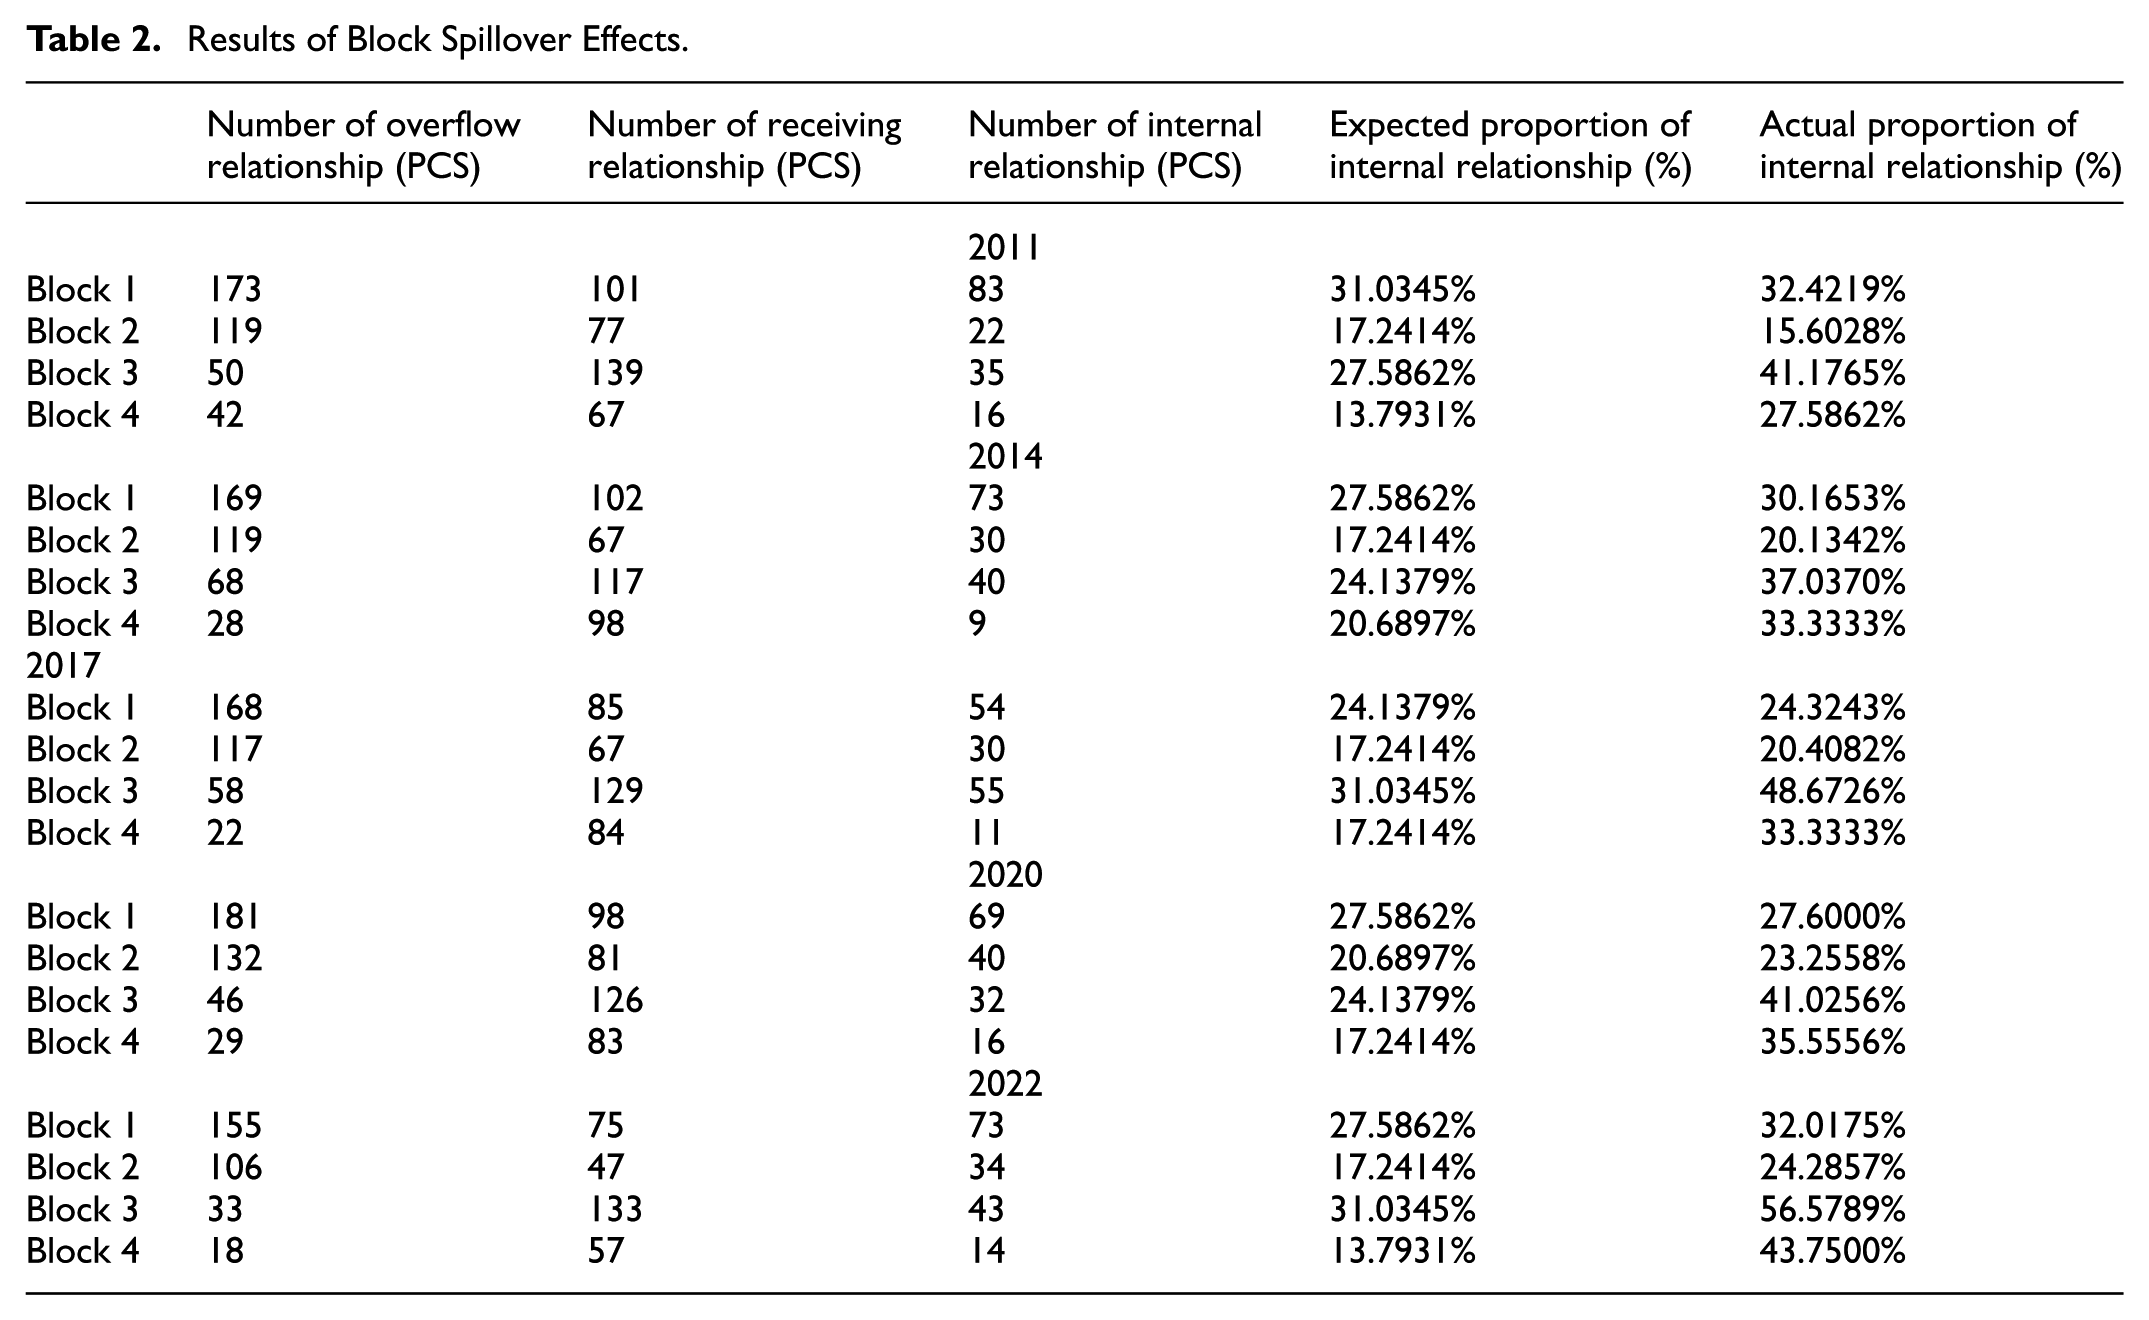
In this section, we adopt CONCOR algorithm in UCINET and simultaneously set a maximum segmentation depth to 2 as well as a concentration standard to 0.2000 to obtain four blocks (viz. corresponding to the above four cohesive subgroups), then to conduct an in-depth analysis of the internal structure for spatial correlation network of China’s ISML and the roles played by each province. According to Table 2, block 1 belonged to a broker block, and played an intermediary and bridge role in the spatial connection network of China’s ISML; block 2 belonged to the bidirectional spillover block, indicating that the provinces within this block can form significant spatial connections with other blocks through industrial transfer, talent flow, commercial cooperation, etc; block 3 was a net benefit block, meaning that the provinces in this block mainly promote the comprehensive improvement of ISML and form network connections through absorbing other block’s favorable spillover, such as “technological dividend”; and block 4 was a net spillover block, which belongs to the block that delivers dividends to other blocks.
Results of Block Spillover Effects.
To further investigate the interactions between blocks, we calculate the network density and image matrix of each block (Table 3). Among them, this image matrix is obtained from the network density, that is, when the network density of a block is greater than the overall network density, it is assigned a value of 1 in the image matrix, otherwise it is 0. Here, 1 indicates the existence of transitive relation, while 0 indicates the absence of transitive relation. From Table 3, block 1 plays a role of “transmitter” in the spatial connection network of ISML and constructs a complete correlation path with other blocks, in which most of the provinces in this block are China’s main political centers, policy implementation centers, and cultural centers, such as Beijing, Chongqing, and Shaanxi. The spatial connection between block 1 and block 2 in China’s ISML is very active, and they can form two-way connection with other blocks. However, block 3 and block 4 are mainly one-way connection, which may be due to greater advantages resulting from the connection with a certain block in the network in comparison to that between certain blocks, as a result of factors such as the level of economic development, infrastructure configuration, and other factors.
Density Matrix and Image Matrix.

Note: if the results of Image Matrix in 2017, 2020 and 2022 are the same as those for 2014, they can be expressed as.
In short, the construction of modernized industrial system is closely related to China’s ISML and its dynamic correlation among provinces. In the future, China should have effective measures according to local conditions to enhance the position of each province in the spatial correlation network of ISML and its correlation with other provinces, promote inter-provincial and inter-regional exchanges and cooperation, and balance local and overall benefits, so as to improve ISML.
Analysis of Influencing Factors
Identification of the factors influencing the spatial correlation network of China’s ISML is important for understanding its optimization path. Based on the analysis in section “Fixed Base Difference Entropy Weight Method” and the variables selected in section “Analysis of Quadratic Assignment Procedure,” we first use QAP correlation test to determine whether the involved regression variables have optimal explanatory power. Unlike traditional regression models, QAP performs regression between matrices, with each being a 30 × 30 matrix. The results obtained in Table 4 use a total of 48 matrices and undergo 5,000 random substitutions. From 2011 to 2022, except for a few years, there was a strong correlation between the explained variable and the three explanatory variables. This indicates that the spatial correlation matrix of ISML can be used as the explained variable, and geographic proximity matrix, technological innovation difference matrix as well as carbon emission efficiency difference matrix can be used as explanatory variables in QAP regression analysis.
Results of QAP Correlation Analysis.

Note: ***, **, and * indicate passing the test at the significant level of 1%, 5%, and 10%, respectively; Table 5 is the same.
The results of QAP regression analysis are in Table 5. First, although there is a certain correlation between the spatial correlation matrix of ISML and geographic proximity matrix, geographical proximity has become a negligible factor hindering connectivity. With the promotion of regional coordinated development strategies and improvement of transportation conditions, China’s ISML already has established harmonious connections among provinces or regions, created the complex network characteristics of “cross regional and non neighboring.” Therefore, China actually needs to break away from the “neighbor” mentality when building a modernized industrial system.
Results of QAP Regression Analysis.

Second, inter-provincial technological innovation difference is conducive to the formation of spatial correlation network for ISML. For one thing, technological gap between provinces can provide conditions for trans-regional and trans-provincial technological communication and transmission, indirectly promoting spatial spillover of ISML. For another, the current is a critical period for building a modernized industrial system, all provinces, subjects, and various resources participate in all aspects. Technological innovation is a supporting condition for industrial upgrading and resource allocation, which is conducive to improving resource utilization efficiency, optimizing industrial structure, improving factor flow, and others, and it is particularly valued. However, with the comprehensive improvement of technological innovation and the difficulty in breaking through core technologies, the role of technological innovation in China’s industrial system modernization has gradually reached saturation (Gu et al., 2023; Ding et al., 2024), coupled with the global public health security epidemic occurred at the end of 2019, resulting in a volatility decrease from 2019 to 2022. Of course, this saturation is also caused due to the relatively low level of industrial system modernization, limited utilization of technological innovation empowerment by each province, and insufficient technology spillovers.
Third, carbon emission efficiency difference matrix is positively correlated with the spatial correlation matrix of ISML, but the coefficient and its significance are decreasing over time. The reason is not difficult to understand. In the “12th Five-Year Plan period” and “13th Five-Year Plan period,” carbon emission reduction constraint indicators were proposed, indicating that economic development cannot abandon environmental protection. Later, in the “14th Five-Year Plan period” and the report of the 20th National Congress of the CPC, it again emphasized the coordinated development of economy and environment. This expresses that China attaches great importance to continuing to achieve the goals of “carbon peak” and “carbon neutrality,” solving problems such as tight resource constraints and environmental pollution, and that only the coordination between high-quality economic development and efficient ecological protection is the hard principle of sustainable development in the future. But, an outbreak of public health safety incident at the end of 2019 broke down the sustained “benefit” effect brought about by carbon emission efficiency, quickly recovering China’s economic situation and stabilizing social security became key works. To this end, we need to fully tap into the positive effects of technological innovation, while getting rid of the “neighbor” mentality, considering the impact of carbon emission efficiency and being vigilant to sudden safety incidents, to promote the construction of a modern industrial system.
Conclusions
Effectively improving China’s ISML and optimizing the spatial connection network pattern of ISML is an important foundation for the development of real economy, a main starting point for achieving high-quality development, and a key content of Chinese modernization process (CGTN, 2026a, 2026b). Our exploration improves upon existing research and explores China’s ISML and its improvement path. Our findings are threefold:
First, in China, overall trend of dynamic evolution for ISML is good, and the inter-provincial differences are very obvious. This is consistent with the research results of Han and Deng (2025). However, under our longer research period compared with previous studies, the growth rate of China’s ISML decreased in 2021. The reason is that the global public health security epidemic occurred at the end of 2019, the epidemic fully broke out in 2020, and after 2021, China transformed its overall epidemic control methods, focusing on restoring industries and developing the economy, and ISML began to recover.
Second, the spatial correlation effect of ISML is no longer constrained by geographical proximity, forming a relatively stable, complex, and multicenter spatial correlation network that radiates across the country. In addition, the stronger the network connection, the higher the corresponding ISML. And the connectivity strength and density of the network displayed in different regions, as well as the connectivity number and strength that can be formed in different provinces, are all related to ISML. For example, China’s eastern provinces with higher ISML have a higher influence in the network and play a role as intermediaries, bridges, and gathering underdeveloped provinces in other regions.
Third, geographical proximity creates natural connections among provinces or regions, but it has become a negligible factor hindering connectivity. The reason is that the current spatial correlation network of ISML in China already has complex network characteristics of “cross regional, non adjacent” under the promotion of regional coordinated development strategies and improvement of transportation conditions. Technological innovation can provide conditions for knowledge dissemination, resource circulation and others across regions and provinces, as well as improve resource utilization efficiency, optimize industrial structure and others, thereby indirectly and directly affecting ISML and its spatial correlation network (CGTN, 2026a; Han & Deng, 2025). Improving carbon emission efficiency can build a good external environmental foundation for ISML and its network, help guide green elements to flow in a positive direction, narrow the gap between core and peripheral areas, and promote the maximization of its overall social benefits (Cai et al., 2025; Wang et al., 2025). However, the impact coefficient and significance of technological innovation and carbon emission efficiency gradually weakened after 2019. This means that the impact of sudden and large-scale events on China’s ISML and its spatial correlation network is significant.
Based on the above results, the following suggestions are proposed.
First, China should grasp the overall characteristics of modernized industrial system, and comprehensively improve ISML as well as complexity and stability of its network from specific aspects such as integrating the real economy, improving related supporting facilities, promoting the development of high-tech industries, driving industrial green transformation, and strengthening the industrial safety supervision system.
Second, China should confront regional and inter-provincial differences, break away from the “neighbor” mentality, combine tailored planning and implementation with strengthening regional and inter-provincial linkage and establishing regional and inter-provincial cooperation platforms, and ultimately build a high-level correlation network for ISML. Especially, China’s eastern region should continue to leverage its advantages to build the system and lead other regions, while the western region should focus on its own characteristics and form a core province in the region to actively catch up with other regions, thereby narrowing the gap and promoting overall progress in ISML.
Third, to fully tap into the positive effects of technological innovation. China not only needs to increase investment in research, development and incubation of technological innovation, but also promote the establishment of innovation carriers such as technology enterprise incubators that focus on building a modernized industrial system. Meanwhile, relevant policy support should be provided to enable all participating entities in building the system to participate in improving the transformation and utilization of available innovation achievements.
Fourth, taking into account the impact on carbon emission efficiency. China should follow the concept of green development, balance economic and ecological benefits, accelerate the elimination of high consumption and high emission non essential industries, guide the benign flow of green elements, and then achieve the maximization of overall social benefits, and provide favorable ecological environment and sustainable development conditions for improving the complexity and stability of ISML and its spatial correlation network.
Fifth, to be vigilant and respond promptly to sudden public health emergencies or other unexpected events. For one thing, China should strengthen the basic capabilities of industry, build a complete emergency material reserve and production system, cultivate a group of enterprises with rapid production capacity, to ensure that production capacity can be rapidly expanded in case of emergencies. For another, China should establish cross-industry and cross-regional emergency industry alliances to achieve information sharing and resource complementarity, aiming at forming a collaborative response to emergencies.
Nevertheless, this study has certain limitations. Considering the integrity of data acquisition, we only study 30 provinces in China, excluding Tibet, Hong Kong, Macao, and Taiwan. Additionally, our index system may not be detailed enough, as ISML is a multifaceted concept with complex connotations and opinions varying from person to person. However, these limitations do not undermine the validity of our findings. Instead, they clarify that our study provides reference for future research on the issues related to building a modernized industrial system and promoting national modernization in China.
Footnotes
Ethical Considerations
This article does not contain any studies with human or animal participants.
Consent to Participate
The requirement for informed consent is not applicable to this article.
Author Contribution
Lin Zhang: Conceived and designed the study; analyzed and interpreted the data; drafted the article.
Hazel Arugaslan: Restructured the arguments and presentation of findings, critically edited the article.
Chengzhi Cai: Critically revised the important intellectual content; finally approved the submitted version.
Devrim Yaman: Reviewed the content and readability of the article
Funding
The authors received no financial support for the research, authorship, and/or publication of this article.
Declaration of Conflicting Interests
The authors declared no potential conflicts of interest with respect to the research, authorship, and/or publication of this article.
Data Availability Statement
The datasets generated during and/or analyzed during the current study are available from the corresponding author on reasonable request.